HAL Id: tel-00858906
https://tel.archives-ouvertes.fr/tel-00858906
Submitted on 6 Sep 2013
HAL is a multi-disciplinary open access archive for the deposit and dissemination of sci- entific research documents, whether they are pub- lished or not. The documents may come from teaching and research institutions in France or
L’archive ouverte pluridisciplinaire HAL, est destinée au dépôt et à la diffusion de documents scientifiques de niveau recherche, publiés ou non, émanant des établissements d’enseignement et de recherche français ou étrangers, des laboratoires
sécuritaires avec véhicules communicants
Stéphanie Lefèvre
To cite this version:
Stéphanie Lefèvre. Estimation du risque aux intersections pour applications sécuritaires avec véhicules communicants. Autre [cs.OH]. Université de Grenoble, 2012. Français. �NNT : 2012GRENM070�. �tel- 00858906�
Intersections are the most complex and dangerous areas of the road network. Statistics show that most road intersection accidents are caused by driver error and that many of them could be avoided through the use of Advanced Driver Assistance Systems. In this context, vehicular communications are a very promising technology. The sharing of information between vehicles over wireless links allows vehicles to perceive their environment beyond the field-of-view of their on-board sensors. Thanks to this enlarged representation of the environment in time and space, situation assessment is improved and dangerous situations can be detected earlier.
This thesis tackles the risk estimation problem from a new perspective: a framework is proposed for reasoning about traffic situations and collision risk at a semantic level, while classic approaches typically reason at a trajectory level. Risk is assessed by estimating the intentions of drivers and detecting conflicts between them, rather than by predicting the future trajectories of the vehicles and detecting intersections between them. More specifically, dangerous situations are identified by comparingwhat drivers intend to dowithwhat drivers are expected to do according to the traffic rules.
The reasoning aboutintentions andexpectationsis performed in a probabilistic manner, in order to take into account sensor uncertainties and interpretation ambiguities.
This framework can in theory be applied to any type of traffic situation; here we present its application to the specific case of road intersections. The proposed motion model takes into account the mutual influences between the maneuvers performed by vehicles at an intersection. It also incorporates information about the influence of the geometry and topology of the intersection on the behavior of a vehicle. The approach was validated with field trials using passenger vehicles equipped with Vehicle-to-Vehicle wireless communication modems, and in simulation. The results demonstrate that the algorithm is able to detect dangerous situations early and complies with real-time constraints.
Les intersections sont les zones les plus dangereuses du réseau routier. Les études d’accidentologie montrent que la plupart des accidents aux intersections sont causés par des erreurs des conducteurs, et qu’une majorité d’accidents pourraient être évités grâce à l’utilisation de systèmes d’aide à la conduite.
Dans ce cadre, les communications inter-véhiculaire sont une technologie particulièrement promet- teuse. Le partage d’informations entre les véhicules via des liens sans fil permet à chaque véhicule de percevoir son environnement au-delà des limites de champ de vision de ses capteurs embarqués. Il en résulte une représentation de l’environnement plus étendue dans l’espace et dans le temps, ce qui améliore la compréhension de situation et permet d’anticiper le danger.
Cette thèse aborde le problème de l’estimation du risque sous un angle nouveau : elle propose une structure de raisonnement pour analyser les scènes routières et le risque de collision à un niveau sémantique, contrairement aux approches classiques qui raisonnent au niveau des trajectoires. Le risque est calculé en estimant les intentions des conducteurs et en détectant les conflits, sans avoir à prédire les trajectoires futures des véhicules. Plus précisément, la détection des situations dangereuses est basée sur la comparaison entrece que les conducteurs ont l’intention de faireetce que les conducteurs devraient faire d’après les règles de la circulation. Ce raisonnement est réalisé de manière probabiliste afin de prendre en compte les incertitudes sur les mesures capteur et les ambigüités sur l’interprétation de la scène.
En théorie ce raisonnement peut être appliqué à tout type de scène routière ; dans cette thèse nous présentons son application aux intersections. Le modèle proposé prend en compte l’influence que la manœuvre d’un véhicule exerce sur la manœuvre des autres véhicules. Il incorpore aussi des informa- tions sur l’influence de la géométrie et topologie de l’intersection sur le comportement d’un véhicule.
L’approche proposée a été validée par des tests en environnement réel avec des véhicules commu- nicants, ainsi qu’en simulation. Les résultats montrent que l’algorithme est capable de détecter les situations dangereuses et qu’il est compatible avec des applications sécuritaires temps-réel.
Over the course of this PhD I worked in three different places. In each of them I have met people who had a great influence on my professional and personal life, and today I feel both lucky and grateful for this opportunity.
I would like to start by thanking my two supervisors: Christian Laugier from Inria and Javier Ibañez- Guzmán from Renault. Thank you for your constant support, for your patience with me (I know I can be stubborn...), and for encouraging me when my self-confidence was low. I learned a lot from you both, not only about research but also about random things like feeding cats and fighting sharks. The guidance provided by the two of you was complementary in many respects, and as a result this PhD really was a collaboration between Inria and Renault. I benefited from the expertise and resources of both: research methods and Bayesian formalism at Inria and driver assistance systems and test vehicles at Renault. I realize how lucky I am to have had access to so much knowledge and so many tools during my PhD.
The first year of my PhD was spent at Renault learning about driver assistance systems and participat- ing in the Safespot project. Thanks to Sylvain the long hours spent in cars running tests in the middle of winter were enjoyable. I am grateful to Olivier for passing along to me the precious knowledge he had accumulated during his PhD working with cars. Many thanks to the ADAS team for sharing their knowledge and for the good atmosphere at work: Sébastien, Charles, Javier, Christian S., Florent, Christophe, Christian C., Gaetan, Jean-François, Jean-Philippe, Johann, Stéphanie, and everybody else.
At the end of the Safespot project I went to the Stanford Artificial Intelligence Laboratory for an internship with Sebastian Thrun’s Driving Group. This was a great experience, and I would like to thank the whole team for welcoming me and sharing their tools. I would also like to thank Javier, Christian, and François for making this happen.
The next year was spent at Inria, where I could not have hoped for better team mates. We shared
Amaury, Igor, Alessandro, Manu, Pierre, Dizan, Christian, Myriam, Ago, Anne, Arturo, Vivien, Omar, Panos, Nicolas, Qadeer, Chiara, Jorge, and everybody else, thank you for being a wonderful team.
Special thanks to my office mates Chiara and Jorge, for bringing good mood (and good food) in the office again and again and again. To Pierre, Manu, Dizan, Mathias, and Alexandros, for many hours discussing Bayesian methods. To Myriam, for always finding solutions to our various administrative issues, and for smiling so much.
Going back to Renault for the implementation of my algorithms and the tests with the real cars, I found that I was no longer the only PhD student in the team. Laëtitia and Clément had joined the group, and the “PhD student team spirit” that ensued was a great help during that period. Also, a major part of this thesis would be missing if not for Jong-Hoon, Laëtitia, Clément, Nabil, Jérémy, and Jonathan. In total you ran 110 tests for me in La Brosse. Sometimes it rained, sometimes the sun shone, but everytime you were there for me and I am extremely grateful for that.
I would also like to thank my jury members for making the effort to read and review this thesis, for taking a long trip to attend the defense, and for giving me useful feedback.
Finally I would like to thank my family. My parents, for showing me in many different ways that they care for me, for supporting my life choices, and for always being there for me. My brothers, sister, brother-in-law, and sisters-in-law: I always feel close to you, even when we are far apart. Mike, thank you for showing me that I can become who I want to be. Everyday you were a source of motivation, and much more.
List of Figures xv
List of Acronyms xxi
Chapter 1 Introduction 1
1.1 Context: connected vehicles for road safety . . . 2
1.1.1 Accidents at road intersections . . . 2
1.1.2 Wireless vehicular communications . . . 6
1.2 Problem formulation . . . 17
1.2.1 Scope . . . 18
1.2.2 Challenges and classic approaches . . . 20
1.3 Contributions . . . 22
1.4 Thesis outline . . . 23
Chapter 2 Risk assessment at road intersections: state of the art 25 2.1 ‘Physical entities’ motion models . . . 28
2.1.1 Evolution models . . . 29
2.1.2 Trajectory prediction . . . 30
2.1.3 Limitations . . . 33
2.2 ‘Maneuvering entities’ motion models . . . 33
2.2.1 Prototype trajectories . . . 34
2.2.2 Maneuver intention estimation and maneuver execution . . . 37
2.3 ‘Interacting maneuvering entities’ motion models . . . 40
2.3.1 Models based on trajectory prototypes . . . 40
2.3.2 Models based on Dynamic Bayesian Networks . . . 41
2.3.3 Limitations . . . 42
2.4 Collision detection and risk computation . . . 42
2.4.1 Collision detection . . . 42
2.4.2 Risk computation . . . 44
2.5 Other approaches and conclusions . . . 46
2.5.1 Other approaches . . . 46
2.5.2 Conclusions . . . 47
Chapter 3 Proposed motion model and risk estimation 49 3.1 Overview of the proposed approach . . . 51
3.1.1 Background: representing vehicle motion with MSSMs . . . 51
3.1.2 Proposed approach for general traffic situations . . . 56
3.1.3 Application to road intersections . . . 59
3.2 Variable definition . . . 60
3.2.1 Intended maneuverItn . . . 60
3.2.2 Expected maneuverEnt . . . 62
3.2.3 MeasurementsZtn . . . 63
3.2.4 Physical stateΦnt . . . 63
3.2.5 Summary and notations . . . 64
3.3 Joint distribution . . . 65
3.4 Parametric forms . . . 67
3.4.1 Expected longitudinal motionEsnt . . . 67
3.4.2 Intended longitudinal motionIsnt . . . 69
3.4.3 Intended lateral motionIcnt . . . 70
3.4.4 PosePtn . . . 71
3.4.6 Turn signal stateTt . . . 74
3.4.7 Measured poseP mnt . . . 77
3.4.8 Measured speedSmnt . . . 77
3.4.9 Measured turn signal stateT mnt . . . 78
3.4.10 Summary . . . 78
3.5 Bayesian risk estimation . . . 78
3.6 Conclusions . . . 79
3.6.1 Summary . . . 79
3.6.2 Discussion . . . 79
Chapter 4 Experiments and results 83 4.1 Functional and safety evaluation in simulation . . . 85
4.1.1 Evaluation strategy . . . 85
4.1.2 Functional performance evaluation . . . 90
4.1.3 Safety performance evaluation . . . 93
4.2 Robustness evaluation with field trials . . . 96
4.2.1 Evaluation strategy . . . 96
4.2.2 Results . . . 103
4.3 The importance of context - Interactions between vehicles . . . 106
4.3.1 Evaluation strategy . . . 108
4.3.2 Qualitative evaluation . . . 109
4.3.3 Statistical results . . . 113
4.4 The importance of context - Intersection layout . . . 115
4.4.1 Evaluation strategy . . . 116
4.4.2 Qualitative evaluation . . . 118
4.4.3 Statistical results . . . 120
4.5 Conclusions . . . 123
4.5.1 Summary . . . 123
4.5.2 Discussion . . . 124
5.1 Summary . . . 127
5.2 Conclusions . . . 129
5.3 Perspectives . . . 130
Bibliography 135 Appendix A DSRC standards 147 Appendix B The importance of context 151 B.1 Intersection layout . . . 152
B.2 Interactions between vehicles . . . 152
B.2.1 Intuition . . . 153
B.2.2 Case study: non-dangerous scenario . . . 154
B.2.3 Case study: dangerous scenario . . . 157
B.3 Summary . . . 158
Appendix C Digital maps 159 C.1 Definitions . . . 159
C.2 High-level features . . . 160
C.3 XML code . . . 161
Appendix D Precision and recall analysis 167 D.1 Metrics . . . 167
D.2 Results . . . 168
Appendix E Accounting for physical limitations in the evolution model 171 Appendix F Inference for risk estimation 175 F.1 Variables . . . 176
F.2 Initialization . . . 176
F.3 Recursive risk computation . . . 177
1.1 Distribution of road accidents at intersections and out of intersections [1]. . . 3
1.2 Distribution of common accident scenarios in Germany and France [2]. . . 5
1.3 Distribution of accident causes [1]. . . 6
1.4 Impact of passive safety measures on the reduction of the number of accidents [3]. . . 7
1.5 Expected reduction in the number of accidents, and associated technologies [4]. . . 8
1.6 Set of applications targeted by the DRIVE-C2X project [5]. . . 10
1.7 V2X communications (in red) overcome the field-of-view limitations of on-board sen- sors (in green) at road intersections. . . 11
1.8 Set of applications targeted by the CICAS project [6]. . . 12
1.9 Cellular-based wireless vehicular communications. . . 14
1.10 DSRC-based wireless vehicular communications. . . 14
1.11 Satellite-based wireless vehicular communications. . . 15
1.12 Comparison of the different wireless communication technologies [7]. . . 15
1.13 Forecast deployment of DSRC [8]. . . 17
1.14 Intelligent vehicle architecture, based on the JDL model [9]. The hatched area defines the focus of this thesis. . . 18
2.1 Examples of motion prediction with the different types of motion models. . . 28
2.2 Trajectory prediction with a Constant Velocity motion model (source: [10]). . . 31
2.3 Trajectory prediction with a Constant Velocity motion model and Gaussian noise simu- lation. Ellipses represent the uncertainty on the predicted positions (source: [11]). . . 32
2.4 Trajectory prediction (green area) with Monte Carlo simulation (source: [12]). . . 33
2.6 Comparative review of works on maneuver intention estimation. . . 38 2.7 Maneuver execution using four different approaches. . . 39 2.8 Trajectory prediction with an ‘Interacting maneuvering entities’ motion model. The
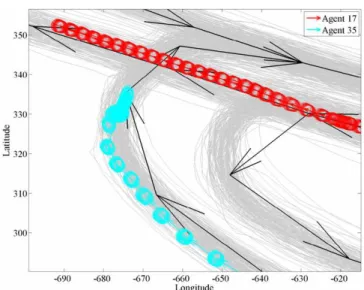
model is able to predict that Agent 35 should yield to Agent 17 (source: [14]). . . 41 3.1 Graphical representation of a base MSSM modeling the motion of a vehiclenbetween
timet−1andt. . . 52 3.2 Graphical representation of a HMM-based motion model for a vehiclen. . . 53 3.3 Graphical representation of a MSSM which accounts for the dependencies between the
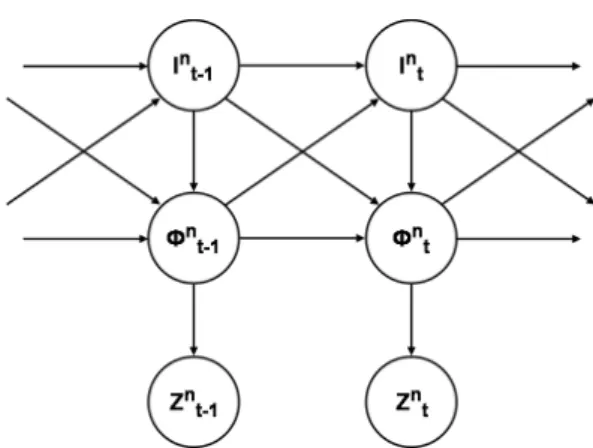
vehicles. Bold arrows represent multi-vehicle dependencies, i.e. the influences of the other vehicles on vehiclen. . . 54 3.4 Graphical representation of a CHMM-based motion model. . . 55 3.5 Graphical representation of the proposed MSSM. Bold arrows represent multi-vehicle
dependencies, i.e. the influences of the other vehicles on vehiclen. . . 56 3.6 List of accident scenarios addressed at X-shaped intersections. . . 60 3.7 Illustrative example for the "course" concept. The courses originating from one road
are displayed as blue arrows. . . 61 3.8 Detection of dangerous situations by comparing intention Isnt and expectation Esnt:
example scenarios. . . 65 3.9 Computation ofP(Esnt|Ict−1Pt−1St−1)in an example situation. . . 69 3.10 Example average and maximum speed profiles generated for a maneuver (cnt, isnt =
stop) and for a maneuver (cnt, isnt =go). . . 73 3.11 Example calculation ofµs(snt−1, pnt−1, cnt, isnt)following Equation 3.24, for two different
values of the previous speedsnt−1. . . 74 3.12 Example results forentrance(),exit(),angle(),most(),unique(), andside(). . . 75 3.13 Pseudocode for the computation of the probability of a turn signal given the previous
posepnt−1, the previous intended coursecnt−1, and current intended coursecnt. Illustra- tive examples are provided in Figure 3.14. . . 76
signal state beinglef t,none, orrightis displayed below each image. . . 77
4.1 Definition of the collision prediction horizonTprediction. . . 86
4.2 PreScan interface for simulating road traffic scenarios. . . 87
4.3 Dangerousscenarios tested in simulation. . . 88
4.4 Non-dangerousscenarios tested in simulation. . . 89
4.5 Distribution of the collision prediction horizonTprediction. . . 91
4.6 Percentage of detected collisions as a function of the time-to-collision. . . 91
4.7 Comparison of the performance for priority violations scenarios (A1, B1, C1, D) and stop violations scenarios (A2, B2, C2). . . 92
4.8 Comparison of the performance for the different types of maneuver executed by the Other Vehicle: merging right (Scenarios A1, A2), merging left (Scenarios B1, B2), cross- ing (Scenarios C1, C2), and left turn across path (Scenario D). . . 93
4.9 Percentage of avoided collisions depending on the type of violation and on the action taken when a danger is detected. . . 95
4.10 Images displayed by the HMI of the vehicle running the risk estimation algorithm. (a) Image displayed when the system predicts a collision with a vehicle coming from the left. (b) Image displayed when the system predicts no collision. (c) Image displayed when the system predicts a collision with a vehicle coming from the right. . . 97
4.11 Test intersection in Guyancourt: T-shaped give-way intersection. The view is obstructed by the vegetation, therefore the drivers cannot not see each other while approaching the intersection. . . 98
4.12 System architecture in the test vehicles. . . 99
4.13 Antenna placement on the test vehicles. . . 99
4.14 Percentage of received packets as a function of the relative distance. . . 100
4.15Dangeroustest scenarios for the field trials. . . 101
4.16Non-dangeroustest scenarios for the field trials. . . 101
4.17 Range of variation of D (distance to the intersection) and S (speed) for the Priority Vehicle when the Other Vehicle violates the priority in the twodangerousscenarios. . . 102
detects a dangeroussituation, the vehicle causing the danger is displayed in red. The right column shows the view from inside the Priority Vehicle. . . 104 4.19 Sample scenarios recorded during the field trials. When the system detects adangerous
situation, the vehicle causing the danger is displayed in red. . . 105 4.20 The differences between the ‘Interacting vehicles’ motion model and the ‘Independent
vehicles’ motion model are shown in the graphical representation and in the joint dis- tribution. The elements shown in red do not exist in the ‘Independent vehicles’ model. 108 4.21 Estimated intended course (left graph) and risk (right graph) associated to the Other
Vehicle in a sample instance of anon-dangerousscenario (Scenario 5). Screenshots of the situation att1,t2, andt3are displayed above the graphs. . . 109 4.22 Estimated intended course (left graph) and risk (right graph) associated to the Other
Vehicle in a sample instance of adangerousscenario (Scenario 1). Screenshots of the situation att1,t2, andt3are displayed above the graphs. . . 111 4.23 Comparative results between the ‘Independent vehicles’ motion model and the ‘Interact-
ing vehicles’ motion model, fordangerousscenarios (top) andnon-dangerousscenarios (bottom). . . 114 4.24 Test intersections in Stanford: four-way-stop intersections with multiple entrance and
exit lanes in each road. . . 116 4.25 "Junior", the autonomous car used for data collection. The Velodyne laser rangefinder
mounted on the roof top provides a 3D point cloud of the car surroundings. . . 117 4.26 Examples ofconsistentandinconsistentbehavior scenarios. . . 118 4.27 Estimation of the intended course in aconsistentbehavior scenario and in aninconsis-
tentbehavior scenario. The size of the green disks located on the exit lanes is propor- tional to the probability that the driver intends to reach that exit lane. . . 119 4.28 Percentage ofcorrect,incorrect, andundecidablepredictions as a function of the distance
to the exit of the intersection forconsistentbehavior scenarios and forinconsistentbe- havior scenarios. . . 121 A.1 Organizations involved in the development of standards for DSRC. . . 148 A.2 Bandwidth allocated for DSRC applications in Europe and in the U.S. [15, 16]. . . 149
B.2 Example situation where it is necessary to take into account the dependencies between the vehicles to interpret the black car’s behavior. . . 153 B.3 Non-dangerous scenario: impact of the independence assumption on situation assess-
ment and risk estimation. The thicker the arrows, the higher the probability for a maneuver. . . 154 B.4 Sensitivity of the risk assessment: the range of variation ofCollision_riskin dangerous
and non-dangerous situations depends on the value set forλ. . . 156 B.5 Dangerous scenario: impact of the independence assumption on situation assessment
and risk estimation. The thicker the arrows, the higher the probability for a maneuver. 157 C.1 Illustrative example of thenodeandwayconcepts in digital maps. . . 160 C.2 Example digital map, superimposed on the corresponding satellite image. This inter-
section is defined by 6 courses (represented by 6ways). The corresponding XML code is provided in Section C.3. . . 161 D.1 Precision, recall, and smallest collision prediction horizon for different values ofλ. . . 169 E.1 Two different models for the evolution of the pose: (a) Combination of a Constant
Velocity model and a projection model. (b) Path following model taking into account the physical limitations of the vehicle. . . 172
ADAS Advanced Driver Assistance Systems DBN Dynamic Bayesian Network
DSRC Dedicated Short-Range Communication FOT Field Operational Tests
GP Gaussian Process
GPS Global Positioning System HMM Hidden Markov Model IMU Inertial Measurement Unit
ITS Intelligent Transportation Systems KBS Knowledge-Based System
KF Kalman Filter
LCS Longest Common Subsequence MLP Multi-Layer Perceptron
OSM OpenStreetMap OV Other Vehicle PV Priority Vehicle
RNDF Road Network Definition Format
RRT Rapidly-exploring Random Tree SKF Switching Kalman Filter SVM Support Vector Machine TTC Time-To-Conflict TTR Time-To-React TTS Time-To-Stop TTX Time-To-X
V2I Vehicle-to-Infrastructure V2V Vehicle-to-Vehicle V2X Vehicle-to-X
Introduction
Contents
1.1 Context: connected vehicles for road safety . . . 2 1.1.1 Accidents at road intersections . . . 2 1.1.2 Wireless vehicular communications . . . 6 1.2 Problem formulation . . . 17 1.2.1 Scope . . . 18 1.2.2 Challenges and classic approaches . . . 20 1.3 Contributions . . . 22 1.4 Thesis outline . . . 23
Information and communication technologies are an integral part of modern vehicles. There has been a rapid introduction of navigation maps and exteroceptive sensors, with the underlying objective of using driver assistance systems to reduce the number of road accidents. Despite major advances in road safety, accidents at road intersections remain a challenge.
Wireless vehicular communications open new opportunities for safety-related applications and Intelli- gent Transportation Systems (ITS). The sharing of information between vehicles and the infrastructure extends the perception horizon of a vehicle, beyond the field-of-view limitations of on-board sensors.
The research contributions described in this thesis address the problem of situation assessment and risk estimation for road traffic situations, with a focus on safety applications at road intersections and Vehicle-to-Vehicle wireless communications.
The remainder of this chapter is organized as follows. Section 1.1 provides the overall context by describing the issues related to safety at road intersections and the fundamentals of wireless vehicular communications. The problem is formulated in Section 1.2, including a description of the challenges tackled by this thesis and a presentation of the classic approaches. Section 1.3 describes the contribu- tions resulting from this research. Finally, Section 1.4 presents the thesis outline.
1.1 Context: connected vehicles for road safety
This section presents the motivations for using wireless communication between vehicles to improve safety at road intersections. First, accident statistics are used to identify the context in which acci- dents typically occur. Next, wireless vehicular communications are presented and their potential for reducing the number of accidents at road intersections is outlined.
1.1.1 Accidents at road intersections
Accident statistics have been gathered over the years by different governmental and non-governmental organizations. They are fundamental for the design of safety mechanisms and applications. In this thesis, we use this information to determine the typical conditions and causes of road intersection accidents. The sources used are: the World Health Organization [17] for world statistics, the Euro- pean Road Safety Observatory [18], TRACE project [19], and PReVENT-INTERSAFE project [20] for statistics in Europe, and the U.S. Department of Transportation [21, 22, 23] for statistics in the U.S..
1.1.1.1 Background
Road safety is a major societal challenge. The World Health Organization (WHO) estimates that the total number of road accident fatalities is approximately 1.3 million every year, with a further 20 to 50 million injured. Road crashes are the ninth cause of death or disability in the world, and it is predicted that it will move to the fifth place by 2030.
In Europe 2 million people are injured in road accidents every year, and the number of fatalities is about 50,000. The cost is estimated ate180 billion a year, or 2.1% of Europe’s Gross Domestic Product (GDP).
In the U.S. road accidents are the leading cause of death for people between the ages of 4 and 34. The economic impact of road accidents is estimated by the National Highway Traffic Safety Administration (NHTSA) at $230.6 billion a year, or 1.6% of the U.S.’s Gross Domestic Product (GDP).
1.1.1.2 Frequency
Comparatively to their density on the road network, intersections are the location of many accidents.
In Europe in 2004, accidents at intersections represented 43% of all road accidents, 21% of fatalities, and 34% of the seriously injured (see Figure 1.1).
Figure 1.1. Distribution of road accidents at intersections and out of intersections [1].
These numbers vary across the different countries: in the United Kingdom, more than one third of the overall road accident fatalities occur at intersections, whereas in Greece fatalities at intersections are a minority. In the U.S. intersection-related accidents represent more than 20% of road accident fatalities, and more than 50% of the combined fatal and injury crashes occur at intersections. In Japan intersection crashes figures are even more devastating: they represent 58% of all road traffic accidents and 30% of road traffic fatalities.
1.1.1.3 Context
This section presents statistics on the context in which accidents at road intersections occur.
Road geometry: Most accidents occur at X-shaped intersections (39%), followed by T-shaped and Y-shaped intersections (25%), roundabouts (5%), and railroad crossings (1%).
Urban/rural areas: Road intersection accidents occur mainly in rural areas (80%).
Traffic control: There is a high variation in the occurrence of accidents at signalized and unsignal- ized intersections across countries. In the UK 58% of accidents happen at give-way intersections, while this case represents less than 10% of intersection accidents in France. Accidents at intersections controlled by traffic lights vary between 20% in the UK and 60% in France. Accidents at intersec- tions ruled by traffic lights tend to be less severe than the ones at stop or give-way intersections. In the U.S. 74% of intersection accidents occur at intersections with some type of traffic control device in place: 46% at intersections controlled by traffic lights, 16% at two-way-stop intersections, 6% at four-way-stop intersections, and 5% at intersections with some other type of control.
Environmental conditions: Most accidents at road intersections occur in daylight conditions (70%), with good visibility (85%), and on a dry road (75%).
Involved actors: In most cases accidents at road intersections involve two vehicles (75%). The case with one pedestrian and one vehicle represents 10% of accidents.
Driver’s age group: Young (or inexperienced) drivers and the elderly are the most often involved in intersection-related accidents. For persons older than 80, half of fatal crashes occur at intersections.
Driving situation: The vehicle configuration with respect to the intersection layout was studied in detail in the PReVENT-INTERSAFE project [20]. Figure 1.2 summarizes the results. The scenario where the two vehicles involved in the accident crossed path (scenarioa) is more frequent and more severe than any other scenario.
Figure 1.2. Distribution of common accident scenarios in Germany and France [2].
1.1.1.4 Causes
The causes of accidents at road intersections have been investigated in the TRACE project [19]. Driver error was identified as being at the origin of 90% of accidents. From the statistics displayed in Fig- ure 1.3, the major factors are:
• The “internal conditions”: non respect of the regulations, or misinterpretation of the situation.
• The “driver behavior”: typically perception failures. The driver took a quick look, or his attention was focused on something else than the other vehicle, or he did not look.
• The “driver state”: the driver’s capacities were impaired, e.g. by stress, alcohol, tiredness.
Figure 1.3. Distribution of accident causes [1].
1.1.2 Wireless vehicular communications
The concept of sharing information between vehicles goes back to the 1939 World Fair, where the Futurama exhibit by General Motor envisioned that communications would make road traffic safer and more efficient in the future. The sharing of information between vehicles (Vehicle-to-Vehicle com- munications, V2V) or between vehicles and infrastructure (Vehicle-to-Infrastructure communication, V2I) allows a vehicle to perceive its environment beyond the limits of the field-of-view of its on-board sensors. The numerous applications of Vehicle-to-X communication (V2X) for road safety, traffic man- agement, and sustainable transportation explain the growing interest shown by governments and vehicle manufacturers.
In this section, the potential of V2X communications for road safety is addressed. Example V2X-based safety applications are listed, followed by the functional requirements for these applications and a comparison of the different wireless communication technologies which could be used for sharing information between vehicles.
1.1.2.1 The potential of V2X communications for road safety
A study about the trend in the number of road accidents between 1980 and 2000 indicates thatpassive safety measureshave had a significant impact on reducing the number of road traffic fatalities, as shown in Figure 1.4.
Measure Accident reduction
Seat belt use 15-20%
Alcohol countermeasures 15-20%
Specific measures for vulnerable road users 30-40%
Actions targeting the infrastructure 5-10%
Education / training / communication 7-18%
Figure 1.4. Impact of passive safety measures on the reduction of the number of accidents [3].
The introduction ofAdvanced Driver Assistance Systems (ADAS)in vehicles is expected to prevent an even larger number of accidents [24]. These electronic systems are designed to help drivers manage traffic situations safely. Examples of current ADAS are Adaptive Cruise Control, Adaptive Lighting, Night Vision Enhancement, Lane Departure Detection and Warning, Braking and Stability Control Assistance.
The potential ofV2X-based ADASshould be even greater than standalone ADAS, as shown in Fig- ure 1.5. The sharing of information leads to a better representation of the environment and to an extended perception horizon, since the system can “see” beyond the limitations of on-board sensors.
It is estimated that V2X applications may potentially address up to 81% of crash scenarios [25].
The next paragraphs present a list of safety-oriented applications developed using V2X technologies, starting with general safety applications and then applications specifically designed for road intersec- tions.
Figure 1.5. Expected reduction in the number of accidents, and associated technologies [4].
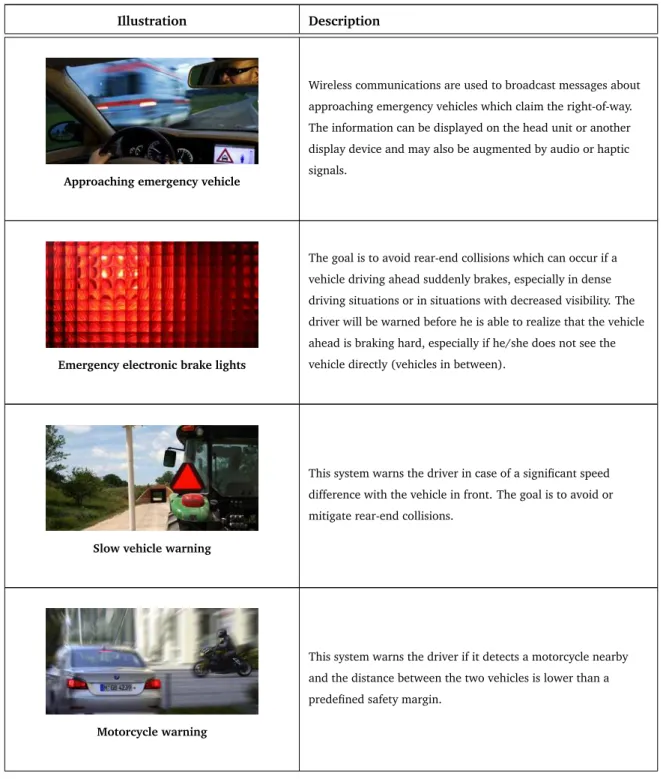
General safety applications: Numerous safety applications using V2X technologies have been demon- strated through different projects in Europe, the U.S., and Japan. The example safety applications presented below are part of the European FOT project DRIVE-C2X and are currently under test [5].
This set of applications focuses on driver warning, and does not consider actions on the vehicle’s commands such as automatic braking:
Illustration Description
Approaching emergency vehicle
Wireless communications are used to broadcast messages about approaching emergency vehicles which claim the right-of-way.
The information can be displayed on the head unit or another display device and may also be augmented by audio or haptic signals.
Emergency electronic brake lights
The goal is to avoid rear-end collisions which can occur if a vehicle driving ahead suddenly brakes, especially in dense driving situations or in situations with decreased visibility. The driver will be warned before he is able to realize that the vehicle ahead is braking hard, especially if he/she does not see the vehicle directly (vehicles in between).
Slow vehicle warning
This system warns the driver in case of a significant speed difference with the vehicle in front. The goal is to avoid or mitigate rear-end collisions.
Motorcycle warning
This system warns the driver if it detects a motorcycle nearby and the distance between the two vehicles is lower than a predefined safety margin.
Road works warning
V2X devices mounted in areas where road works are taking place send messages to approaching vehicles, warning them of a potentially dangerous situation.
In-vehicle signage
V2X devices mounted on traffic signs and in critical areas of the road network send messages to approaching vehicles, warning them of a potentially dangerous situation.
Car breakdown warning
This function enhances the safety of vehicles by detecting an upcoming disabled vehicle or by warning other/following cars that the own car is about to stop. The information is relayed to vehicles driving towards the location where the incident occurred.
Obstacle warning
The presence of an obstacle along a road could be detected by a vehicle’s on-board sensors or entered manually by a driver. This information is broadcasted to vehicles nearby.
Figure 1.6. Set of applications targeted by the DRIVE-C2X project [5].
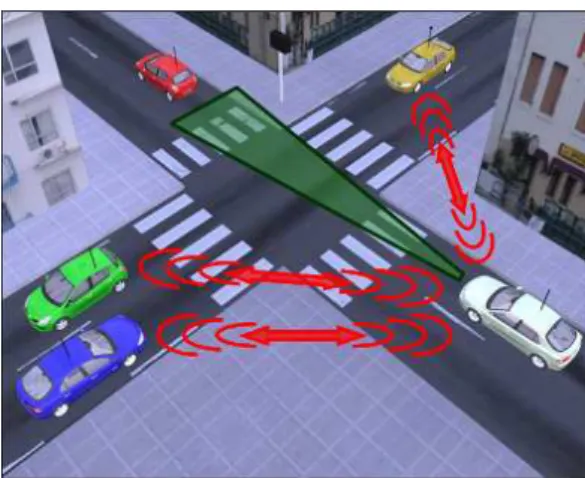
Safety applications at road intersections: A major issue for safety applications at road intersections is the potential occlusion of part of the scene due to the geometry of the intersection, the presence of obstacles like trees, buildings, etc. Some of the vehicles can be detected by on-board exteroceptive sensors like cameras, radars or lasers, but others will be occluded or simply be beyond the field of view of the sensors. V2X communications do not suffer from this limitation, as illustrated in Figure 1.7.
Figure 1.7. V2X communications (in red) overcome the field-of-view limitations of on-board sensors (in green) at road intersections.
In the depicted situation, a forward-looking on-board sensor only discloses the presence of the vehicle in front (red car) while V2V communications detect the cars reaching and leaving the intersection on the sides. This extended perception horizon is crucial at intersections, where danger could come from the sides (cross-traffic) as well as from the front and back. One could argue that the same perception coverage (360°) could be obtained without vehicular communications by equipping vehicles with several cameras, lasers, or radars, however the cost would be prohibitive.
Another unique feature of vehicular communications is that they provide information which could never be sensed by on-board perception systems, such as the driver’s actions on the vehicle controls (e.g. accelerator pedal, turn signals), or the destination entered in the navigation system. Access to such information is very useful to infer the intentions of the drivers, and therefore facilitates situation understanding.
As an example, the use cases adressed by the Cooperative Intersection Collision Avoidance Systems (CICAS) project in the U.S. are presented below [6]:
Illustration Description
Intersection assistant - Left turn across path
This function addresses safety problems due to a driver’s poor judgment of gaps in oncoming traffic. It warns a driver when it is unsafe to make a left turn, taking into account oncoming vehicles as well as the presence of pedestrians or other road users. Gaps are assessed with infrastructure sensors.
Intersection assistant - Crossing path
This function addresses safety problems due to a driver’s poor judgment of lateral gaps in traffic. It enhances the driver’s decision through information and warnings about the available gap. The information is conveyed via a dynamic sign. Gaps are assessed with infrastructure sensors.
Violation detection - Traffic signal
The objective is to assist drivers in avoiding crashes in the intersection by warning the driver of an impending violation of a traffic signal. The V2X-equipped intersection broadcasts the signal phase and timing information. Based on speed and distance to the stop location, the system detects whether or not the driver will violate the traffic signal.
Violation detection - Stop sign
The objective is to assist drivers in avoiding crashes in the intersection by warning the driver of an impending violation of a stop sign. Based on speed and distance to the stop location, the system detects whether or not the driver will violate the stop sign.
Figure 1.8. Set of applications targeted by the CICAS project [6].
1.1.2.2 Functional requirements for V2X communications
The addition of V2X communications to the existing ADAS enables a number of new vehicle safety applications, as shown in the previous section. For these applications to be feasible in practice, the technology used for wireless communication should meet the requirements listed below.
Latency: Time is critical for safety applications, therefore they have strong latency requirements.
While some of the applications described in Figure 1.6 for non-intersection scenarios could bear a few seconds’ delay, the applications described in Figure 1.8 for road intersections are all time-critical and require a transmission delay lower than 100 ms [26].
Minimum frequency: The update rate (i.e. rate at which new information is sent/received) should be at least 10 Hz [26].
Communication range and packet losses: Nodes should be able to communicate when they are less that 300 m apart [26], with a packet error rate smaller than 10%.
Mobile nodes: V2X devices should be capable to operate in a rapidly varying environment. The communication needs to be maintained between moving nodes under difficult and fast changing prop- agation conditions.
Two-way communication: A V2X unit should be able to dialog with another unit or with multiple units.
Information: Precise timestamp and location information are crucial for safety applications, so that each vehicle can create a real-time virtual map of the environment and calculate whether there is a risk.
Privacy: The communication process should guarantee the anonymity of the users.
1.1.2.3 Technologies for V2X communications
The communication protocol used for V2X-based safety applications should meet the requirements stated above, and should also be common between the different brands and different countries. At this point, three technologies are considered:
4G cellular (or LTE) is an evolution of the GSM/UMTS standards for wireless communication using mobile phones. It provides a significantly higher capacity and performance compared to the previous cellular communication standards, with a theoretical peak downlink data rate of 300 Mbps and latency of 5 ms. In practice, the downlink data rate has been observed to be 10-30 Mbps, and the latency around 100 ms [27].
Figure 1.9. Cellular-based wireless vehicular communications.
5.9 GHz DSRC (Dedicated Short Range Communications) is a set of protocols and standards dedi- cated to short and medium-range wireless communications for ITS. A DSRC network consists of Road Side Units (RSUs) and On Board Units (OBUs) sharing information in the 5.9 GHz band. Typically, a RSU is static and located at one specific point of the infrastructure. OBUs are mounted on vehicles are are therefore mobile nodes. The communication between the nodes is done in an ad-hoc manner, i.e. it is peer-to-peer and does not rely on access points (contrary to cellular communications). More details about the 5.9 GHz DSRC standard are provided in Appendix A.
Figure 1.10. DSRC-based wireless vehicular communications.
Two-way satellite allows two distant users to both send and receive data via satellite, through what is named the Very Small Aperture Terminal (VSAT) service.
Figure 1.11. Satellite-based wireless vehicular communications.
The performance of these technologies are compared in Figure 1.12. The latency achieved by satellite communications is well above 100 ms, therefore this technology is only considered for applications which are not time-critical and can bear a delay of several seconds. Even then, the cost can be prohibitive. DSRC was designed to provide high data transfer rates and a low latency in small com- munication zones, therefore it matches all the requirements stated above. DSRC is also relatively inexpensive to deploy (no license fee). While the evolution from 2G to 3G and the deployment of 4G improved the performance of cellular communications in terms of transmission rates and delay, the link setup latency is still lower with DSRC. The major issues with non peer-to-peer communications are the availability of networks in rural areas, the time needed to initiate communication, and the radio interferences which can occur when mobile stations are within reach of more than one base station [27]. Finally, another advantage of DSRC is that it does not share the medium with other unbounded services.The remainder of this section centers on DSRC communications.
4G cellular 5.9 GHz DSRC Two-way satellite
Range Cell tower coverage 100-1000 m Thousands of km
Data rates 75-300 Mbps 3-27 Mbps 1-40 Mbps
Latency <100 ms 200µs >1000 ms
Cost $ None $$$
Figure 1.12. Comparison of the different wireless communication technologies [7].
1.1.2.4 Technical issues and deployment
The DSRC technology is undergoing Field Operational Tests (FOT) in Europe with the DRIVE-C2X project [28], in the U.S. with the Safety Pilot project [29], and in Japan with the ASV-5 project [30].
These large-scale projects aim at testing a variety of applications relying on DSRC and analyzing how the technology scales to a large number of vehicles. The results will help understand the limitations, user acceptance, and safety benefits of V2X applications.
Technical issues: Despite the progress made, several technical issues still need to be addressed before connected vehicles can be deployed. In particular, communication performance is severely im- paired in non line-of-sight conditions due to inherent limitations of the radio channel [31, 32]. This is an issue for applications related to road intersection safety. Further, the ability of DSRC communica- tions to scale in the presence of many vehicles still needs to be validated in real conditions [33, 34].
Other technical issues include data security and privacy [35]. Finally, further standardization work is required to ensure the interoperability between the different platforms.
Deployment: The deployment of DSRC is an economically challenging endeavor, as it faces the clas- sic “chicken and egg” problem [36]. Why should vehicle manufacturers invest in the development and integration of DSRC devices in vehicles when there is no guarantee that there would be any infrastructure-based devices to communicate with? Similarly, why should road infrastructure stake- holders invest in the installation DSRC devices on the infrastructure when there is no guarantee that there would be any in-vehicle devices with which to communicate?
One solution to this problem is to enforce the deployment of DSRC through regulations issued by governments. In the U.S., the results obtained by the ongoing Field Operational Tests shall serve as a base for the government to decide on the future of this technology, including the potential role of the government in its deployment [29]. A summary of the U.S. Department of Transportation’s considerations about the deployment of DSRC is provided on their website [37].
The introduction of DSRC shall be gradual, and the rate of increase of the market penetration will depend on the deployment strategies. It shall take years before the majority of vehicles are equipped with DSRC devices, an issue to consider when deploying DSRC-based applications. This is illustrated by the graph in Figure 1.13. It is forecast that the initial applications (first 5 years) will be service- related, since these do not require a great penetration rate. Traffic management applications should be deployed next (5-8 years), followed by DSRC-based driving assistance functions (after 8 years).
Figure 1.13. Forecast deployment of DSRC [8].
1.2 Problem formulation
In the previous section, statistical data was used to justify our decision to address road intersection safety. Accidents at intersections represent 43% of the total number of road accidents, and contrary to the popular belief most of them occur during normal traffic conditions (i.e. daylight, dry roads) and in rural areas. Statistics show that X-shaped intersections, T-shaped intersections and Y-shaped intersections are the most dangerous, and that driver error is at the origin of the majority of acci- dents. The potential of wireless vehicular communications to reduce the number of accidents at road intersections was presented, along with a list of potential V2X-based safety applications. It was shown that through the sharing of information between vehicles (V2V) and with the infrastructure (V2I), the driver’s situational awareness horizon can be extended. This is a fundamental advantage over on-board sensors when dealing with dangerous situations at road intersections.
It is predicted that V2V will have a larger impact than V2I on road safety: according to Najm et al. [25]
V2V could address 79% of accidents, against 26% for V2I. This thesis only addresses road intersection safety using V2V communications. In this section we formulate the problem within the context of a typical ‘Intelligent vehicle’ architecture, to partition the problem and to define the scope of this thesis.
1.2.1 Scope
Figure 1.14 shows the architectural framework within which our research problem is defined.
Figure 1.14. Intelligent vehicle architecture, based on the JDL model [9]. The hatched area defines the focus of this thesis.
The different components are defined as follows:
Data sources: Sources of information about the ego-vehicle, the surrounding environment, and the context.
• The proprioceptive sensors provide information about the state of the ego-vehicle such as its position, speed, or the state of the turn signal.
• The exteroceptive sensors return information about the environment. For example, a laser scan- ner gives the distance to the closest object in the directions the beams point at.
• V2V communications allow the sharing of information between vehicles.
• Databases contain information about the context. They include digital maps, which are available today as part of vehicle navigation (guidance) systems and store information about the road geometry, topology, signalization, etc. Other databases can store information on typical driver behavior (e.g. typical speed profiles, gap acceptance behaviors). Databases are fundamental for reasoning about situations and risk, as they help establish the relationships between the entities in the scene.
Processing: The information provided by the data sources is processed in order to extract useful characteristics of the current situation and make a decision about the necessity to intervene.
• Object assessment
This process combines the information provided by the data sources to detect the different entities in the scene and to estimate their attributes.
In the context of road safety, it consists in estimating the location and velocity of vehicles and pedestrians in the scene.
• Situation assessment
The goal of this process is to establish the relationships between the different entities, by ana- lyzing the observed events.
In the context of road safety, it consists in inferring the intentions of drivers and pedestrians from their joint motion with respect to the road network.
• Risk assessment
The purpose of this process is to draw inferences about potential dangers.
In the context of road safety, the risk that the current situation will result in a collision has to be assessed.
• Decision making
It is the process of selecting the best actions to address the potential threats detected in the previous process.
In the context of road safety, it consists in taking the appropriate actions to avoid or mitigate accidents when a dangerous situation is detected.
Output: The output of the decision making process can be directed to the drivers through a Human- Machine Interface (HMI), or can take the form of a direct action on the vehicle.
• Human-Machine Interface
Its goal is to enhance the driver’s situational awareness without distracting him from the driving task.
• Vehicle control
Examples of direct actions on the vehicle are autonomous braking, autonomous steering.
Our research and contributions focus on situation assessment and risk assessment. In this work exteroceptive sensors are not considered, therefore the detection of other entities is done through V2V communications only. Off-the-shelf DSRC modems are used, therefore issues concerning the communication protocols are not addressed in this research. Similarly, the choice of a strategy after a dangerous situation is detected (deciding what action should be taken) is not in the scope of this work.
1.2.2 Challenges and classic approaches
1.2.2.1 Challenges
This thesis is concerned with the formulation of algorithms which can assess the situation and estimate the risk at road intersections. The reasoning is based on the use of proprioceptive vehicle data, shared information between vehicles, and map data. Within this context there are two major sources of difficulty:
1. The uncertainties inherent to the input data
Due to inherent limitations of sensors, a degree of uncertainty is associated with the estimation of the ego-vehicle state (e.g. vehicle position). These estimates are shared between vehicles through V2V communication, but at times due to communication latencies or other factors these estimates will not be available. In addition digital maps might store inaccurate information in terms of road geometry or other parameters.
2. The complexity of traffic situations at road intersections
Road intersection situations are highly dynamic and involve complex interactions between vehi- cles. The motion of the vehicles is influenced not only by their physical properties, but also by high-level factors such as driver intention, the layout of the intersection, the presence of other vehicles, the traffic rules. These factors cannot be modeled in an exact manner; this is known as the model incompleteness problem [38]. The incompleteness of the model has to be trans- formed into uncertainty in the reasoning, so that the ambiguities in the interpretation can be addressed.
Therefore, in order to reliably assess situations and risks, it is necessary to take into account the un- certainties in the input data and in the reasoning. However this results in complex models whose
computational needs may not be compatible with the real-time constraints of vehicular safety applica- tions.Therefore, a tradeoff has to be found between the computational complexity of models and their ability to represent complex, uncertain, and highly dynamic situations.
1.2.2.2 Classic approaches
The most standard approach for risk assessment in road traffic scenarios consists in predicting the likely future trajectories of the vehicles in the scene using vehicle motion models, and then checking if these trajectories intersect. Once the uncertainties associated to the input data and the future sequence of events are incorporated, there exists a large number of possible future trajectories. The whole process becomes computationally demanding and makes it difficult to comply with real-time constraints. In the literature, this issue is addressed by either ignoring the uncertainties or assuming independence between vehicles:
1. Ignoring the uncertainties
One solution is to assume that sensors provide perfect data and that the models used to assess the situation and risk are flawless. By excluding uncertainties, the computation of risk becomes simpler. However this results in a large sensitivity with respect to the input data, therefore the output of such models can be unstable and unreliable [39].
2. Assuming independence between vehicles
The other solution is to ignore the mutual influences between the motion of the vehicles. By this means the computational complexity is greatly decreased, since the reasoning about a vehicle’s behavior is performed independently of the behavior of the other vehicles. However the inde- pendence assumption has some drawbacks. They are studied in Appendix B on toy examples, and can be summarized as follows:
• Situation assessment is affected by the independence assumption: some maneuvers become indistinguishable.
• Risk assessment is affected by the independence assumption: the value of risk is overesti- mated, which affects the sensitivity of the risk assessment.
1.3 Contributions
The problem addressed in this thesis is situation and risk assessment at road intersections. The previ- ous section identified that the main difficulties arise from the complexity of traffic situations at road intersections and from the uncertainties inherent to the input data. In order to match the real-time constraints of vehicular safety applications, it is current practice to either ignore the uncertainties or assume independence between the vehicles in the scene. Neither of these solutions are satisfactory, since they have a significant impact on the ability of an algorithm to assess the current situation and its risk.
The approach proposed in this thesis takes into account both the inter-vehicle dependencies and the uncertainties, while keeping the computational complexity compatible with real-time execution. This is achieved through a novel formulation of risk combined with a context-aware motion model for vehicles negotiating an intersection. Our contributions are summarized below:
1. A novel formulation of risk: comparingintentionandexpectation
The classic approach to risk estimation consists in using a motion model to predict the future tra- jectories of the vehicles in the scene and to check whether or not they intersect. However, this process is computationally too expensive to be executed in real-time with “advanced” motion model. Instead, simpler models are used which either ignore uncertainties or assume indepen- dence between the vehicles in the scene.
As an alternative to this classic ‘Trajectory prediction + collision detection’ approach for risk estimation, we propose to detect dangerous situations by comparing what drivers intend to do with what they are expected to do. This is made possible by explicitly representing the traffic rules in the motion model.
A major advantage of this approach compared with the classic approach is that the computation of the future trajectories and their collision points is avoided, therefore the use of “advanced”
motion model is no longer incompatible with real-time risk assessment. The proposed approach can in theory be applied to any type of traffic situations. In this thesis an implementation is proposed for the specific case of road intersections.
2. A context-aware motion model for vehicles at a road intersections which (a) Accounts for the interactions between vehicles.
Instead of making the classic assumption that vehicles’ trajectories are independent, we model their mutual influences by introducing a prior knowledge that drivers tend to respect
traffic rules. The motion model therefore takes into account the priority rules and the presence of other vehicles to better interpret a vehicle’s behavior.
The advantages are twofold. Firstly, we are able to better estimate the maneuver intention of the drivers, which means our situation assessment capabilities are improved. Secondly, risk is estimated with a higher sensitivity. We avoid risk overestimation while still being able to detect dangerous situations as early.
(b) Accounts for the influences of the intersection layout on the behavior of the vehicles.
The geometrical and topological characteristics of the intersection are automatically ex- tracted from the digital map and exploited in our motion model. The constraints exerted by the road network on the behavior of the vehicles are taken into account. We show that this allows us to identify situations where a vehicle’s behavior is inconsistent, which to our knowledge has not be done before.
3. A framework designed for real traffic conditions
The framework for reasoning about situations and risk at road intersections has been designed to be compatible with real-world constraints. It is generic in the sense that theoretically it can be applied to any intersection layout (geometry, topology) and any number of vehicles.
Uncertainties in the input data, which are inherent to real sensors, are taken into account. The algorithm has been tested in real-time on passenger vehicles involved in realistic hazardous situations at a real intersection.
1.4 Thesis outline
The remaining of this thesis is structured as follows:
Chapter 2 - Risk assessment at road intersections: state of the art presents related work on risk estimation at road intersections, with an emphasis on methods based on trajectory prediction. The motion models used for trajectory prediction are categorized into three families: ‘Physical entities’
motion models, ‘Maneuvering entities’ motion models, and ‘Interacting maneuvering entities’. The advantages and drawbacks are described for each category, followed by a review of the different ways to compute a risk value based on the predicted trajectories.
Chapter 3 - Proposed motion model and risk estimation The proposed approach for modeling traffic situations is described in this chapter, as well as the proposed method for risk estimation. Firstly, the approach is described in the context of general traffic situations. Secondly, an implementation is proposed for road intersections. The description of the algorithm follows the four steps of the Bayesian Programming formalism: 1) Definition of the variables, 2) Definition of the joint distribution, 3) Definition of the parametric forms of the conditional probability terms, 4) Definition of the question(s) relevant for risk assessment.
Chapter 4 - Experiments and results This chapter is concerned with the evaluation of the proposed approach. For this purpose, a combination of simulations and field experiments were carried out. In order to evaluate our approach for risk assessment, both a ‘functional performance’ and a ‘safety performance’ evaluation are performed, i.e. both the system’s ability to detect dangerous situations and its ability to avoid accidents are analyzed. Next, the importance of context for situation and risk assessment at road intersections is studied.
Chapter 5 - Conclusions The final chapter summarizes the thesis and the achievements of this work.
Perspectives for future developments are provided.
Risk assessment at road intersections:
state of the art
Contents
2.1 ‘Physical entities’ motion models . . . 28 2.1.1 Evolution models . . . 29 2.1.2 Trajectory prediction . . . 30 2.1.3 Limitations . . . 33 2.2 ‘Maneuvering entities’ motion models . . . 33 2.2.1 Prototype trajectories . . . 34 2.2.2 Maneuver intention estimation and maneuver execution . . . 37 2.2.3 Limitations . . . 40 2.3 ‘Interacting maneuvering entities’ motion models . . . 40 2.3.1 Models based on trajectory prototypes . . . 40 2.3.2 Models based on Dynamic Bayesian Networks . . . 41 2.3.3 Limitations . . . 42 2.4 Collision detection and risk computation . . . 42 2.4.1 Collision detection . . . 42 2.4.2 Risk computation . . . 44 2.5 Other approaches and conclusions . . . 46
2.5.2 Conclusions . . . 47
The literature of collision prediction for ITS has its roots mostly in the robotics domain, which can seem surprising since cars have existed for longer than robots1. The reason is that artificial intel- ligence algorithms are an integral part of robots and therefore have been the focus of many works in the robotics domain, while the “intelligent” part of the driving task was left entirely to the driver until recently. Robotics and ITS share many research problems, as both are concerned with sensor- equipped mobile platforms which should localize themselves, perceive the environment, understand the situation, assess its risk, make decisions, etc. It is therefore natural that methods developed for robotic applications should be adopted by the ITS domain.
The adaptation of these algorithms to the prediction of road traffic accidents is not straightforward, mainly because most of them were designed for unconstrained environments while the road network is a highly constrained environment. It is important to account for this difference, especially in in- tersection areas where the complexity of the layouts and of the traffic rules make the progression of vehicles particularly constrained, interactive, and dynamic.
By far the most popular approach to collision risk estimation in robotics is the ‘Trajectory pre- diction + collision detection’ approach, and it is the prevailing approach among the ITS research community. It is composed of two steps:
1. Predict the potential future trajectories for all the moving entities in the scene. This is done with a motion model.
2. Detect collisions between pairs of trajectories, and derive a risk estimate based on the overall chance of collision.
The first three sections of this chapter focus on Step 1. Motion prediction has been the focus of many works in robotics, and presenting a review of existing approaches from a mathematical point of view would be redundant with previously published surveys. Instead we propose a classification at a conceptual level, based on the different ways to explain a vehicle’s motion. Three families of motion models have been identified and are presented in this chapter:
• ‘Physical entities’ motion models are the simplest models, they represent vehicles as dynamic entities governed by the laws of physics and are described in Section 2.1.
• ‘Maneuvering entities’ motion models are more advanced as they consider that the future motion of a vehicle is influenced by the maneuver that the driver intends to perform. These models are presented in Section 2.2.
1The first modern car is generally considered to be Karl Benz’s Motorwagen from 1885. Shakey, the first mobile robot capable of reasoning and reacting to its environment, was build in 1970 at SRI.
• ‘Interacting maneuvering entities’ motion models take into account the inter-dependencies be- tween vehicles’ maneuvers. Such advanced representations are used only in a few works, which are reviewed in Section 2.3.
The three families of motion models are illustrated in Figure 2.1. In these examples, the‘Physical en- tities’motion model assumes a constant speed and orientation for the cars, the ‘Maneuvering entities’
motion model assumes that the black car goes straight and the blue car turns left, the ‘Interacting maneuvering entities’ motion model assumes that the black car goes straight, that the blue car turns left and that the joint motion of the cars is constrained by the traffic rules.
The fourth section addresses Step 2, i.e. the different approaches for detecting collisions between the predicted trajectories and for evaluating the risk of the situation.
Figure 2.1. Examples of motion prediction with the different types of motion models.
2.1 ‘Physical entities’ motion models
‘Physical entities’ motion models represent vehicles as dynamic entities governed by the laws of physics. Future trajectories are computed using dynamic and kinematic models linking some control
inputs (e.g. steering, acceleration), car properties (e.g. weight), external conditions (e.g. friction coefficient of the road surface) to the evolution of the state of the vehicle (e.g. position, heading, speed).
Extensive work has been done on such ‘Physical entities’ motion models for vehicles, and they remain the most commonly used motion models for trajectory prediction and collision risk estimation in the context of road safety. Models are more or less complex depending on how fine the representation of the dynamics and kinematics of a vehicle is, how uncertainties are handled, whether or not the geometry of the road is taken into account, etc.
This section is divided into three parts. In the first part, the most standard evolution models are described. The second part provides a review of the different methods for predicting trajectories using these evolution models. Finally, the limitations of ‘Physical entities’ motion models are addressed.
2.1.1 Evolution models
2.1.1.1 Dynamic models
Dynamic models describe motion based on Lagrange’s equations, taking into account the different forces that affect the motion of a vehicle, such as the longitudinal and lateral tire forces, or the road banking angle [40].
Car-like vehicles are governed by complex physics (effect of driver actions on the engine, transmis- sion, wheels etc.), therefore their derived dynamic models can get extremely large and involve many internal parameters of the vehicle. Such complex models are relevant for control-oriented applica- tions, but for applications such as trajectory prediction simpler models
![Figure 1.1. Distribution of road accidents at intersections and out of intersections [1].](https://thumb-eu.123doks.com/thumbv2/1bibliocom/469453.73587/26.892.155.809.348.679/figure-1-1-distribution-road-accidents-intersections-intersections.webp)
![Figure 1.2. Distribution of common accident scenarios in Germany and France [2].](https://thumb-eu.123doks.com/thumbv2/1bibliocom/469453.73587/28.892.226.736.219.964/figure-1-distribution-common-accident-scenarios-germany-france.webp)
![Figure 1.5. Expected reduction in the number of accidents, and associated technologies [4].](https://thumb-eu.123doks.com/thumbv2/1bibliocom/469453.73587/31.892.161.666.222.517/figure-1-expected-reduction-number-accidents-associated-technologies.webp)


![Figure 2.5. Clustered trajectories: each cluster corresponds to a typical motion pattern (source: [13]).](https://thumb-eu.123doks.com/thumbv2/1bibliocom/469453.73587/57.892.245.580.721.977/figure-clustered-trajectories-cluster-corresponds-typical-motion-pattern.webp)