L'objectif principal de recherche de cette thèse consiste à développer un modèle d'évaluation du degré de durabilité d'une chaîne d'approvisionnement et à développer un modèle d'identification et de quantification des risques potentiels. Dans le deuxième chapitre, le degré de durabilité de la chaîne d'approvisionnement du client a été évalué.
B ACKGROUND
- Kuehne + Nagel
- Industrial Issues and Research Objectives
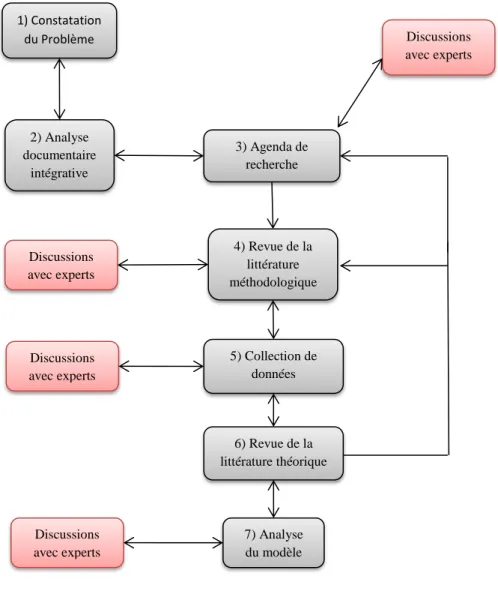
- Research Methodology and Thesis Structure Research fields
- Manuscript Outline
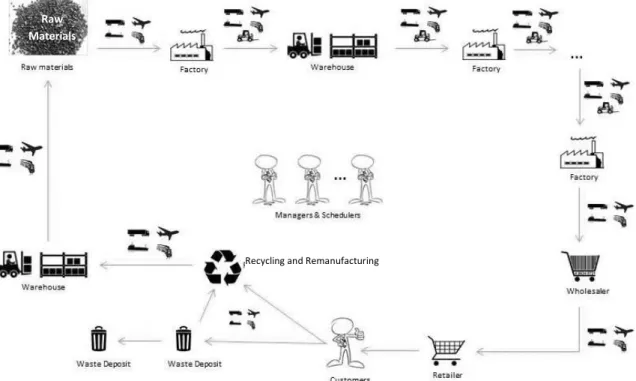
Today, in addition to the economic dimension, two new aspects must be taken into account; ie: ecological and social issues (Lehmacher, 2013). A supply chain (SC) can be defined as "[…] a network of organizations that are linked by upstream and downstream links in various processes and activities that create value in the form of products and services in the hands of the end customer" (Martin Christopher, 1998).
Introduction
T OWARDS THE D EFINITION OF S USTAINABILITY
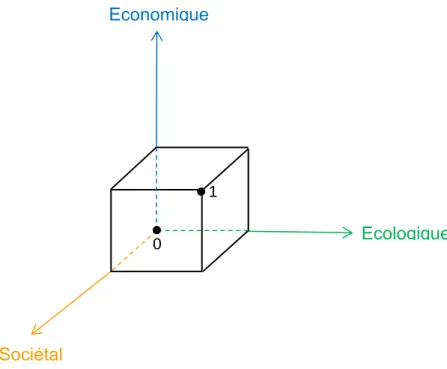
- Elkington’s Triple Bottom Line (TBL) – Illustration of its inherent pillars
- The Economic Pillar
- The Ecologic Pillar
- The Societal Pillar
- Conclusion and Definition
Kurien & Qureshi (2012), Rha, (2010a) and Tseng & Chiu (2013b) recommend using indicators such as 'Green purchasing' or 'Green production and packaging' to improve a company's environmental sustainability. Lean consists of a set of principles, tools and practices aimed at reducing waste – in the broadest sense – to a minimum (Winter et al., 2014b). As becomes clear from the above analysis, the concept of sustainability is – in our view – more complex than proposed by Brundtland (1987) or by Elkington (1997).
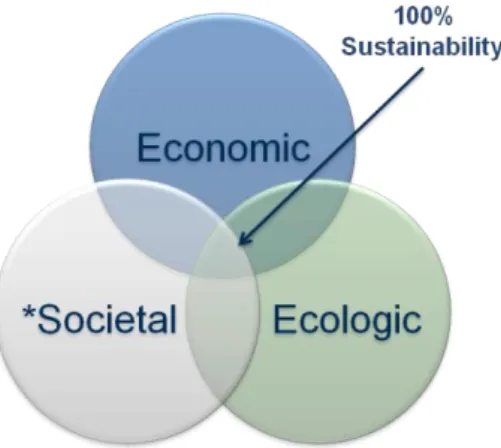
Sustainability is the interaction of the economic, the ecological and the societal pillars - while 'society' is defined as a composition of the working and the ethical environment - in order to satisfy today's and tomorrow's needs, while being aware of the fact that the different needs will deepen over time.
As previously mentioned, many authors have based their definition of sustainability on Brundtland's (1987) definition, which is strongly related to exactly this continuous improvement. At this point, two major research questions emerge: "Why should companies evaluate their SCs?" and "How to evaluate a SC?".
S USTAINABILITY P ERFORMANCE
- Evaluation in a Business Environment
- The importance of KPIs
- Modelling a KPI set
- The General KPI Model
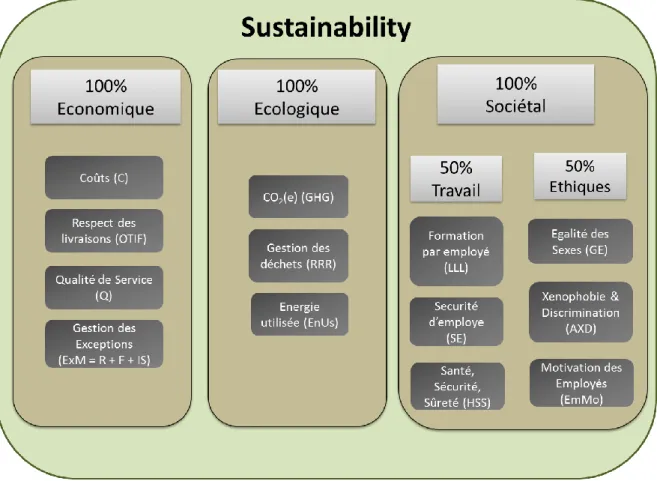
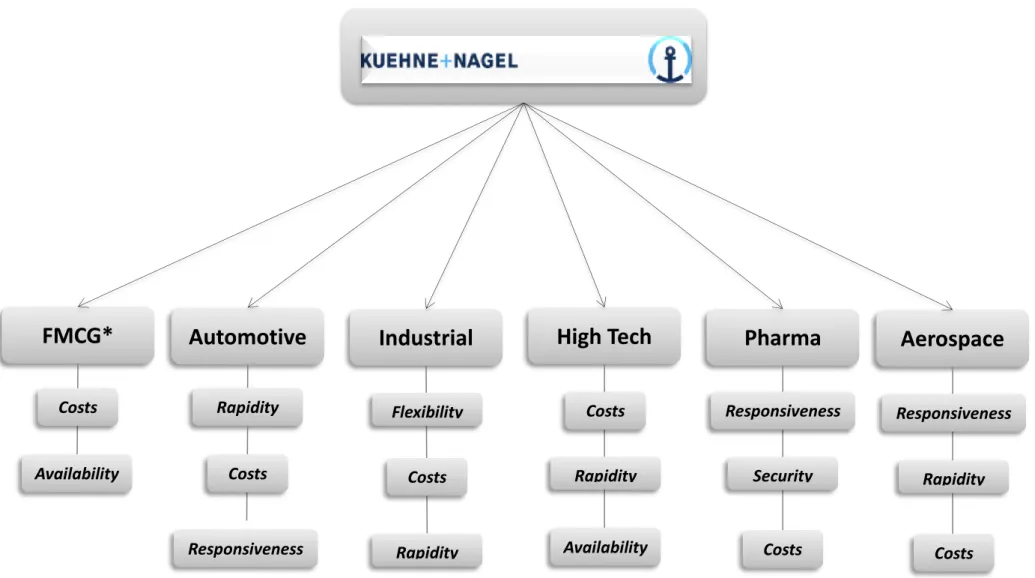
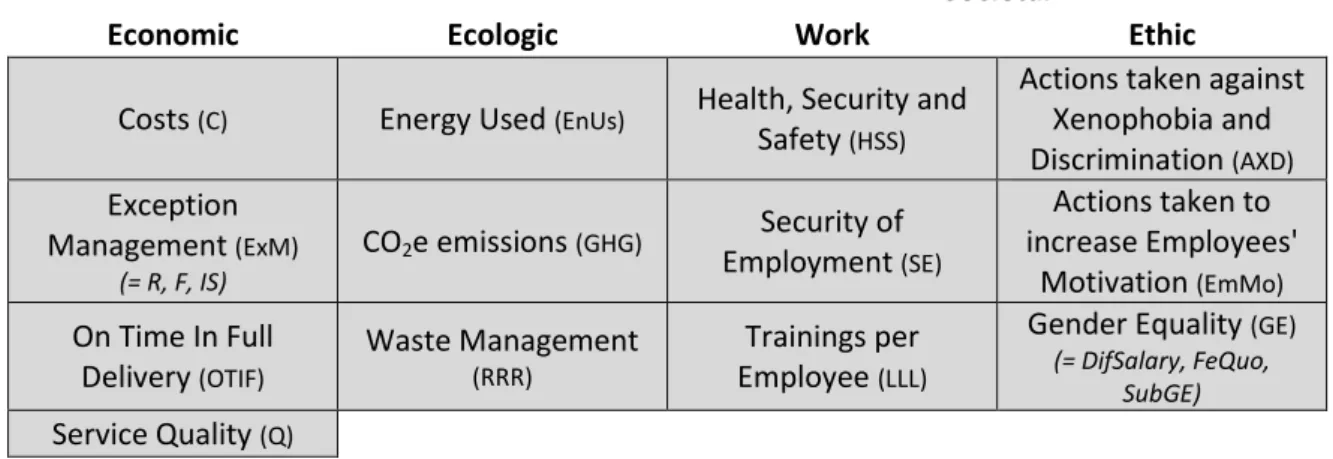
The KPI model, which will be presented later, should be considered as a general model. It is obvious that the identified key performance indicators should be grouped according to the definition of sustainability based on three pillars: 'economic'. Therefore, it is difficult to predict demand, so the supply chain must be flexible.
But the flexibility of SC as well as the speed of material flows should not be ignored either.
- Economic Related Indicators
- Ecologic Related Indicators
- Societal Related Indicators
- Conclusion
Let Dg be the cargo delivered in full and on time within the considered month t. Let DREQ be the requests processed on time, during the considered month t. Depending on the considered domain, a SC should be more or less flexible according to customer needs.
If there are personnel changes within a department, the programs allocated to that department must be reallocated.
C RITERIA D ECISION M AKING (MCDM) M ETHODS
Decision Support Systems – on a Managerial Level Analysis of Variance (ANOVA)
The BSC uses both financial and non-financial data to provide an overview of a company's performance. One of the advantages of the BSC is that it is easy to implement, since in most cases Excel is the only tool required. It is important to understand that the four approaches mentioned above do not show the whole view of the company (Kaplan, 2008).
The SCOR model helps managers to identify and therefore eliminate redundant practices, enabling an improvement of the entire supply chain's configuration (Li et al., 2011).
Decision Support Systems: Managerial Level ANOVA
SCOR
Decision Support Systems – on a Modelling Level Analytical Hierarchy Process (AHP)
The fact that AHP does not take uncertainty or risk into account can be seen as an additional limitation of the AHP methodology (Yusuff & Poh, 2001). One major drawback of fuzzy set theory is that the resulting results, which will always be fuzzy sets, can confuse laymen. Equally important is the fact that it is a fairly understandable and comprehensible model that allows the integration of the preferences of each alternative at each level of computational technique.
We consider that some KPIs are very subjective and therefore need to be calculated in a way that enables the use of the human way of thinking.
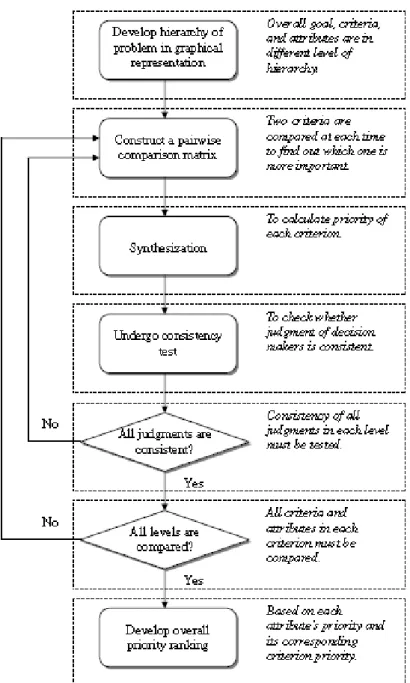
Decision Support Systems: Modelling Level AHP
Fuzzy Logic
MAUT
I MPLEMENTATION AND A PPLICATION : C ASE S TUDY AT
K UEHNE + N AGEL L UXEMBOURG
- Case Study
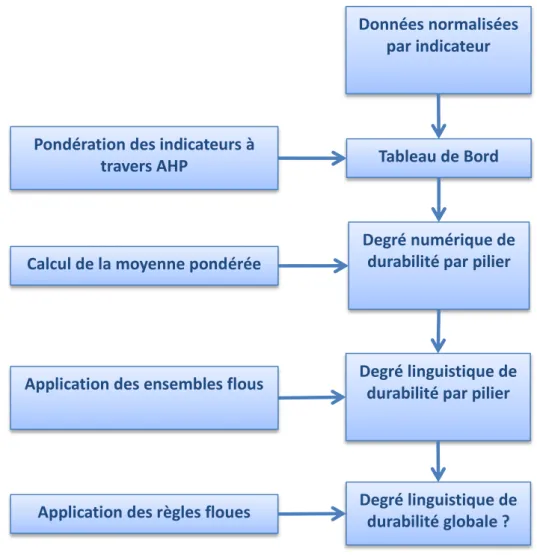
It is not possible to calculate only the average of the KPIs used to get the overall degree of sustainability of the SC. There are few outliers, while most months show durability levels close to the average for the year (shown by the larger dot). The overall degree of sustainability of the SC has been improved by the reinforcement of each of the three pillars.
Seen from another angle, as shown in Figure 44, it is still difficult to determine the highest average degree of sustainability for the time frame considered.
C ONCLUSION
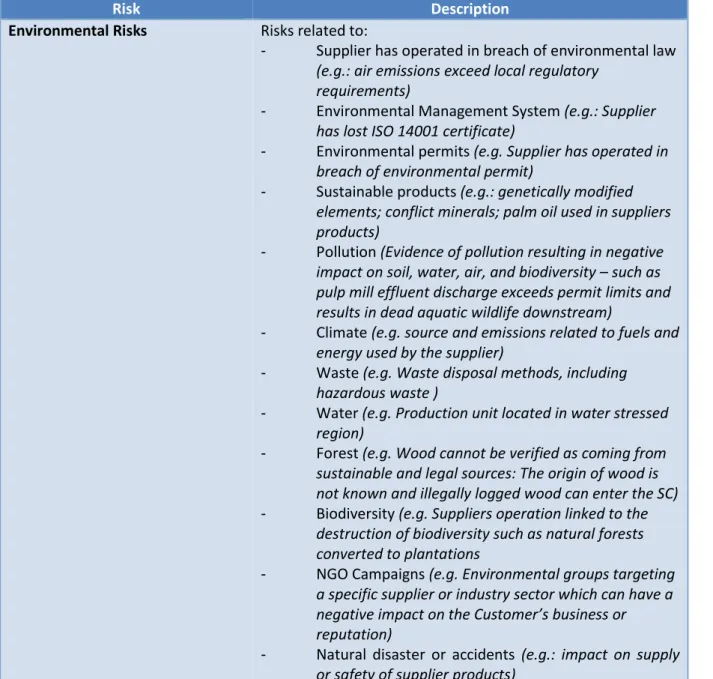
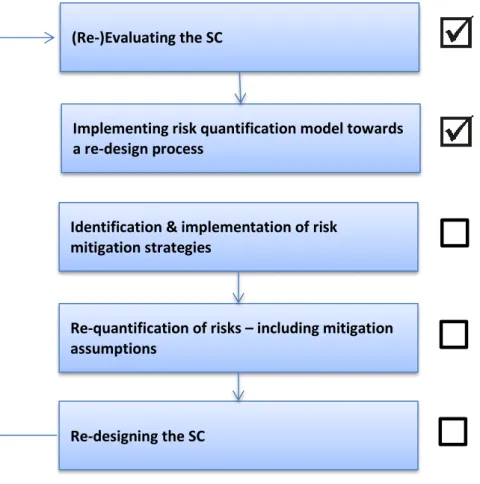
Depending on the level of detail of the risk assessment, there may be a multitude of risks to analyze. Our main interest in this redesign process lies in the risk assessment that constitutes its first step. Moreover, since Kuehne + Nagel did not consider sustainability as defined in this work, it is clear that a risk assessment model considering the risks associated with the overall level of sustainability has not yet been implemented.
In this sense, the added value provided by this chapter lies in the general risk assessment model considering the risks related to our key topic of sustainability.
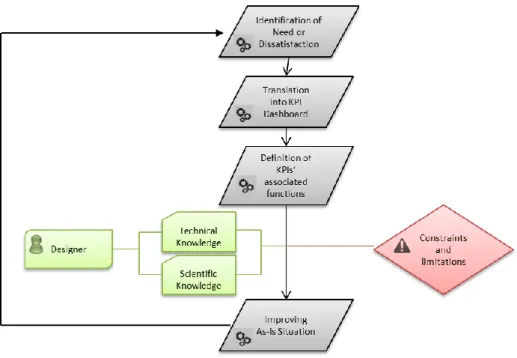
T OWARDS THE D EFINITION OF D ESIGN
- Understanding the Design Concept
- Defining Design
- Design in a Logistics Perspective
- Design Procedures’ Right to Exist in Companies
- Conclusion
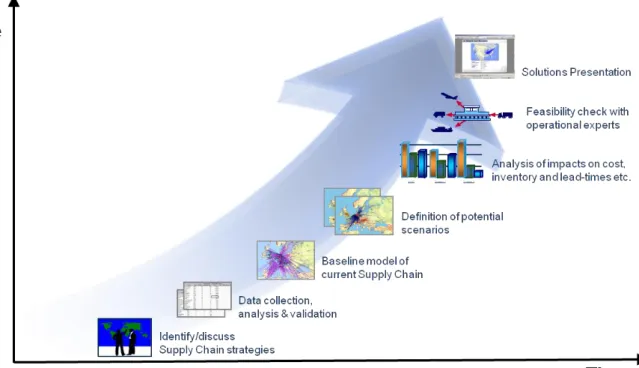
Those decisions concern the size and location of the company, as well as the ideal number of suppliers, distributors and plants to employ. To reformulate, each nodes and flows of the considered SC as well as its various inherent. Geoffrion and Powers (1995) stated that “The corporate status of logistics has changed dramatically during the last two decades.
To improve the overall transparency of the SC, it needs to be evaluated and redesigned if appropriate.
D ESIGN D ECISIONS A LLOWING R ESPONSIVENESS TO
U NCERTAINTIES AND R ISKS
- Risk Management in the Logistics’ Environment
- Managing Supply Chain Risks
- The inherent risks of (Re-) Designing a Supply Chain in Sustainability Matters One risk can be declared being the “general environmental uncertainties”, including
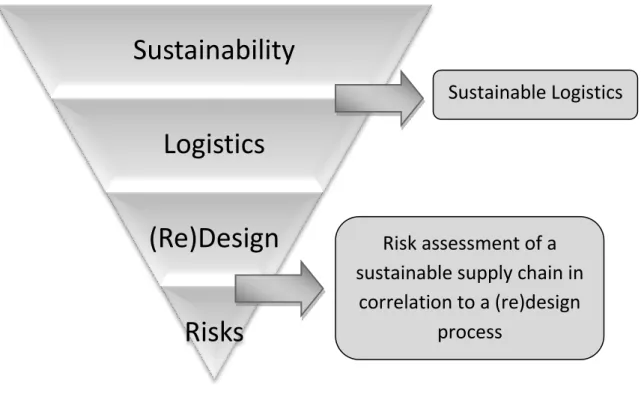
- Risk Assessment with Regard to Sustainability
Understanding both keywords is essential for understanding the following Supply Chain Risk Assessment (SCRA). The aim of risk management is to protect the company against adverse events and their consequences (Borghesi, 1985)”. This was confirmed by Knox & Maklan (2004), who highlighted in their case study that “in most of our respondent companies, risk is managed separately by the finance department and is not fully integrated with CSR.
Managers must be aware of the fact that risks can appear in different forms.

R ISK A SSESSMENT M ETHODOLOGIES
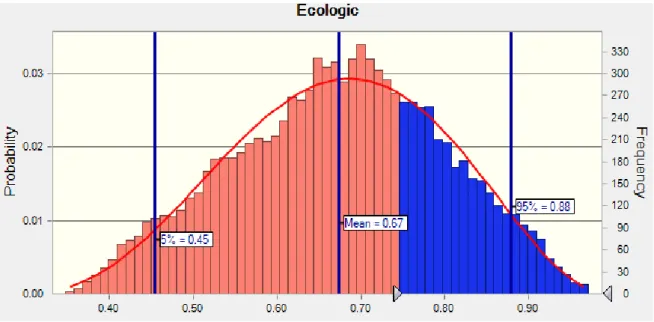
Quantitative Risk Assessment Methodologies
They often oblige managers to quantify the probabilities of a specific undesirable event's occurrence, as well as the magnitude of the associated consequences and outcomes. In addition, due to the fact that every undesirable event must be evaluated in financial terms, most managers probably struggle to specify the economic loss of an undesirable outcome such as loss of reputation or impact on workers' productivity (Butler, 2003). Another advantage of the MCS is that it is easily understood by non-mathematicians (Raychaudhuri, 2008) which enables managers to expand and develop it for companies' objectives.
In addition, it is likely that the optimal solution will remain unnoticed despite in-depth analysis of the considered problem.
Annualised Loss Expectancy
Monte Carlo Simulation
Petri Nets
Qualitative Risk Assessment Methodologies
In addition, equal consideration of respondents' contributions can be guaranteed (Boberg and Morris-Khoo, 1992). In addition, FMEA is seen as one of the most common methods of Quantitative Risk Assessment (QRA) (Samadi, 2012). ISO 31010 suggests the use of deviation parameters and guide words to identify hazards in facilities, equipment and processes (Utne et al., 2014). In general, the HAZOP technique requires that the analyzed system be divided into well-defined subsystems, taking into account how the functional process flows between those subsystems.
Roubelat (2000) defined scenarios as follows: “In theory, scenarios are a synthesis of different paths (events and actors' strategies) leading to possible futures.
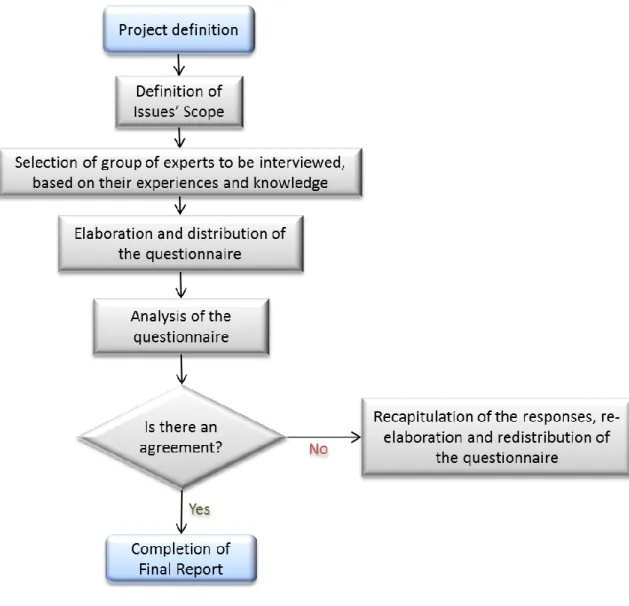
Delphi Survey
Like the HAZOP study, the What – If methodology is based on brainstorming techniques involving experts from different areas of specialization. What - If is the analysis and prediction of various possible scenarios and helps to create a basis for subsequent decisions and judgments regarding the acceptability of a given risk or to determine the next steps as unacceptable. A lot of effort is also required to demonstrate the reliability of the simulation model, which also needs to be regularly updated.
The latter must therefore be compiled by experts who must demonstrate a thorough understanding of the system to be analysed.
Failure Mode and Effect Analysis
It is generally accepted that this methodology, which encourages continuous improvement, enables accurate prediction of the outcome of the event and thus enables the reduction of potential risks. In addition, since actual data can be used to analyze various future scenarios, decisions can be made in a more accurate manner.
HAZOP
What If
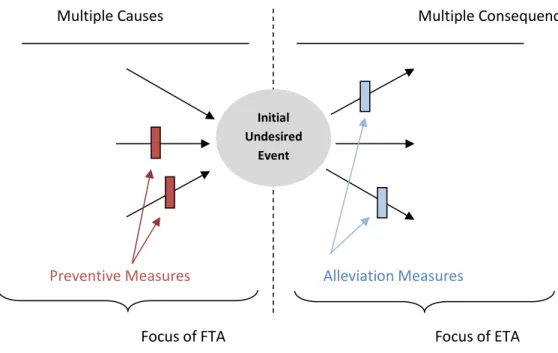
Hybrid Risk Assessment Methodologies Bow Tie Model
Upon completion of the diagram, the team takes on the root cause of the problem, which will be discussed, analyzed and tested. One of the main advantages of the model is that, due to its visual representation, it is easy to understand and apply (Syska, 2006). The BTM can be represented as a logical diagram, which allows for common understanding and promotes clear communication not only at all levels of the company, but also between all the different stakeholders.
The inherent concern of the model is that it can be difficult to represent the interrelated nature of the causes and effects of the problems defined and that the possible causes are usually treated in an equivalent manner.
Bow Tie Model
Another negative aspect is that the model is based on strong assumptions of mutually exclusive and independent events for each branch of the considered tree. As mentioned above, this simplification can also be considered a disadvantage due to the resulting loss of information. Since the undesirable event's sub-causes are shown, the situation can be viewed as an overall picture, informing the different fields of vulnerabilities.
Fishbone Diagram
Conclusion
This, however, strongly depends on the project, company or system to be analyzed. As mentioned earlier, the risk assessment model to be used depends on the risks being considered as well as the data the company has access to. Nevertheless, the BTM should be constructed with at least one risk mitigation methodology so that various barriers can be set.
In fact, we believe that the loss of information due to the simplicity of the model can be a major concern for companies that base their internal strategy on the concepts of continuous improvement.
R ISK A SSESSMENT M ODEL : I MPLEMENTATION AND
The models used to assess these risks must therefore be consistent with our purpose. Bow-Tie Model (BTM) as well as Failure Mode and Effect Analysis (FMEA) seem to be of high value for the risk assessment in this specific case. We consider this model to be of great interest for the risk reduction phase, but unsuitable for the identification and evaluation of the various risks.
The inherent weaknesses of the fishbone diagram, on the contrary, cause discomfort, resulting in the rejection of this methodology for our purpose.
A PPLICATION AT K UEHNE + N AGEL L UXEMBOURG
Background
To do this, we consider the SC of the customer operating in the industrial domain in a B2B environment. The model will also fit the entire supply chain, as the simulation depends solely on the data input, but for time concerns it is not possible to consider the entire SC. The unknown unknowns are data, managers are not aware that they do not know it.
Effectively, managers can have unconscious knowledge and be able to provide answers to questions they were convinced they could not.
Case Study
We therefore consider that the first step in the general model should be seen as the identification of potential risks. In addition, the identification of the causes and consequences of the potential risks must occur at the same time as the first three phases. In other words, the LLL indicator can increase through the improvement of AXD KPI.
In this paper, the main risk to be considered is the risk of a deterioration of the degree of sustainability.