Martin Steven for his strong support over the past four years and for his careful and thoughtful preparations during my defense period. P Cth Threshold for connection probability P DRth Threshold for packet delivery ratio P DRN P Packet delivery ratio in the NP case P DRN C Packet delivery ratio in the NC case rdp Probability of dp phase.
Background
Research motivations and problem statements
It is very important but difficult to maintain the best QoS for forwarding packets in urban scenarios. Moreover, blind route explorations in these routing protocols lead to high delay and redundant overhead.
Research objectives and contributions
Such behavior is beneficial for adaptively choosing the best routing path based on current network conditions. To efficiently use real-time routing information and increase the randomness of our routing protocols, we use QoS for local road segments, which is beneficial for exploring new routing routes.
Thesis outline
In addition, a new routing maintenance scheme is proposed instead of the proactive mechanism used in AQRV to reduce overhead and alleviate network congestion, especially in high traffic load scenarios. In addition, a new packet forwarding algorithm is proposed to select the next relay hop based on the receiver-side relay selection concept, which is beneficial to reduce the network cost.
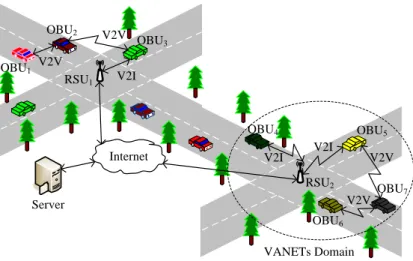
Characteristics and applications of VANETs
Unlike MANETs in which mobile nodes move randomly, vehicles' movements in VANETs are controlled by street topologies, traffic lights and regulations, and a vehicle's future position can be predicted based on road information (such as digital street map and destination location). . Vehicles in VANETs move at high and different speeds, and they also constantly change directions, making network topologies highly dynamic and communication links unstable, which can lead to network partitions.
Technical issues in VANETs
The limited effective diameter leads to problems that existing routing algorithms available in MANETs cannot be used directly in VANETs [39]. Due to complex vehicle movements and highly varying topology changes, designing an efficient routing protocol that can successfully deliver a packet within the lowest delay is considered a critical challenge in VANETs.

Vehicular networking projects
The objectives of this project are as follows: 1) to define an approach to evaluate collaborative systems in terms of communication and data storage privacy, 2) to design privacy-aware architectures for collaborative systems that include appropriate models trust as well as ontology, 3) propose and validate guidelines for privacy-aware collaborative systems, and 4) investigate specific privacy challenges. As a result of ITS-Safety 2010, two cooperative V2I systems have been updated in Japan since 2011:
Routing protocols in VANETs
However, the scalability of the overlay is limited due to the latency of the P2P exchange across the network. However, MURU is sensitive to local optima which would significantly reduce the scalability of the routing protocol.
Packet forwarding algorithms in VANETs
Finally, the neighboring node that can deliver this data packet to its destination in the shortest time becomes the next hop. Therefore, choosing a neighbor that only optimizes forwarding progress does not guarantee a better next-hop selection.
Summary
To address the above challenges, some receiver-based next-hop selection approaches multiple criteria [108,109]. However, these methods do not consider real wireless channel model, adjacent interference and signal propagation models.
Introduction
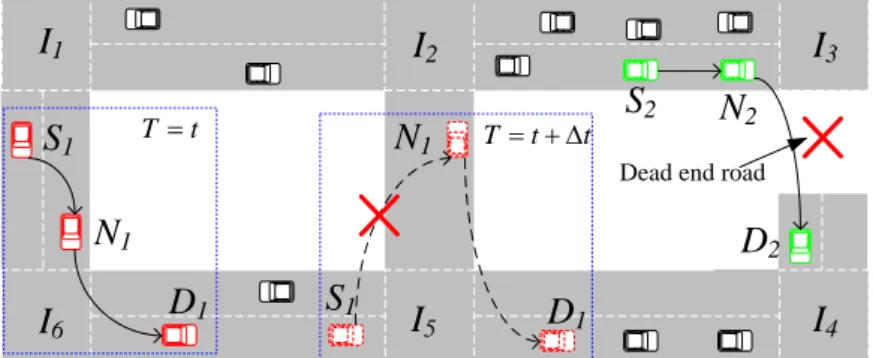
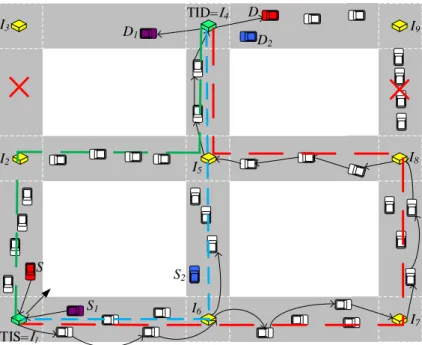
When arriving at an intersection, say I5, BAm updates the global pheromone of the route from I5 to D(I5 →I4 →D) based on the latest estimated local QoS of road segments, and this process is repeated until S is reached (presented in the black arrow line), then a candidate routing path is established (indicated in the green bold line). When all reactive backward ants reach S, the route possessing the highest global pheromone is selected as the best route (for example, shown in the red bold line). When the best routing path is selected, we initiate data packet forward session by dynamically selecting the next intersection based on the maximum updated global pheromone, for example, while arriving at I6, data packets can be forwarded to I7 rather than I5, if the global pheromone of the route from I6 to D passing through I7 is being updated by proactive ants and it is currently higher.
System model and problem statement
P C(y),P DR(y),D(y)andDV(y)represent the connection probability, packet delivery ratio, delay variance and path delay y, respectively. In addition, P C(eSI1), P DR(eSI1), D(eSI1), and DV (eSI1) denote the same corresponding QoS metrics of the road segment from the source vehicle S to the first intersection I1. While P C(eImD), P DR(eImD), D(eImD), and DV (eImD) denote the same corresponding QoS metrics of the road segment from the last intersection Im to the destination vehicle D .
Local QoS estimation of road segment
P C(ek), P DR(ek), D(ek) and DV (ek) respectively represent the same QoS metrics of a road segment ek. Based on the above observations, the connectivity probabilitypc(eij) of the road segment eij between intersection Ii and intersectionIj is shown as. P C(eij),D(eij), DV(eij) and P DR(eij) indicate the average values of connectivity probability, delay, delay variance and packet delivery ratio of the road segment eij, pc(eij) d(eij), dv( respectively eij) and pdr(eij) mean the instantaneous values of the corresponding QoS metrics.
AQRV routing protocol description
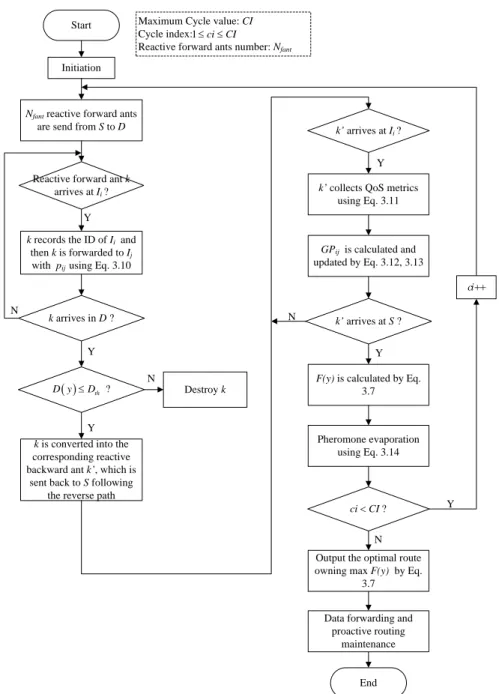
At the beginning of the route exploration process, the source vehicle S randomly sends Nf ant-reactive forward ants to its neighboring intersection using a greedy back-and-forth mechanism to find candidate route paths toward D. Initially, when they arrive at intersection Ii (come from the intersection Ij), the reactive backward ant collects the global QoS metrics based on the estimated route quality of the passing road segments from destination D, and this process can be described as follows. P GPij denotes the previously updated global pheromone of route yij stored in intersection Ii.
Performance analysis and evaluation
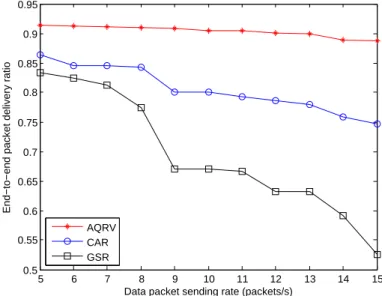
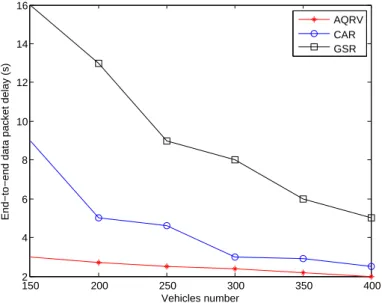
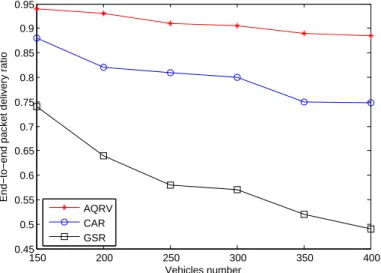
Similarly, in Figure 3.6, the packet delivery ratio of AQRV shows 14.07% and 35.90% increase compared to CAR and GSR, respectively. It can also be observed in Figure 3.5 and Figure 3.6 that the packet delivery ratio decreases with the increase in the number of vehicles and the speed of sending data packets. Finally, in Figure 3.10, we observe that the AQRV overhead level decreases when more data packets are successfully received by increasing the data packet sending rate.
Summary
Note that for a fair comparison, we define overhead as the ratio of total control packet bytes to the cumulative bytes of successfully received data packets. Fig. 3.9 and Fig. 3.10 represents that the overhead of AQRV is higher than both reference routing protocols, since the AQRV protocol relies on periodic packet forwarding to derive real-time QoS estimation of road segments. 3.9, we can observe that the overhead of all routing protocols has a small increase as the number of vehicles increases, which generate more Hello packets to exchange routing information between neighboring nodes.
Introduction
AQRV-1 routing protocol finds the best path between two terminal intersections (TIs) while meeting the same QoS objective as AQRV. After updating the global pheromone with the backward ants, the TIS obtains the best backbone routing path (I1 → I6 → I7 → I8 → I5 → I4) and then sends a positive message to inform S of the established best path. This behavior during a data transmission session shows the characteristic of ACO cooperation and is useful for obtaining the latest routing information and causes other communication pairs (S → D and S1 → D1) to adaptively choose the best routing path to forward data packets.
System model and problem statement
P C(ei), P DR(ei), D(ei) and DV(ei) represent the probability of road segment connectivity, packet delivery ratio, delay and delay variance, respectively.
Mathematical models of local QoS for 1-lane road seg- mentment
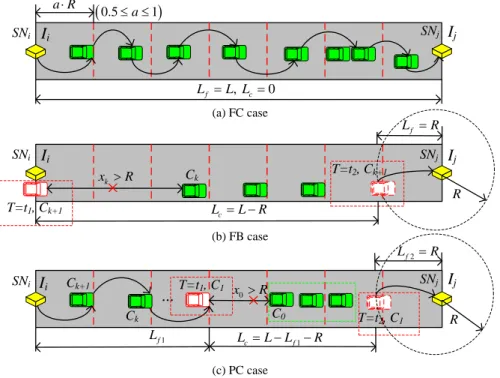
Therefore, the packet delivery ratio on a 1-lane road segment in the case of FC can be given as follows. Based on the above considerations, Lc = L−R, Lf =R and the packet delivery ratio in the case of FB is given as In this case, as shown in Figure 4.3(a), the road segment between Ii and Ij is fully connected, and packets are forwarded hop by hop, so the delay in the FC case is simply given as .
AQRV-1 routing protocol description
LPij depicts the Local Pheromone, which reflects the local QoS of the road segment eij from Ii to Ij. Once all backward ants arrive at TIS, we compare different F(y) (equation 4.1) values of the candidate routes, and the route possessing the maximum F(y) is selected as the best. When the terminal intersection of the source or the destination vehicle changes, a new reactive route path exploration and establishment is initiated between the current TIS and TID based on reactive forward ants and backward ants.
Performance analysis and evaluation
In addition, when the communication range and vehicle spacing density increase, it is possible to repair the network barrier of the road segment, which is beneficial for improving connectivity. In addition, as the length of the road section increases, the packet delivery ratio decreases due to a higher number of communication hops and thus a lower probability of loss. In addition, for example, when the vehicle spacing density increases, the connectivity probability increases, the delay decreases, but the packet delivery ratio deteriorates.
Summary
Introduction
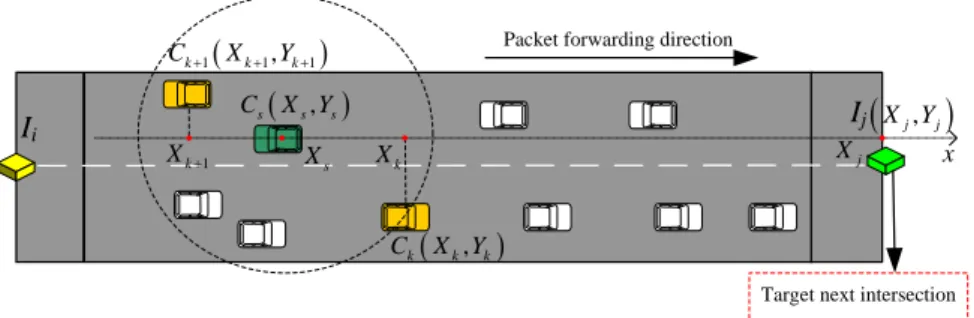
In addition, in AQRV-2 routing protocol, we propose a new packet forwarding algorithm to select next hop using receiver-side relay election approach, in which the selection of the next relay node is not determined by the sender rather than by all neighboring nodes of this sender. Then, the mathematical models of local QoS for 2-lane road segments are presented in Section 5.3. Then, Section 5.4 illustrates the proposed receiver-side relay-based algorithm to select forwarding next hop.
System model and problem statement
P C(y), P DR(y), D(y) and DV (y) stand for the connection probability, packet delivery ratio, delay and delay deviation of the route, respectively. FP C(eij), FP DR(eij) and FD(eij) are used to measure whether the QoS performance of the road segment eij is compatible with the corresponding thresholds. Similarly, FP C(yij), FP DR(yij) and FD(yij) are also used to measure whether the QoS metrics of the routeyij meet the corresponding QoS thresholds.
Mathematical models of local QoS for 2-lane road seg- mentsments
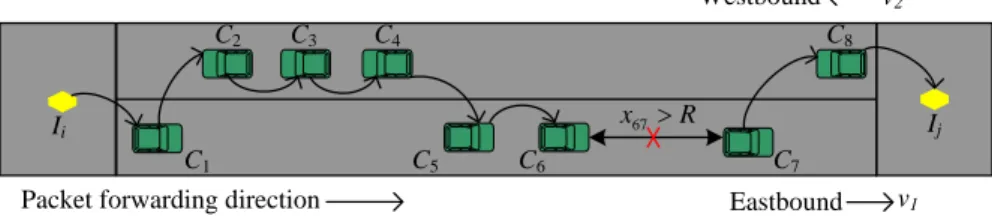
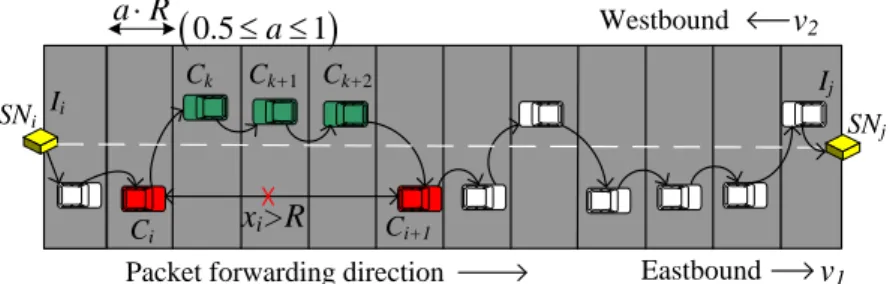
Clearly, in case of at least one broken link on the eastbound lane (m≥1), the link probability of the road segment is expressed as. When there is no broken connection on the eastbound lane, i.e. all cells are occupied by at least one vehicle, the connection probability of the road segment can be given as a) Road segment with network division Packet forwarding direction. Obviously, the packet delivery ratio for the 2-lane road segment in the NC case can be given as follows.
Packet forwarding algorithm
The timeout is used to allow a better next-hop forwarding candidate to respond to the CTS message sooner. The waiting time of each candidate for the next hop is a key factor in determining the best next hop. To achieve these goals, we just choose the forwarding distance and the BER as evaluation parameters to calculate the waiting time.
Performance analysis and evaluation
Moreover, when the length of the road segment increases, the packet delivery ratio decreases due to more communication hops. This figure also indicates that all protocols experience higher packet delivery ratio at lower vehicle spacing density. This figure shows that the packet delivery ratio of AQRV-2 is better than that of AQRV-1.
Summary
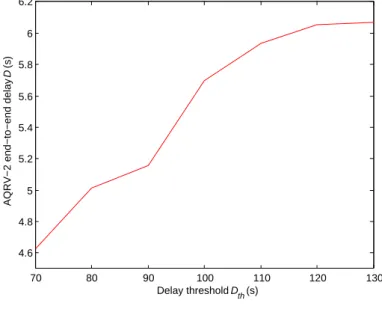
However, since raising ants forward improves the randomness of routing exploration, the convergence rate of the best path is slower and the path establishment time for the communication pair increases. Furthermore, as the number of ants further increases from 50 to 200, the QoS improves slightly, but the overhead and route establishment time deteriorate rapidly. Figures 5.20 and 5.21 show the effects of the delay threshold on the end-to-end delay and packet delivery ratio, respectively, for the selected backbone path of the AQRV-2 routing protocol.
Conclusion
To further improve the efficiency of AQRV and reduce the amount of overhead, we proposed an extended routing protocol called AQRV-1 for urban 1-lane road layout scenarios. Based on the above discussion and analysis of AQRV-1, we propose an improved routing protocol AQRV-2, which establishes the best QoS routing path in 2-lane routing environments. Moreover, we propose three mathematical QoS models that express the same QoS metrics: connection probability, packet delivery ratio, and delay for 2-lane routing scenarios.
Future works and perspective
Furthermore, we analyze the communication performance of AQRV-2 by considering the effects of various design parameters, such as number of forward ants and delay thresholds. The results confirm the effectiveness of AQRV-2 compared to other reference protocols (AQRV-1, GSR and CAR). It is very meaningful to apply the big data technologies to VANETs and then one can gain useful insights from a huge amount of operational data to improve traffic management processes such as planning, engineering and operations.
International conference papers
Published journal papers
Unpublished journal papers
Automata-based opportunistic data aggregation and forwarding scheme for alert generation in vehicular ad hoc networks. IEEE International Conference on Mobile Ad-hoc and Sensor Networks (MSN'09), pages 353–359, Fujian, China, December. A heuristic algorithm based on ant colony optimization for multi-objective routing in vehicular ad hoc networks.