HAL Id: hal-01907526
https://hal.inria.fr/hal-01907526
Submitted on 29 Oct 2018
HAL is a multi-disciplinary open access archive for the deposit and dissemination of sci- entific research documents, whether they are pub- lished or not. The documents may come from teaching and research institutions in France or abroad, or from public or private research centers.
L’archive ouverte pluridisciplinaire HAL, est destinée au dépôt et à la diffusion de documents scientifiques de niveau recherche, publiés ou non, émanant des établissements d’enseignement et de recherche français ou étrangers, des laboratoires publics ou privés.
Wolfgang Büschel, Jian Chen, Raimund Dachselt, Steven M. Drucker, Tim Dwyer, Carsten Görg, Tobias Isenberg, Andreas Kerren, Chris North,
Wolfgang Stuerzlinger
To cite this version:
Wolfgang Büschel, Jian Chen, Raimund Dachselt, Steven M. Drucker, Tim Dwyer, et al.. Interaction for Immersive Analytics. Immersive Analytics, Springer, pp.95 - 138, 2018, �10.1007/978-3-030-01388- 2_4�. �hal-01907526�
4. Interaction for Immersive Analytics
Wolfgang Büschel1, Jian Chen2, Raimund Dachselt1, Steven Drucker3, Tim Dwyer4, Carsten Görg5, Tobias Isenberg6, Andreas Kerren7, Chris North8, and
Wolfgang Stuerzlinger9
1 Technische Universität Dresden, Germany [bueschel,dachselt]@acm.org
2 The Ohio State University, USA chen.8028@osu.edu
3 Microsoft Research, USA sdrucker@microsoft.com
4 Monash University, Australia tim.dwyer@monash.edu
5 University of Colorado, USA carsten.goerg@ucdenver.edu
6 Inria & Université Paris-Saclay, France tobias.isenberg@inria.fr
7 Linnaeus University, Växjö, Sweden kerren@acm.org
8 Virginia Tech, USA north@vt.edu
9 Simon Fraser University, Canada w.s@sfu.ca
Abstract. In this chapter, we briefly review the development of natu- ral user interfaces and discuss their role in providing human-computer interaction that isimmersivein various ways. Then we examine some opportunities for how these technologies might be used to better support data analysis tasks. Specifically, we review and suggest some interaction design guidelines for immersive analytics. We also review some hardware setups for data visualization that are already archetypal. Finally, we look at some emerging system designs that suggest future directions.
Keywords: natural user interfaces, embodied interaction, post-WIMP interfaces, visual analytics, data visualization
4.1. Introduction
Just as being able to interact with your environment is critical to your sense of
‘being in’ the environment, interaction is critical in immersive analytics systems.
Donald Norman introduced the notion that the primary challenges in interactive system design were to reduce the Gulf of Execution (the barriers preventing people from completing actions when working with a computer interface) and also the Gulf of Evaluation(the aspects of the interface that make it difficult
Nathalie Henry Riche, Takayuki Itoh, Wolfgang Stuerzlinger, and Bruce H. Thomas. It can found online at doi: 10.1007/978-3-030-01388-2_4. The text of this version is virtually identical to the published one.
for people to understand the output of the system) [63,118]. It is arguable that the primary focus of visualization systems historically has been on minimizing the Gulf of Evaluation, that is, making visualizations as understandable as possible and that the Gulf of Execution in this domain is less well explored.
However, supporting the fundamental tasks of visual analytics (e. g., exploring the visualization, filtering data, and adjusting parameters) with appropriate, intuitive interaction techniques is necessary for the development of efficient and pleasurable visualization systems.
We would further argue that reducing the Gulf of Execution (for example, through direct manipulation of elements of an information display [63]) and bringing the input and output spaces closer (or even uniting them) strongly contributes to a sense of immersion. Before embarking on an investigation of this premise with any degree of specificity, however, it is worth noting that display and interaction technologies are developing very rapidly, making it difficult to assess the practicability of interaction mechanisms, or indeed to predict what interaction with computers will look like in a few years. Thus, we take a moment to reflect on the history of human-computer interaction, and how the interaction devices and techniques that have been developed have been adopted by visual data analytics systems currently in use.
We can identify three broad and separate generations of interactive computing, characterized by distinct interface styles, each optimized to the available hardware capacity during the same period:
Online computing – beginning in the1960s;
Graphical user interfaces – spearheaded by research in the1960s but achiev- ing popular use in the1980s;
Natural user interfaces – again there is much earlier research, including re- search for3D user interfaces, but this movement has garnered widespread attention since the2000s, with the mainstream adoption of touch computing.
At the dawn of computing, communicating with computers was achieved through very low-bandwidth modalities, such as commands punched on paper tape.
In the early60s, computers “came online” with video, keyboard and (occasionally) light-pen interaction allowing operators to edit programs and documents directly in the systems’ memory [113]. Most fundamental elements of interaction, as they are currently used in visual data analysis software, were demonstrated at this time. Examples include mouse control and the window metaphor (introduced by Engelbart and others in19681) and direct interaction with graphical objects (Sutherland’s seminal SketchPad in1963[143]). The first commercially successful graphical user interfaces – as we know them today – appeared in the early80s.
Since then, their WIMP (Windows/Icons/Menus/Pointer) interaction paradigm has become mainstream. It has proved successful in the workplace and more specifically in visual analytics software. In fact, most current visualization and analytics applications still rely on classical desktop interfaces.
1At “The Mother of All Demos” https://www.youtube.com/watch?v=yJDv-zdhzMY
Meanwhile, innovation on alternative interface technologies has been ongoing.
These post-WIMP interfaces do not use traditional menus, toolbars, and windows, but rely on, e. g., touch input, gestures, speech, or tangible interaction. Specifically, theNatural User Interface(NUI) movement has sought to teach computers to respond to peoples’ gestures on multi-touch screens or in midair following very literal physical metaphors for “natural” interaction (see also Section4.4.). While gesture control has been investigated for a long time, since at least the1980s [29], the NUI movement has in recent years gained momentum with the massive popularity of touch-screen phones and tablets [10]. NUI also becomes more important in computing environments where a mouse or keyboard is impractical, such as extremely portable devices or in Augmented or Virtual Reality [98]. In addition, for the last few years, there have been efforts to open up (information) visualization to new devices making use of natural interaction techniques [100].
It clearly follows that such natural interaction techniques are promising for immersive analytics.
Incorporating NUIs into specific applications, however, is not trivial [117].
In general, the goal we aim for with any user interfaces is to minimize the potentially cumbersome mechanics of input and the cognitive distance between users’ intent and the execution of that intent as provided by the system, i. e., reducing the Gulf of Execution. Despite already receiving strong emphasis in virtual environment research, interaction in immersive analytics brings in new challenges: How interaction augments insight discovery in large, dense, spatial and non-spatial data is still an active area of research (e. g., [47,83,138]). While speculation has begun regarding how this translates to immersive environments (e. g., [128]) there remains a great deal of fundamental research to be done to
better understand the challenges of “immersing people in their data.”
In Section4.2. we look at some of the exciting developments in immersive human-computer interaction technologies, both systems that are already com- mercially available, and ones that are only now emerging in research labs; we list the benefits of immersion that we see for various data analytics applications;
and, we motivate some requirements and challenges to be met to create effective immersive interaction devices and techniques.
In Section4.3. we break down the key tasks that must be supported by any interactive visual analytics system. Then, in Section 4.4., we explore the novel interaction modalities in emerging immersive interaction techniques and discuss their viability in terms of these tasks. Then, in Section 4.5. we look in more detail at how these visual analytics tasks map to immersive interactions and we consider design guidelines for interaction for immersive analytics.
In Section4.6. we describe in more detail some setups for immersive data visualization that have become ‘archetypal’ in the sense of being widely investi- gated, at least in research labs. Then, in Section4.7. we look at new setups and use-cases for immersive analytics that may indicate future directions. Section4.8.
concludes with some research opportunities.
4.2. Opportunities and Requirements
Our vision for immersive analytics is to augment human cognition when working with data using immersive technologies. Since at least the work of Sutherland [144], the assumption has been that the “ultimate display” technology can take advantage of a broader range of senses and capabilities than traditional WIMP interfaces. In the early days of formal information visualization research, pioneers such as Card, Robertson, and Mackinlay painted a long-term vision for an ultimate “Information Visualizer” that was exploiting3D graphics and made use of theinformation workspacemetaphor [30]. While they discussed interaction at a high-level, basically acknowledging that the system needed to be fluid and performant in response to user actions in order to support workflow and user cognition, they gave little indication of what the mechanics (and the devices) for interaction might look like. Arguably, at the time (1991), while3D graphics rendering technology was making rapid progress, there was little appreciation generally of the challenges that lay ahead in creating more natural and effective ways to interact with these immersive spaces.
We have come a long way since the early1990s and there exists a plethora of promising technology for interacting with the surfaces and spaces in our environments rather than interaction with computers via a fixed workstation (see, e. g., [100]). Thus, before exploring specific immersive interaction techniques for data analytics, we look in Subsection4.2.1. at some general motivating examples of the state of the art in immersive interaction techniques. In light of these examples, we consider in Subsection 4.2.2. some of the potential benefits of immersive interaction and then in Subsection4.2.3. some desirable interface qualities for immersive analytics, hopefully being more specific than Cardet al.were able to be in their vision from a quarter of a century ago.
4.2.1. Motivating Examples of Immersive Interaction
A lot of the current excitement around immersion and Virtual Reality (VR) is centered around the new generation of VR headsets, their relatively low cost, and their potential for entertainment in the home. Among the rush of new software for these devices, there are some interesting examples of natural interaction design.
For example,Tilt Brush2 is a VR paint app for the HTC Vive from Google. Tilt Brush features an intuitive “palette” interface. The operator holds the virtual palette in their left hand and uses their right to select different brushes, colors, and other functionality. Different faces of the palette have different suites of tools.
Still in the consumer space, we now have examples of a commodity, functional Augmented Reality (AR) headset systems. The most prominent of them is the Microsoft HoloLens (see Figure 1). The HoloLens represents a significant advance on previous systems in being a fully self-contained (no tether) wearable computing device with sufficient computing power to render stereo3D graphics and to provide accurate optical spatial and gesture tracking through on-board
2https://www.tiltbrush.com/
Fig.1: Microsoft HoloLens is among a new generation of consumer-level Aug- mented Reality devices that feature interaction through gesture and voice recog- nition.Courtesy Microsoft - used by permission.
cameras and image processing. Other systems include Epson’sMoverioand the MetaAR headsets.
Moving to more experimental interface devices, researchers are beginning to create fully dynamic physical display and interaction devices. MIT Media Lab’s InFormsystem [50] is one compelling example, featuring a table mounted array of vertically actuated pins (see Figure2). Potentiometers used for actuation can also detect input forces, and additional optical tracking of users’ gestures is achieved via a Microsoft Kinect sensor. The creators give a number of mixed-reality and embodied interaction use-cases for such a system, including actuation of physical objects and devices placed on the surface, haptic input, and also data display and interaction. Input and output space being so closely intertwined, a sense of directness and engagement is created.
Another glimpse of possible future interaction technologies is offered by Google’s experimentalProject Soli (Figure3). A radar sensor is used to demon- strate the accurate identification of fine, in-air hand and finger gestures not limited by the usual constraints of optical systems. The Soli radar sensor has been miniaturized to a single chip that can easily be incorporated into many different devices. Such devices can potentially increase the vocabulary and the precision of control available for immersive analytics tasks as described below.
Fig.2: MIT Media Lab’s InForm system is a fully dynamic tangible display and interaction device with many applications. Courtesy Daniel Leithinger, Creative Commons License.
Fig.3: Project Soli from Google is developing an experimental hardware device that uses radar to identify precise gestures.Courtesy Ivan Poupyrev - used with permission.
4.2.2. What Are Some Benefits of Immersion?
Talking about interaction for immersive analytics, one should not only ask how interaction can support visual analytics but also howimmersionmay improve interaction. In the following we look into some of these potential benefits.
Immersion → Presence → Engagement. Since at least the time of Slater and Wilbur’s [135] work, the VR literature has made a distinction between immersion andpresence(See Chapter1). Presence is the user’s sense of “being in” the virtual environment. Immersion is used to describe the technological affordances of the system that determine the degree of presence experienced by the user (technological immersion, see also the extended discussion on immersion and engagement in the introduction to this book). It is then assumed that greater immersion (or alternatively, “immersiveness”) leads to a stronger sense of presence in the user, which leads to them being more engaged in the virtual experience [42].
In computer game design (psychological) “immersion” is used more freely as a synonym for “engagement,” for example, as discussed by McMahan [110].
Further, it is understood to apply not only in games that arespatially immersive (by providing the user a first-person 3D view of the world), but in any game that is highly engaging. Games researchers differentiate additional dimensions of immersion independent of the spatial setting. For example, sensory-motoric immersion as identified by Bjork and Holopainen [16] is a function of the degree of ease with which the user can direct or interact with the game such that their motor skills are rewarded by immediate and appropriate feedback.
It is such questions of immersion related specifically to interaction, and ultimately how they affect people’s presence and engagement with data analysis tasks, that are the concern of this chapter.
Embodiment. In his2001treatise [45], Paul Dourish gives a phenomenolog- ical motivation for exploring human-computer interaction paradigms that are embodied. Embodiment may be through physical affordances encoded in the design of the interface or the realization of the computing interface as a part of the built or social environment. While this is largely a philosophical argument rather than psychological, it is a compelling thesis that, since we are creatures evolved to thrive in a physical world, we are most engaged and effective when acting physically. Closely related to this are themes such asproprioception and spatial memory that describe how we perceive and understand our bodies and our environment. We will revisit this in Section4.4. when we look into Reality Based Interaction andPhysical Navigation.
Mobility. Until relatively recently, immersive and natural user interfaces were characterized by large, heavy lab equipment such as tethered AR and VR head- sets, projected large walls (such as CAVE), or tabletops supporting multitouch interaction. The breakout technology for multitouch turned out not to be tables or walls, but small portable devices like smartphones and tablets. Most recently, untethered (in fact, fully self-contained) AR headsets like the HoloLens offer the promise of a new type of portable immersive computing. Long imagined sce- narios for Augmented Reality are finally achievable with commercially available technology. An example is offering mechanics X-ray vision by overlaying a CAD model directly over the machine they are repairing [112], wherever they are, even outdoors or down a mine. In the future, AR headsets might also allow immersive information retrieval for serendipitous, context-aware search interfaces [25] and, in general, the possibility ofin-situdata analytics in all kinds of new situations, as described in Chapter7on situated analytics.
With Augmented Reality and high-quality hand and environment tracking, every surface can become an interactive display. For example, where currently operations centers require workstations with large and expensive screens and interaction is typically done via conventional keyboard and mouse, in future all that may be required is for an operator to wear a headset. They can then surround themselves with arbitrarily large display “walls” and, for example in the case of emergencies, work from anywhere. Thus, the advantage in this example scenario is not primarily immersion but simply cost and convenience.
Collaborative visualization. One of the most exciting aspects of new display and interaction technologies is that they can potentially make it easier for people
to work together. For example, head and body tracking offers remote collabo- rators the possibility of much greater presence in a shared environment. In the context of collaborative data exploration tasks, immersive display and interaction technologies offer users new ways to share and interact with information displays or to have their own private views and work areas. On the other hand, social interactions that follow from collaboration and make use of our social awareness and skills [73] can also increase user engagement and the feeling of presence in comparison to isolated desktop interfaces. However, many challenges remain for researchers in realizing this vision for collaborative data analytics, as described in Chapter8on collaboration.
Hands-free opportunities. Through voice or gaze control [115], for example, medical professionals can explore patient historical data, imagery or other records to better inform on the spot decisions, even during surgery. Similar hands- free interaction can offer machine operators or engineers additional diagnostic information via an HMD.
The ‘ultimate display.’ Sutherland’s original vision imagined a distant future where: “The ultimate display would, of course, be a room within which the computer can control the existence of matter” [143]. While we have made advances in (for example) 3D printing, such technology remains out of reach. However, film-makers and animators (e. g., [19]) are beginning to imagine the potential of VR and AR that is indistinguishable from reality - which is now not such a remote future possibility.
4.2.3. Desirable Interface Qualities
There are many guidelines available for the design of user interfaces, probably the best known of which are those defined by Norman in his book “The Design of Everyday Things” [118]. While these are valuable design principles in general, the challenge is to reconsider them in the light of immersive and natural interaction.
The focus of this section cannot be to state a complete list of requirements but only to suggest interface qualities that system designers may wish to consider.
For instance,affordancesandsignifiers, often misunderstood when talking about (virtual) user interfaces [116], become even more important when the user is interacting with an AR system that combines physical and virtual artifacts, and where the affordances of a real object may not always match the interface’s signifiers. Similarly, in a system using VR headsets, constraints have to be designed with both the visualization itself in mind as well as the physical objects that naturally constrain the user’s movement.
Elmqvistet al. [47] define fluidity in the context of visualization as an “elu- sive and intangible concept characterized by smooth, seamless, and powerful interaction; responsive, interactive and rapidly updated graphics; and careful, conscientious, and comprehensive user experience.” They hypothesize that inter- actions that exhibit these types of characteristics will help users to stay in the flow, which is closely related to achieving a deeper sense of immersion. Thus, Fluid Interaction is particularly interesting in designing interaction for immersive analytics.
Elmqvistet al. present several design guidelines for creating visualization tools that support fluid interactions.
Use smooth animated transitions between states. Used appropriately, an- imated transitions can help the user maintaining a mental model of the system by avoiding abrupt switches between different modes. In the context of im- mersive systems, animations have to be handled with care. Forced viewport transitions, e. g., can easily lead to cybersickness.
Provide immediate visual feedback during interaction. Visual feedback should be provided in real-time for every interaction, including low-level interactions such as pressing a key or moving the mouse. This is especially true for continuous, direct input used in immersive analytics, such as head and body movement, gestures, or tracked3D input devices.
Minimize indirection in the interface. In line with the concept of natural interaction, direct manipulation should be used whenever possible so that interaction operations become part of the visual representation instead of being separated out in control panels.
Integrate user interface components into the visual representation. If direct manipulation is not possible, try to integrate traditional user interface elements seamlessly. In immersive systems this also means to integrate2D UIs in3D environments. This poses challenges as to where to put them and how to cope with perspective distortion, occlusion, and text readability.
Reward interaction. Initially, the novelty of immersive systems may motivate users and thus “reward” them. However, this will quickly wear off with continued use. Interaction embodies a dialog between the user and system.
Visual indications about how and when interactions can be performed can keep the user stimulated over the course of the exploration and act as rewarding effects.
Ensure that interaction never ‘ends.’ Continued exploration should always be possible and the user should never reach a dead end. At least regarding navigation, this is ensured in any immersive analytics systems in which the user freely moves through some virtual information space, e. g., in VR or AR environments.
Reinforce a clear conceptual model. Operations should be reversible to al- low the user to return to a previous state and thus keep a clear idea of a system’s state.
Avoid explicit mode changes. Mode changes may break the user’s flow and should be avoided. If possible, all operations should be integrated and acces- sible in the same mode.
In addition, there are alsotechnical requirementsto immersive systems. These include a decent, real-time responsive tracking of the environment and, if appli- cable, good multi-modal interaction – voice, touch, gesture, eye-gaze, or head tracking. One area in which interaction technologies have seen major improve- ments that directly affect their immersion is in terms oflatency, that is, the delay between the user initiating an action and receiving feedback from the system.
Other challenges include scalable interaction, issue of attention management and awareness, as well as unifying multiple device classes while coordinating interactions across devices.
4.3. Basic Tasks for Analytics
This section describes fundamental tasks for interactive visualizations and refers to existing task taxonomies in the literature. These tasks need to be supported by an immersive analytics user interface, and we will use them to anchor the discussion on designing interactions for immersive analytics in Section4.5..
There exist several taxonomies that capture the individual activities users perform when using visualizations for exploring and understanding any kind of datasets. Most of these taxonomies cover a related set of concepts: Amar and Stasko [2], for instance, describe a set of low-level components gathered by observing students interacting with visualizations, while Heer and Shneider- man [55] break down that interaction into view specification and manipulation.
In this chapter, we use the latter taxonomy as a basis for exploring the design of interactions for immersive analytics (see Section4.5.) due to its focus on inter- active dynamics in visual analytics. We review that taxonomy in the following paragraphs and refer the reader to the literature to learn more about alternative interaction taxonomies that range from more general (e. g., [98,154]) to more specific taxonomies (e. g., with a focus on multivariate network analysis [122]).
Heer and Shneiderman [55] distinguish between three high-level categories: (1) data and view specificationthat essentially corresponds to the data transformation and visual mapping steps in the Information Visualization Reference Model proposed by Cardet al.[30], (2)view manipulation that is reflected by the view transformation step in the Information Visualization Reference Model, and finally (3)process and provenancefor supporting analysis processes.
The categorydata and view specificationcan be further subdivided into the following lower-level tasks.
Encode/Visualize. Here, the analyst chooses a suitable visualization or visual representation for the data records, i. e., this is the actual creation of the visualization.
Filter. A visualization becomes more scalable by filtering out data records based on specific criteria. A popular interaction technique is dynamic queries, for example.
Sort. This task corresponds to the already mentioned basic interactions men- tioned before. Sorting data items is good for many purposes, such as item lists ordered according to measurements (centrality measures, degree-of-interest, etc.).
Derive. The task of deriving information from the primary input data is more related to visual analytics than to pure visualization. For example, the analyst might want to integrate results from automatic computations (aggregations, clusterings, simulations, etc.) into the visual display.
Kerren and Schreiber [85] extended this category by two additional tasks that both address typical interactions needed in visual analytics:
Reconfigure. Changing or reconfiguring the graphical display for specific data records during the analysis process is a standard task performed by analysts.
Adjust. When deriving secondary data from the primary input data, the analyst usually has to modify parameter settings of automated analyses.
The second category discussed by Heer and Shneiderman isview manipulationas summarized below.
Select. Selection is a fundamental interaction concept that is often used prior to a filter operation.
Navigate/Explore. One of the core tasks that reflects very well the explorative character of Information Visualization. Navigation and exploration approaches often follow the information-seeking mantraoverview first, zoom and filter, then details on demand[134] and encompass methods such as focus & context,
zooming & panning, semantic zooming, etc.
Coordinate/Connect. In visual analytics systems, analysts are often enabled to relate views or even individual graphical entities to each other. Brushing and linking can then be used to build a bridge between connected views/items.
Organize. More complex visual analytics tools consist of many different compo- nents, views, or tabs. These components have to be arranged and grouped on the screen in such a way that the resulting arrangement supports the analysis process efficiently.
The last category onprocess and provenancegoes beyond the most traditional information visualization taxonomies as it addresses typical issues that are more related to supporting the analysis process in general, and not tasks specifically related to interactive visualization. We briefly describe the tasks in this category here following that of Ragan et al. [124], but cover them in more detail in Chapter5where we discuss them in the context ofvisual analytics.
Record. Visualization tools should keep a record of the analysts’ operations throughout the analysis process. Then, various interactions should be provided to allow them to step back through this record in order to understand the provenance of individual findings. At the very least such stepping is enabled byundo/redooperations, but more sophisticated analysis of the provenance, e. g., visualization of operations against a timeline, may also be beneficial.
Annotate. Adding labels, highlights or other annotations to visualizations allows analysts to keep track of significant insights in the context in which they were found. This is useful for explaining the results of an analysis to others, but also, again, to support the analyst’s own working memory of the provenance of insights.
Share. Visualization can be a great aid to collaborative analysis, enabling communication about data as well as visual inspection. Thus, tools should support the sharing of various views together with the provenance history and annotations described above in order to make such collaboration as easy
as possible. Collaborative visual analytics in the context of immersive systems is described in great detail in Chapter8.
Guide. A particularly important use-case of shared visualization is guided explanation of insights within a dataset. To support this scenario, tools should enable generation of visualizations that are static yet self-explanatory (i. e., like the kind of infographics found in news-media reports), animated, or stepped interactions for guided presentation. Enabling suchstorytelling scenarios as effectively as possible is becoming a research area in its own right and is discussed in greater detail in Chapter6.
We will instantiate a subset of these tasks for the concrete case of immersive analytics in Section4.5.: select, filter, sort, navigate, reconfigure, and annotate.
The next section introduces basic novel interaction modalities, their opportunities and limitations, and their contribution to engagement and immersion.
4.4. Natural User Interfaces (NUI) and Post WIMP Interaction
Interaction techniques for immersive analytics have to be powerful enough to support users in all the tasks mentioned in the previous section, while at the same time not distracting them from their work or breaking immersion. Techniques based on the WIMP metaphor or most classic3D input devices (see, e. g., [98]) are usually not suitable for interaction in immersive environments. Several of their limitations were listed by van Dam [43]: WIMP interfaces are increasingly complex, can lead to screen clutter, and are inherently indirect, especially for 3D interaction. Maybe even more important for immersive analytics, they are primarily designed for use on desktop computers and do not make use of our rich senses and input capabilities. Novel post-WIMP interfaces are filling this gap. They are typically defined as containing at least one non-classical form of input (e. g., touch, gestures, speech, or tangibles), mostly process parallel input streams, and often support multiple users. They are closely connected to the concept ofNatural User Interfaces(NUI) introduced earlier in Section4.1..
Dachselt & Preim define NUIs as “those interfaces where people interact with by means of intuitive and mostly direct actions grounded in real-world, everyday human behavior. Natural does not mean innate but learned and familiar actions, which appear appropriate to the user in the moment of interaction.” [121, p.472]
(translated by Dachselt & Preim). While there is certainly some overlap between the terms post-WIMP and NUI, post-WIMP is a term defined by the forms of input [43] but NUI is about creating an interface that “makes your user act and feel like a natural.” [152, p.14] It should also be noted that what makes an interface “natural” is debatable, and the term Natural User Interfaceitself has also been criticized, e. g., by Norman [117].
An overview of NUIs as well as guidelines on how to design them are given by Wigdor & Wixon [152] and Fikkert et al. [49]. One framework of post- WIMP interaction that is closely related to NUIs is the concept ofReality Based
Interaction [73], which was proposed by Jacob et al. in 2008. They identify four main themes from the real world that inform and inspire the design of post-WIMP interfaces:
– Naïve Physics, informal, common sense knowledge about the physical world, including aspects such as inertia, gravity, etc.
– Body Awareness & Skills, the user’s ability to control and be aware of their own movement and the position of their limbs (proprioception).
– Environment Awareness & Skills, e. g., the ability to select or grasp objects, and estimate distances or sizes of objects.
– Social Awareness & Skills, knowledge about social protocols and the ability to collaborate with other people.
In the specific context of Information Visualization, post-WIMP interaction was analyzed both by Leeet al.[100] and Jansen & Dragicevic [78]. Leeet al.ex- amined design considerations for “natural” information visualization interactions regarding the individual, the technology being used, social interactions between users, and the relation of technology and the user. Based on those considerations, they also identified opportunities and challenges for NUIs in information visual- ization. Jansen & Dragicevic adapted and extended the well-known information visualization pipeline for visualizations that go beyond the desktop. They also proposed a visual notation for interactive visualization systems that they applied to different case studies of post-WIMP visualization setups.
In the following, we describe different relevant interaction modalities in more detail. While we focus on NUI, it should be noted that there is also a large body of more “classical” 3D interaction research, including the fields of VR and AR. Here, more traditional3D input devices such as ART’s Flystick, VR controllers, or even Wii Remotes are being used. These input devices, especially when bundled and natively supported by commercial VR headsets, provide stable and tested means of input and are often well-suited for immersive3D interaction.
Besides the general overview of3D user interfaces, including 3D input devices, by LaViolaet al.[98], an overview of (non-immersive)3D interaction is given by Jankowski & Hatchet [76]. A recent survey of Augmented Reality, including a chapter on interaction, was written by Billinghurstet al.[15]. In Section4.4.2., we discuss typical limitations of3D interaction.
4.4.1. Interaction Modalities
Let us first introduce and discuss the major non-classical interaction methodolo- gies that are commonly used in immersive visualization. Most of them are inspired by how we typically interact with everyday objects, hence the label “natural interaction techniques” sometimes attributed to them. In our case, however, we are interested mostly in how well they support immersion in the visualization task and how well they maintain (and do not interrupt) the flow.
Touch-based (tactile) interaction.Along with the surge of touch-sensing display technologies and hardware of the past two decades came a plethora of
work on its application to interactive data exploration. Because a two-dimensional touch surface lends itself intuitively to the manipulation of2D representations, a large number of touch interaction paradigms were explored for visualization sub- fields that represent data typically in the two-dimensional plane [100]. However, interaction techniques for inherently three-dimensional datasets have also been explored [67,84], either for monoscopically (e. g., [52,105,155–157]) or stereo- scopically displayed data (e. g., [38,72,103]). The benefits of haptic feedback are typically cited as a benefit supporting the use of touch interaction as opposed to traditional PC-based environments. In particular, somesthetic feedback [129]
gives people the feeling that they actually are manipulating items and, thus, increases the immersion into the interaction with the data. A survey of touch interaction techniques, even if just for the application of data visualization, would be beyond the scope of this text, so we refer to the recent survey by Isenberg &
Isenberg [66].
Sketching and pen Interaction.Pen interaction with computers actually predates mouse interaction. Widely regarded as a precursor to hyperlinking (and eventually, therefore, the web), Vannevar Bush’s1945concept for an elec- tromechanical document exploration machine (theMemex) featured a stylus for annotations [27]. Sutherland’s Sketchpad system [143] was an early demonstration of interactive computer support for technical drawing built around a light-pen system. However, the practicality and ergonomics of holding a tethered pen up to a vertical screen for extended periods of time meant that pen computing took a long time to find favor. Chenet al. studied the use of a hand-held tablet as a remote control for viewpoint control and search tasks in an immersive CAVE environment [36]. They found that the tablet’s mobility helps reduce context switching cost due to the form factor of the tablet input. In more recent years, the development of tabletop and smart board computing, smaller tablet devices, and the gradual advancement in machine recognition of hand-writing and drawings has led to renewed interest in pen-based interaction (e. g., [51,59]).
Much more recently, information visualization researchers have begun exam- ining how people communicate about data and complex systems by sketching on whiteboards. In a study of whiteboard sketches found throughout a large organization, Walnyet al.found many instances of whiteboards being used to manually create quite sophisticated information visualizations, such as charts and diagrams [150]. Clearly, whiteboards are ubiquitous in workplaces and classrooms, but besides being cheap and convenient there are a number of other aspects that make them ideal in supporting people as they communicate complex ideas, for example, people seem very comfortable organizing their thoughts spatially on a whiteboard in a very freeform way. The observation that people routinely think and communicate about data visually by sketching has led to automated systems for integrating computer-generated charts into people’s hand-drawn sketches.
Tangible interaction and data physicalization. As an alternative to touch interaction, tangible user interfaces, first introduced in the1990s [70,133], have also been explored for the control of data exploration. Early examples focused, in particular, on tangible controls for traditional interfaces (e. g., [58,71])
and on geographical visualization (e. g., [69,119]). For the exploration of spatial data, in particular data defined in3D space, several approaches demonstrated that tangible interaction can be useful by maintaining the spatial mapping between the exploration tool and a physical representation of the data (e. g., [13,53,94,95]). Some recent work has even demonstrated the use of shape(- changing) displays (e. g., [102]). Beyond spatial data, however, a number of authors has also demonstrated the usefulness of tangible interaction with abstract data representations (e. g., [37,77,93,137]). A closely related form of interaction is the exploration of physical visualizations [79]. In fact, it can be argued that there is a continuum from completely virtual/digital, via tangible interaction, to physical interaction [77].
The advantages of tangible interaction over, in particular, touch interaction lie in the physical nature of the manipulated tokes, facilitating a richer expression of interaction intents than touch interfaces. On the other hand, most tangible interfaces are highly specific, inferior to the flexibility offered by fully digital touch interfaces. The previously mentioned shape displays [50,102] as well as recent micro-robotic technology (e. g., [99]), however, promise to make tangible or physical data displays more flexible.
Gestural interaction.Gestures are a form of non-verbal communication, often accompanying or sometimes even replacing speech. We use them, for example, to point at objects, to illustrate concepts, or to support cadence. Many taxonomies for gestures exist, such as by McNeill [111] or Karam & schraefel [82].
With gestures being part of our daily lives, gestural interaction systems can feel natural and intuitive. As such, gestures have been proposed for HCI at least since the1980s [17]. An advantage of such interfaces is that they allow manipulation from a distance without physical contact or the use of any hand-held input device.
Hence, they lend themselves for settings such as large display installations [109], public displays [151], or medical applications demanding sterility [80].
An early example in the field of data visualization is theInformation Cube by Rekimoto & Green [126], a cuboid visualization of hierarchical data. Users wearing datagloves can rotate the visualization to inspect it from all sides and select nodes using hand gestures. Kirmizibayrak et al. [87] used gestures to control a visualization of medical volume data. Their studies show that gestures can outperform mouse interaction in rotation tasks. Chen et al. designed a set of numerical input techniques to model architectural modeling process [34], ranged from virtual sliders [35] to virtual keypad and gestural input [33]. Hybrid interfaces that combine2D multi-touch and3D gestural interaction have been examined by Benkoet al. [12]. New and affordable depth-sensing cameras such as the Kinector the Leap Motion allow gestural interaction to be included in consumer products and, at the same time, also provide researchers with the means to develop low-cost prototypes for this interaction modality. Despite this, several challenges remain. Gestural interaction is often perceived as unergonomic and can easily lead to fatigue (casually called the gorilla-arm effect [57], see also Subsection4.4.2.). Similar to touch gestures, free-hand gestures also lack discoverability and usually have to be learned and trained for effective use. Finally,
one has to acknowledge that gesture recognition accuracy affects user performance and is also negatively affected by the strategies that users adopt to deal with recognition errors [5].
While we often associate it with hand gestures, the term “gesture” can be applied to many other forms of input. For example, foot gestures [106], touch gestures (see above), and even gestures made with physical props, pens, 3D controllers, or other devices (part of tangible interaction, see above) can be found. However, the use of the term “gestural interaction”—in particular in the context of data visualization—has also been criticized [68]: both the task specification and the parameter manipulation during exploration can and are specified using gestural interaction, but both have different constraints. In particular, for immersive interaction, the specification of the task should happen in an instance in order to not interrupt a user’s thought processes, and the transition from task specification to parameter control needs to be fluid. An example for this are theMultiLenses by Kisteret al.[89]. There, graph lenses are instantiated with a gesture and the main parameter can be immediately manipulated by continuing this gesture in a fluid way.
Gaze interaction. Eye-tracking systems are often used for psychological studies or to evaluate user interfaces; an overview of eye tracking specifically for theevaluation of visual analyticsis given in [97]. However, already in the1980s, the firstgaze interaction interfaces were presented. One such system is Bolt’s Gaze-Orchestrated Dynamic Windows [18]. In this system, several video streams were presented on a single large display. By looking at a particular video, the user could start or stop the playback.
The main advantage of gaze interaction is that it does not rely on the user’s hands. As such, gaze interaction is regularly used in systems for the physically disabled (e. g., [64]). However, as Bolt’s system shows, gaze can also be used as a natural interaction technique to indicate a person’s attention or simply keep their hands free for other tasks.
Early eye trackers were cumbersome and required the user to be stationary.
However, advances in mobile eye tracking hardware now make it possible to, e. g., integrate them into commercial VR headsets3, enabling their use in immersive analytics applications. Measuring (and reacting to) the user’s attention is a key aspect ofAttentive User Interfaces[148], an interface strategy that tries to address information overload. Also, visualizing a user’s awareness can be helpful in collaborative systems. For example, coarse eye tracking is used by Dostal et al.[44] to measure awareness in a collaborative visualization system using large, wall-sized displays.
When gaze interaction is used directly as an input method, it is often combined with other modalities. While it is possible to design interfaces that solely or mainly use gaze (e. g., Adamset al.[1] presented techniques to explore large2D information spaces using gaze), both precision and efficiency can be hampered by gaze interaction. Rapid, small eye movements (saccades) limit the precision of the eye gaze. The duality of using eyes as an input channel versus their normal task as
3See, e. g., https://www.tobiipro.com/product-listing/vr-integration/
the most important human sense is another limitation of gaze interaction, leading to problems such as the so-calledMidas Touch: Do users of a gaze interaction interface look at an object or UI element to trigger an action after a certain dwell-time or just to visually inspect it? Additional modalities, e. g., touch, are used to circumvent these limitations. We call such interfacesgaze-supported[139].
Stellmach et al. [140] presented a system for the gaze-supported exploration of large image databases. Employing a large remote display, gaze was used to control a fisheye lens and fine target selection was done using a multitouch device. A combination of gaze and foot input was used by Klamkaet al.[91] to explore zoomable information spaces, in this case Google Earth. Still, gaze-based pointing methods, including gaze-supported input with the (space) button for confirmation, can currently not match the performance achievable with a mouse for pointing tasks [107] on smaller screens.
An overview of eye tracking technology and applications including many more examples of gaze interfaces can be found in Majaranta & Bulling’s survey [108].
Cernea and Kerren provide a survey article on technologies for emotion-enhanced interaction that also discusses basics of eye tracking technologies [32].
Physical navigation and locomotion. A key advantage of immersive analytics is the ability to display a large amount of information, potentially across multiple levels of scale. This provides the opportunity to navigate this information efficiently through physical or virtual means. Information foraging theory [120] models the cost of information access, and suggests office and computational metaphors in which frequently accessed information is kept nearby and can be accessed through quick operations, at the expense of less frequently used information stored at greater “distances”. The concept of “information scent”
models the visual hints that guide the user in finding and accessing targeted data in an information space.
Physical navigation exploits human embodiment to navigate the information space directly via body movement, such as head rotation to naturally control the view frustum. In contrast, virtual navigation uses some form of indirect interactive control to manipulate the viewpoint, such as a joystick. Beyond this binary categorization, a spectrum of fidelity of interaction ranges from high-fidelity that mimic real-world interactions to low-fidelity that do not attempt to mimic real-world behavior [98]. Jakobsen et al. [74] explored interaction techniques based on the spatial relationship of a user and large visualizations, including the adaptation of the visualization based on the user’s position.
In immersive analytics, physical navigation spans two primary levels of scale.
Micro-level physical navigation consists primarily of efficient rotational move- ments of the eyes, head, and body, to rotate the view frustum in the space, and can also include limited translational movements, such as leaning. These forms of physical navigation are very efficient and have been shown to be advantageous over virtual navigation, in terms of both access time as well as improving cog- nitive understanding of spatial relationships in the data [9]. This is typically implemented using head-mounted displays combined with head tracking, or large high-resolution fixed displays with or without head tracking.
Macro-level physical navigation deals with translational movement for locomo- tion in the space. Physical navigation for locomotion, such as walking, is typically limited due to the range of the tracked interaction space or the physical size of the display device. Exceptions include Augmented Reality methods based on GPS or computer vision in which users navigate the real world. Hence, longer range locomotion in immersive environments often requires some form of simulated physical navigation, such as walking in place or treadmills, or virtual navigation methods such as teleportation or joystick control [98].
4.4.2. Challenges and Fundamental Limitations of3D Interaction In many cases, immersive analytics applications may involve 3D data sets or 3D input and output technology. While the idea of interacting directly in 3D is attractive, many currently available solutions are often not practical and/or inefficient. In this subsection, we list a couple of common issues around 3D interaction that affect interaction performance in non-trivial ways.
One commonly held thought posits that human or technology limits could be easily addressed through navigation or better interaction methods. Yet, this is rarely true in a general sense. For example, interaction-at-a-distance, i. e., ray-based pointing (e. g., [81]), is fundamentally limited by the fact that pointing accuracy is negatively affected by limitations of orientation tracking or human limits on hand stability. Then, any inaccuracies in orientation result in errors that increase with distance. While techniques such as snapping the ray to the nearest target [4] can compensate for this in some instances, such solutions do not scale to dense object arrangements or work for large distances. Moreover, the cost for undoing incorrect selections through snapping is also often ignored.
Disambiguation interfaces that temporarily magnify content to facilitate selection achieve this through an increase in interaction cost. Another way to compensate for pointing inaccuracies is to navigate to a position where the problem becomes simpler, e. g., by moving closer to the desired objects. This is true, but this solution adds the cost of navigation to the interaction, which again increases time. The user may then also have to spend additional time to navigate back to the original position. For interfaces that mix interaction and navigation modes, there is also the insidious issue that the need to switch between interaction and navigation increases the potential for mode errors.
Spatial abilities, especially for3D, are learned skills, which include spatial perception (important for3D navigation), mental rotation (important for3D rotation), spatial visualization (important for planning3D operations), and spatial working memory (important for3D creation). Such abilities correlate well with STEM (Science, Technology, Engineering, and Mathematics) performance [149], which is only high in a limited subset of the general population. As the spatial abilities of the general population are below the levels observed in the STEM subpopulation, this fundamentally affects the potential generalizability of any interface that requires good spatial interaction skills.
Another fundamental issue is that one cannot interact with occluded content with any degree of precision, as the feedback loop that is central to human
actions (and HCI) is disrupted. This is commonly visible in the real world, where only highly-trained users can manipulate things they cannot see directly with precision. Again, one can compensate for this through interaction or navigation techniques, but only at additional cost.
The human visual system can only focus on a single plane at any given time.
In practice this means that one can either focus on the finger/hand or on a display, but not both simultaneously (unless they are close in depth), e. g., [23].
This fundamentally limits interaction accuracy that is achievable away from a display surface, including common stereo display and Augmented Reality systems.
A related issue is the vergence-accommodation conflict, e. g., [60], which is the inability of commonly used stereo display systems, including head-mounted displays for Virtual Reality, to allow correct eye-vergence and focal distance for the perceived objects. This conflict affects depth perception, which in turn impacts interaction performance negatively. An easily observable symptom is that users start to “search” for the correct depth of a target in stereo display systems or that the distributions of hit points for3D target shows an elongated profile in the depth dimension [24], which affects pointing performance [22]. Finally, any form of human stereo vision deficiency also affects interaction performance with systems that rely on accurate depth perception through stereo. Some researchers estimate that more than30% of the population may have some form of stereo deficiency [56]. Moreover, as people age, average stereo acuity decreases, too [160]. This puts some limits on stereo-based systems being a general form of user interface mechanism.
Throughput is a good measure to characterize interaction performance, as it takes both speed and accuracy in pointing tasks in to account. Thus, throughput enables comparisons across different user strategies, such as slow and accurate vs.
fast and sloppy. In terms of throughput, a mouse or touchscreen is significantly better than any currently available3D interaction device (see, e. g., [20,21,23,146]).
While interaction speed in 3D is usually not much affected, interaction accuracy is typically much worse. The list of reasons for this include the lack of human hand stability in mid-air interaction,3D tracking limitations, depth perception limitations, or any combination thereof. Thus, it is a particular challenge to achieve interaction that feels natural yet is accurate enough.
Interaction in3D typically involves more than two degrees of freedom (DOF).
One good option to address this issue is to reduce the number of degrees of freedom through the use of constraints [132,141,142]
Another issue affecting interaction with3D is the “gorilla-arm” syndrome, i. e., the fact that holding one’s hands in the air for extended periods of time leads to fatigue and all its associated side-effects [57,75].
Finally, interaction through a single cursor, pen-tip or even multiple touch point(s) on a touch screen is much less rich compared to the interaction capabilities posed by human hands. One illustrative example is achieving the task of tying one’s shoe-laces with any computer-based system.
4.5. Designing Interactions for Immersive Analytics
After describing the typical tasks associated with visual analytics in Section4.3.
and discussing different interaction modalities and their limitations in Section4.4., we can now combine them and map techniques to tasks. Guidelines such as presented in Section4.2.3., e. g., Elmqvist’s fluid interaction concepts [47], can be used to inform the design of these interactions. This section outlines a first attempt at matching tasks to interaction techniques. Where appropriate, we explain how fluid interaction can be supported by these mappings. It should be noted that the following should only be seen as initial proposals, showing the opportunities of rich, fluid interaction for immersive analytics.
Selection: Selection is the basis for determining on what elements many subse- quent analytic tasks operate. These tasks can include selection of data for more information, reconfiguring of elements, or sorting along a dimension.
In immersive environments, techniques such as mouse interaction are not appropriate. Gestural interaction (e. g., pointing to and circling an element) can be used, though mid-air gesturing can be fatiguing. Great care should be taken to minimize strain on the user, e. g., by designing comfortable gestures [57] or providing alternative forms of input. For example, voice along with Natural Language Processing (NLP) can be used to indicate attributes and ranges of interest (e. g., ‘Select all elements with negative profit’) but is itself less suitable for selecting or deselecting individual elements. Eye-gaze, on the other hand, is well suited to indicate the user’s point of regard and can be used to choose an object of interest, thoughMidas Touchusually means that other modalities would need to be engaged to choose the appropriate interaction (e. g., a button press on a VR controller or a voice command).
Multi-selection techniques such as lasso selection can in principle be used with each modality that provides a form of pointer, e. g., touch, pen, mid-air pointing, or to some extent gaze. These techniques can provideimmediate, continuous feedback[104]. It may not be enough to just separate out selections from the subsequent activity since some interactions may involve combining the act of selecting with that subsequent activity to design more fluid inter- actions [46]. Some work has also been done in combining multiple devices (touch displays, tablets) with immersive displays for more fine-tuned control.
Filter: If items to be filtered are already known, filtering is simply the triggering of an operation and can be accomplished through a semantic gesture (e. g., a wave of the hand), or voice. Filtering often is either used to filter out selected objects, or filter out all non-selected objects. The act of specifying the query may be combined with the interaction itself (e. g., from voice, we might filter out all values less than the average or focus only on outliers). On the other hand, in some cases, filtering needs to be dynamic. For example, a user would like to remove outliers to remove visual clutter in a complex dataset but does not yet have a clear understanding of what constitutes outliers in the specific data. In such use cases,continuouschanges of the filter threshold andsmooth transitions between filtered and unfiltered views may be required to keep
theflow of interaction. Many natural interaction techniques, like hand or body movements, support continuous input with, however, varying degrees of precision.
Sort: Typically, a sort action is specified by an attribute upon which the data is to be sorted. This attribute may already be selected (see above), or selected during the sort. Some work involved a gesture on a surface or in mid-air, by starting the gesture on a particular axis [46]. Voice can be used as well. Sorting typically involves specifying whether the order is ascending or descending by value, or in some other order (e. g., alphabetical). Usingsmooth transitions to the new order can help users to track both individual items and the general arrangement. While these animations can also easily be triggered after discrete input events (such as a voice command or a button press), continuous input techniques allow for immediate, continuous feedback and may help users to abort erroneous sorting operations.
Navigation: There is a wide history of research on navigating through virtual environments (e. g., [98]) and many of these techniques apply here. Physical navigation, i. e., the user literally moving to change the view on the data, has been examined, e. g., for wall-sized display setups [9,90]. Walking closer to data in a space can allow precise inspection of details while walking back allows for an overview. Additionally, Rädleet al.[123] studied the effect of physical navigation in zoomable user interfaces on large display walls and found not only benefits for navigation performance but also evidence of improved spatial memory. Limited space can be problematic for physical navigation in large datasets. Especially in VR, techniques such as teleporting the user to a new position can help to increase the apparent size of the interaction volume. These techniques, however, are potentially immersion breaking and can negatively affect the user’smental model. Gestural interactions can be used such as to shrink or zoom the overall world, or rotate it to a more appropriate view. Maps can be used in conjunction with a visualization to assist in navigating a large visualization.
Proxiesthat represent the data and make it more tangible can be used if orienting the data is of particular use. For example, Beaudouin-Lafonet al.[11]
used a prop of a human brain to rotate MRI data on a large display wall, similar to those used by Hinckleyet al. [58]. Similarly, hand-held devices that serve as peepholes into the virtual scene (e. g., [26,137]) can be moved around to navigate the visualization.
Reconfiguration: Reconfiguration often includes assigning attributes to visual variables, e. g., to the axes of a visualization. While voice interaction can in principle be used for this task, this requires the correct recognition of spo- ken, previously unknown data attribute names. A good example of gestural reconfiguration is the ImAxes [39] project. In this HMD-based VR system, users can rearrange data axes with the VR controllers to compose different visualizations, e. g., scatterplots or parallel coordinates. This demonstrates how a close coupling between the user interface and the visual representa- tion can be beneficial: Instead ofexplicitly switching between modes, users
candirectly manipulatethe type of visualization and getimmediate system feedback.
Labeling and annotating: Annotating data, assigning labels or highlighting parts of a visualization are important actions supporting the discussion and analysis of the data. Text input can be supported by voice recognition.
Alternatively and depending on the setup, touch keyboards on personal mobile devices or displayed on a shared interactive display can be used as well. Pen input has also been proposed to annotate visualizations directly, e. g., using tangible lenses with Anoto technology [137]. An overview and a taxonomy of annotations in (outdoor) Augmented Reality has been presented by Witheret al. [153].
Given the mappings above, we can identify some fundamental interaction types that can be combined to create higher order interactions. We need to support selection of data and visualization elements. Similarly, we need to support discrete choices from lists. Whenever these items are graphically represented in the system, some form ofpointing can be used to indicate/choose them, with options such as3D input devices, touch, gaze, or mid-air pointing. Confirmation can then either use the same modality or a different form of interaction in multi-modal interfaces, e. g., gaze selection with voice confirmation. On the other hand, discrete items (including mode switches) can also be selected by moresymbolic, discrete input methods such as voice commands, symbolic mid-air gestures, etc. Examples such as multi-selection or camera manipulation show the need for continuous interaction. Clearly, voice commands do not lend themselves for this type of interaction. Instead, touch, tracked 3D input devices, some forms of gestures, and physical navigation are good examples for continuous control.
4.6. Archetypal Setups
Systems for immersive analytics can take many and varied forms, including, for example, differences in the number, size, and types of displays used as well as input devices. In this section, some typical setups (i. e., combinations of output and input technology) that showcase this variety are described along with example research applications and upcoming trends. It is worth noting that many of these systems have, to date, seen more active use in Scientific Visualization applications than in the visualization of abstract data, i. e., Information Visualization.
4.6.1. Large Screen Collaborative Space
Large screens, especially wall-sized vertical displays and to lesser degree tabletops, provide the space needed to show complex datasets in their entirety. Their size also gives room for several people to interact with them at once. Therefore, setups of one or more large displays have been used extensively for collaborative visual analytics tasks.
This archetype has several challenges both regarding interaction and per- ception. One issue is that metaphors for interaction close to the display, e. g.,
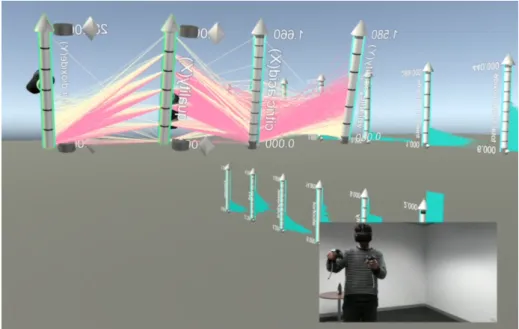
Fig.4: Distribution of a visual analytics system across different display geometries [92].
using touch, often cannot be applied directly to interaction from afar using, e. g., gestures. Another interaction challenge of such systems is to differentiate between the input of individual users. Different methods for touch user identification have been proposed, such as optical tracking in front of display walls [159], capacitive fingerprinting [54], or active IR beacons [130]. Awareness, both in regard to the display content and the collaborators’ actions, is more of a perceptional challenge:
While standing close to the display, other users and parts of the display can be blocked or simply outside the user’s field of view. Stepping back to get an overview, on the other hand, prevents users from direct interaction with the display and may limit inspection of small details in the data as well.
In the last decade, the costs of display panels have fallen sharply. In2007, LCD panels larger than 40" were not available commercially. Plasma panels larger than50" cost in excess of USD5,000and weighed as much as a person (e. g., [131]). In2017, full HD50" LCD panels can be bought for only a few hundred dollars and weigh only a few kilograms. Ultra High Definition (UHD) panels with3,840×2,160resolution are only a little more expensive. Further, multiple software solutions now exist to providecluster rendering, the capability to split the responsibility of rendering a continuous2D desktop or3D environment across a number of networked machines, each driving its own set of display panels.4 Thus, the cost and difficulty of creating tiled display walls with arrays of such panels have fallen dramatically and with this increased convenience, researchers
4 Popular cluster rendering software includes OmegaLib [48], Unity [147], and Sage2 [127].
have begun to investigate the opportunities for visual analytics using such display walls.
In an experimental study evaluating tiled vertical displays of various sizes for visual analytics tasks, Ball and North [8] found that small targets could be acquired and compared significantly more quickly on larger walls. A later, more qualitative study by Andrewset al.[3], found that analysts change their approach to managing documents and information when moving from a standard desktop display to a larger, tiled display. Basically, they use a more spatial approach to document organization, structuring the display space to externalize their analysis process.
In addition to the physical area, the other important property of display walls (compared to, for example, large projected displays) is their resolution.
Ni et al.’s work is among the first to empirically demonstrate the benefits of high-resolution display for information search with text in spatial data [114]. With clustered rendering, resolution is theoretically unlimited. In practice, the cluster architecture has to provide a scalable way to distribute the data to the nodes and, from each node, to render only the part of the view needed for that node.
Using this method researchers have been able to investigate new ideas to take advantage of massive resolution spread across a large wall. For example, Isenberg et al.[65] create static visualizations that allow inspection of very fine-grained detail when standing close to the wall, but on stepping further back, gross details (labels for larger regions and so forth that were blurred and therefore “hidden in
plain sight” when standing close) become apparent (see Figure5).
These results suggest that high-resolution, large-area display walls can change the interaction paradigm for data analytics, especially with respect to the task of navigation as described in Section4.3.. That is, to some degree, the user(s) of large display walls are able to navigate by changing their physical position with respect to the data displayed, rather than changing the viewpoint through an interaction device. Arguably, the most “natural” user interface is no interface at all.
4.6.2. Personal Displays + Large Screen Collaborative Space
Setups consisting of one or more large displays can be combined with individual, personal displays. Typically, these personal displays come in the form of handheld smartphones or tablets. For example, several scenarios (and infrastructure to support those scenarios) are explored by Klapperstucket al.[92] for multi-site collaboration, using a shared large area display wall together with handheld and tabletop devices for interaction. However, arguably any additional display (e. g., AR glasses or smartwatches) used by one person in addition to the main display(s) fits this category. An example is the system presented by Butscher et al.[28], which combines a large multitouch table with several HMDs for the collaborative analysis of multidimensional data.
This combination can help to address some of the challenges of large display immersive analytics systems: The use of personal devices and their own interaction capabilities provides an additional, independent view for the user and also allows


![Fig. 4: Distribution of a visual analytics system across different display geometries [92].](https://thumb-eu.123doks.com/thumbv2/1bibliocom/470582.74316/24.892.201.720.172.464/fig-distribution-visual-analytics-different-display-geometries-92.webp)
![Fig. 5: Use of Hybrid-Image techniques to create combined overview and detail views in static large-wall visualization [65]](https://thumb-eu.123doks.com/thumbv2/1bibliocom/470582.74316/26.892.202.722.173.398/hybrid-image-techniques-create-combined-overview-static-visualization.webp)
![Fig. 6: Tracked tablet used as a peephole into a 3D information space that is located on a table [26].](https://thumb-eu.123doks.com/thumbv2/1bibliocom/470582.74316/27.892.205.722.171.521/fig-tracked-tablet-peephole-information-space-located-table.webp)