HAL Id: hal-01382027
https://hal.univ-reunion.fr/hal-01382027
Submitted on 4 Nov 2016
HAL
is a multi-disciplinary open access archive for the deposit and dissemination of sci- entific research documents, whether they are pub- lished or not. The documents may come from teaching and research institutions in France or abroad, or from public or private research centers.
L’archive ouverte pluridisciplinaire
HAL, estdestinée au dépôt et à la diffusion de documents scientifiques de niveau recherche, publiés ou non, émanant des établissements d’enseignement et de recherche français ou étrangers, des laboratoires publics ou privés.
Interaction between structural inheritance and extension direction during graben and depocentre formation: An
experimental approach
Laurent Michon, Dimitrios Sokoutis
To cite this version:
Laurent Michon, Dimitrios Sokoutis. Interaction between structural inheritance and extension direc-
tion during graben and depocentre formation: An experimental approach. Tectonophysics, Elsevier,
2005, 409, pp.125-146. �10.1016/j.tecto.2005.08.020�. �hal-01382027�
Interaction between structural inheritance and extension direction during graben and depocentre formation: An experimental approach
Laurent Michon
a,*, Dimitrios Sokoutis
baLSTUR, UMR 7154, Universite´ de la Re´union, IPGP, BP7151, 97715 Saint Denis cedex 9, France
bNetherlands Centre for Integrated Solid Earth Science, Vrije Universiteit Amsterdam, De Boelelaan 1085, 1081 HV Amsterdam, the Netherlands
Abstract
Analysis of structural rift architecture shows that the graben formation is commonly controlled by the contemporaneous activity of two fault trends with an angular obliquity of approximately 408. Inspection of the crustal basement and geophysical data reveals that these faults are parallel to inherited oblique crustal and lithospheric discrete fabrics, which are reactivated during the extension event. We conducted experiments at crustal scale to determine the role of the coeval reactivationof suchoblique inheritedfabrics inthe grabenand depocentre development.Experimentallythe obliqueinherited lithospheric faults were simulated by a basal discrete velocity discontinuity (VD) characterised by two different angles (a) with respect to the extension direction atthe intersection of the VDs.Our models show that besides the extensiondirection which induces the formation of linear or independent en-echelon grabens, the intersection of the two oblique VD segments controls the location of the depocentre and concentrates subsidence. For different stretching direction values, the depocentre geometry variesfromstronglyasymmetric tosymmetricwhen thestretching directioncorresponds tothe bisectinglineofthe two VD segments. Applied to the Upper Rhine graben (central segment of the West European rift), our models allow interpretation ofthe developmentofthe LateEocene–Oligocenedepocentresatthe intersectionoftwomainobliqueinherited structures, as the result of a constant NW–SE extension direction. Concerning the southern East African rift, the graben geometries and the evolution of thesubsidence duringthe Mio-Pliocene period maybeexplained by the reactivationof two main Pan-African inherited shear zones with an E–W direction of extension.
Keywords:Analoguemodelling;Extension;Depocentre;Rhinegraben;Tanganyika
1. Introduction
The major role of geological inheritance on graben formation has been recognised in many rifts for the past decades (e.g., Illies, 1981; Ring, 1994; Bonini et al., 1997; Schumacher, 2002). Graben faults are often super- imposed on pre-existing crustal structures as in the Pan-
African mountain belts of East Africa (McConnell, 1972;
Ring, 1994; Lezzar et al., 2002), the Variscan main faults of the West European rift (Schumacher, 2002; Michon et al., 2003), and the Caledonian paleo-rifts and suture zones of the North Sea rift (Færseth et al., 1997; Rey et al., 1997). In the northern Lake Tanganyika rift, initial subsidence was controlled by reactivated Pan-African faults and the orientation of the two main fault trends which is parallel to the Pan-African belts (Lezzar et al., 2002) (Fig. 1a). In Cenozoic rifts of the French Massif
* Correspondingauthor.Tel.:+2622629386 82.
E-mailaddress:laurent.michon@univ-reunion.fr(L.Michon).
Fig. 1. (a) Simplified geological map of the northern segment of the Lake Tanganyika rift showing the location of the initial depocentres at the intersection of two main fault trends (afterLezzar et al., 2002). (b) Isopach map of the Late Eocene–Oligocene sediments in the Limagne graben (French segment of the West European rift). The maximum sedimentation appears at the intersection of the Aigueperse and Limagne faults (modified afterMorange et al., 1971). (c) Structural map of the Viking graben and surrounding area showing the two main fault trends resulting from the reactivation of pre-existing faults (afterFærseth et al., 1997).
Central (main segment of the West European rift), ex- tension has reactivated the Variscan faults and the depo- centre formed at the intersection of two main faults (Michon, 2001) (Fig. 1b). In the North Sea, the Caledo- nian inheritance played a major role on the development of the Viking graben and the Møre basin (Færseth et al., 1997) (Fig. 1c). In the Ethiopian rift, the occurrence of the two directions of faults was interpreted in terms of multistage rifting with two different extension directions (Bonini et al., 1997). However, the development of depocentres at the intersection of the two faults suggest, in many cases, a coeval fault history (Færseth et al., 1997; Lezzar et al., 2002; Schumacher, 2002; Michon et al., 2003).
Although these provinces were affected by distinct pre-extension histories with successive compression phases that developed several trends of crustal faults, they present a striking similarity, common to other rift systems: extension has reactivated only two main crust- al fault trends with an angular difference of around 408 (Table 1). The geological origin of such an angle value is hard to explain. Indeed, the two 408oblique trends do not correspond to the two fault orientations that affect the basement in the different areas. It also does not correspond to the theoretical value of around 608 be- tween two conjugated fault trends formed during a compressive event. When successive deformation events occur the previously formed faults are reacti- vated as long as the stress field slightly differ from the previous ones. This reactivation prevents the formation of any new main fault in angle domains close to the
inherited fault. So, we consider that the 408 value corresponds to the minimum angle value between two main non-coeval fault zones.
The role of orthogonal and oblique extension has already been studied experimentally using brittle–
ductile (Tron and Brun, 1991) or purely brittle mod- els (McClay and White, 1995; McClay et al., 2002), and mainly linear discontinuities. The main result is that oblique extension leads to the formation of en- echelon grabens and intra-rift sub-basins, whereas linear grabens develop with orthogonal extension.
Furthermore Bellahsen and Daniel (2005) recently show with brittle–ductile models that crustal perva- sive and discrete fabrics, oblique to the stretching direction entails the development of grabens present- ing two oblique directions. Although crustal inheri- tance plays a role in the graben geometry (Morley, 1999; Bellahsen and Daniel, 2005), it is widely accepted that lithospheric faults (i.e., discrete litho- spheric structures) strongly control the development of structures in the crust (e.g., Davy and Cobbold, 1991; Brun and Beslier, 1996). As extension usually leads to reactivation of preexisting intersecting litho- spheric fabrics, brittle–ductile experiments were car- ried out at crustal scale in which the intersecting lithospheric inheritance is simulated by a basal ve- locity discontinuity presenting two different orienta- tions. Such a set up enables us to determine (1) the role of oblique lithospheric fabrics in the develop- ment of a graben and its related depocentres, (2) the effect of extension direction on the graben and depo-
Table 1
Obliquity of the main fault trends in several rift systems
Area Main fault orientation Angular
difference
Reference
Northern Lake Tanganyika rift, EAR Graben border fault (N0) and the bRusizianQfaults (N130-140)
458 Lezzar et al., 2002
Ethiopian rift, EAR Graben border faults (N10 and N45) 358 Bonini et al., 1997
Upper Rhine graben, WER Graben border fault (N20) and the LB transfer fault (N55)
358 Schumacher, 2002
Limagne graben, WER Graben border fault (N0) and
the Aigueperse fault (N40)
408 Michon, 2001
Roer Valley rift system, WER Feldbiss (N150) and Veldhoven (N110) faults
408 Michon et al., 2003
Gulf of Lion, NW Mediterranean rift Nimes fault (N55) and N20 main orientation
358 Seranne, 1999
Viking graben, North Sea Graben border fault (N5) and N50 main orientation
458 Færseth et al., 1997
Rio Grande rift, USA The graben border fault (N0) and
the Tijeras fault zone (N45)
458 Baldridge et al., 1995
Average angular difference 408
LBF: Lalaye–Lubine–Baden Baden transfer fault. EAR: East African Rift, WER: West European Rift.
centre geometry, and (3) the interaction between linear and en-echelon grabens.
2. Experimental background
2.1. Scaling
Small-scale crustal models are similar to natural sys- tem if the distribution of stresses, densities and rheolo- gies are equivalent in nature and in experiments (Hubbert, 1937; Ramberg, 1981). It is widely accepted that a continental lithosphere with a normal thermal gradient is characterised by a 4-layer strength profile with two brittle layers (the upper crust and the brittle mantle lithosphere) and two ductile levels (the lower crust and the ductile mantle lithosphere) (e.g., Davy and Cobbold, 1991) (Fig. 2a). Analogue experiments suggest that during a rifting episode, the crustal defor- mation is initiated by a failure in the brittle mantle lithosphere (Allemand, 1990; Brun and Beslier, 1996).
During the process of rifting crustal deformation is con- trolled by the coupling between the upper and lower crust (Allemand, 1990; Brun, 1999), and rate of exten- sion (Michon and Merle, 2000). To take into account the role of this coupling,Michon and Merle (2000) have developed a scaling approach defining a strength ratio between the brittle (SB) and ductile (SD) layers. Similar scaling method is used in the present work to facilitate the comparison between our results and those obtained with a linear and continuous discontinuity at the base of the system (Michon and Merle, 2000).
The strength ratio being a dimensionless number, it must be of the same order of magnitude in model and nature (Eq. (1)):
SB SD
Model
¼ SB SD
Nature
:
ð1Þ In brittle materials, the strengthSBis defined as the differential stress r1r3;r1and r3corresponding to the maximum and minimum principal stresses, respec- tively.r1can be expressed as a linear function of depth hB (with gravity acceleration g and density q), or r3
(with a and b parameters depending of the angle of friction/and the cohesions0) (Eqs. (2)–(4))
r1¼aþbr3¼qghB; ð2Þ
where, a¼2s0 ffiffiffi
pb
; ð3Þ
b¼1þsin/
1sin/; ð4Þ
In a rifting context with vertical r1, the strength of the brittle crust is then expressed as (Eq. (5))
SB¼r1r3¼qghB qghBa b
:
ð5Þ
In experiments where a cohesionless material is used, Eq. (5) simplifies to (Eq. (6)):
SB¼r1r3¼2
3 qghB: ð6Þ
The strength SD of the ductile layer depends on the viscosity l of the material and the strain rate e˙, which corresponds to the ratio between the exten- sion rate V and the thickness of the ductile layer hD.
SD¼l˙ee¼l V hD
: ð7Þ
In nature, the upper crust has an average densityqof 2700 kg m3, a cohesions0of 107Pa and a angle of friction/between 30–328. We used Fontainebleau dry quartz sand to simulate the upper crust (Fig. 2b). This material is a cohesionless material with a density q of 1600 kg m3, and an angle of friction / around 30–
358. In the model, a silicone putty with a viscositylof 3104Pa s represented a lower crust with a viscosity of 1021 Pa s. Considering the strain rate in nature (1015 s1), an extension rate of 2 cm h1has been
Fig. 2. Strength profile (a) for a continental lithosphere with a normal thermal gradient and (b) in experiments. Sand is used to simulate the brittle parts of the lithosphere while silicone putty mimics the behav- iour of the lower crust and the ductile mantle lithosphere.
imposed in the experiments in order to obtain strength ratios of the same order of magnitude in nature and the models (56 and 13, respectively). As a consequence, the results of the experiments can be applied to natural systems. According to a geometrical scaling factor of 106(length in nature/model), 1 cm in the model repre- sents 10 km in nature. We conducted all the experi- ments with a large amount of extension (between 5 and 6 cm) to favour a better visualisation of the deforma- tion. In nature such amounts of extension (50 to 60 km) correspond to extension values between those of conti- nental rifts (e.g., 30 km in the French Massif Central grabens – Bois, 1993– and 17 km in the Rhinegraben
—Brun et al., 1992) and passive margins (e.g., several 100 km in the Galicia–Newfoundland passive margins
—Manatschal et al., 2001).
2.2. Apparatus
Modelling was performed at the ISES Tectonic Laboratory of the Vrije Universiteit of Amsterdam
(The Netherlands). To simulate the reactivation of discrete lithospheric structures, we conducted brit- tle–ductile experiments composed of a basal layer of silicone and a brittle cover consisting of three horizontal stratified sand layers (Fig. 3a). The system lies on a basal plate, which simulates the boundary between the crust and the mantle lithosphere. As in the experiments of Basile and Brun (1999) and Michon and Merle (2000), the rupture within the brittle mantle, which is considered to govern crustal deformation, was achieved by a velocity discontinu- ity (VD). The VD corresponds to the limit of a plastic sheet, which is attached to the mobile wall and located underneath the silicone layer. In all experiments, the VD is characterised by two oblique orientations differing by 408 (Fig. 3b).
As many authors (Tron and Brun, 1991; McClay and White, 1995; Clifton and Schlische, 2001; McClay et al., 2002), we used the angle a between the VD and the extension direction to define the experiments and to allow comparison of our results with those obtained in
Fig. 3. (a) Model cross-section before extension. The deformation is initiated by the limit of the basal plastic sheet, which induces a velocity discontinuity (VD) during extension. (b) Plan view geometry of the basal plastic sheet on which the silicone layer is emplaced. See text for the definition ofa. The arrows indicate the extension direction. The strike-slip motion associated with the lateral edges of the plastic sheet is also reported.
previous works. However, in each experiment a was measured from the intersection of the two VD segments allowing distinction between the VD segments charac- terized by identical absolutea-values (i.e., 708and 1108, and 808 and 1008) (Fig. 3b). An a-value difference between the two VD segments (a-VAD) was also defined to discuss the role of the geometry of the VD segment intersection in the location of the subsidence. The experi- ments were carried out with five distinct geometries in which twoa-values were applied simultaneously (Fig.
3b). The motion of the basal plastic sheet led extension along the VD segments and strike-slip motion along the plastic sheet lateral borders. During the experimental run, the main grabens were infilled with sand to simulate sedimentation. Surface photographs were taken at regu- lar intervals to analyse the initiation and propagation of the deformation. At the end of each experiment, the sand is soaked in water, and serial cross-sections were made parallel to the extension direction. For experiment 5, we reconstructed the 3D geometry of the model with GOCADR, in order to visualise the deformation and to understand its relationship to the strain within the sili- cone layer.
3. Results
3.1. Evolution of the deformation 3.1.1. Initial stages of deformation
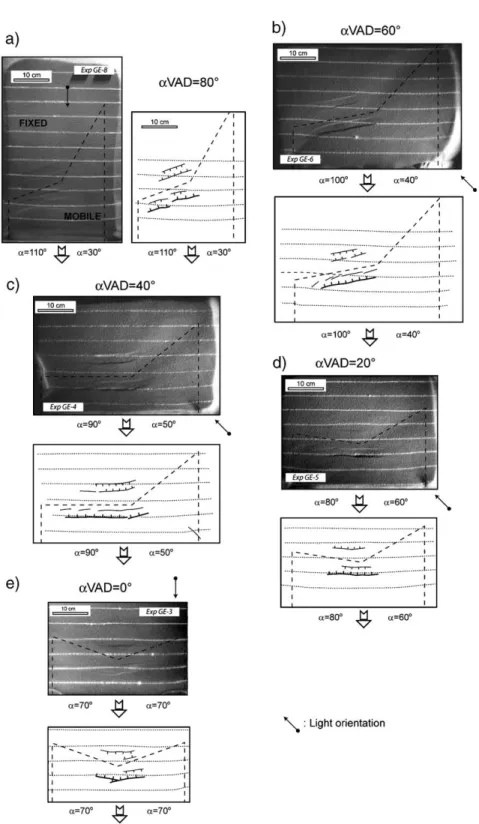
In all experiments, the first increments of extension (i.e.,~1 cm) is characterised by the development of 2 cm wide parallel grabens located on each side of the VD (Fig. 4). Of these two structures, the graben located above the mobile basal plate is separated from the second graben by a 4.0–4.5 cm wide horst. Fig. 4 shows that this general deformation changes in each experiment. In experiments with ana-value difference (aVAD) between the two VD segments equal or greater than 408(Fig. 4a, b, c), grabens and faults form simul- taneously along the VD, which presents the greatesta- value (i.e., 908, 1008 and 1108). In these models, the geometry of the graben located on the mobile part varies from an en-echelon graben with a= 1108 (Fig.
4a), to a purely linear structure witha= 908and 1008 (Fig. 4b, c). These variations in graben geometry situ- ated on the mobile part, slightly contrast with the geometry of the graben located on the fixed part, which is always linear. For aaVAD of less than 408 (Fig. 4d, e), the initial fault pattern is different during the first stages of deformation being restricted to the central part of the model, around the intersection of the two VD directions. With coevala-values (i.e.,a= 708
and a-VAD = 08), the grabens are centred above the intersection of the two oblique VDs (Fig. 4e), while they are slightly shifted along the VD with highest a- value when a differs (Fig. 4d).
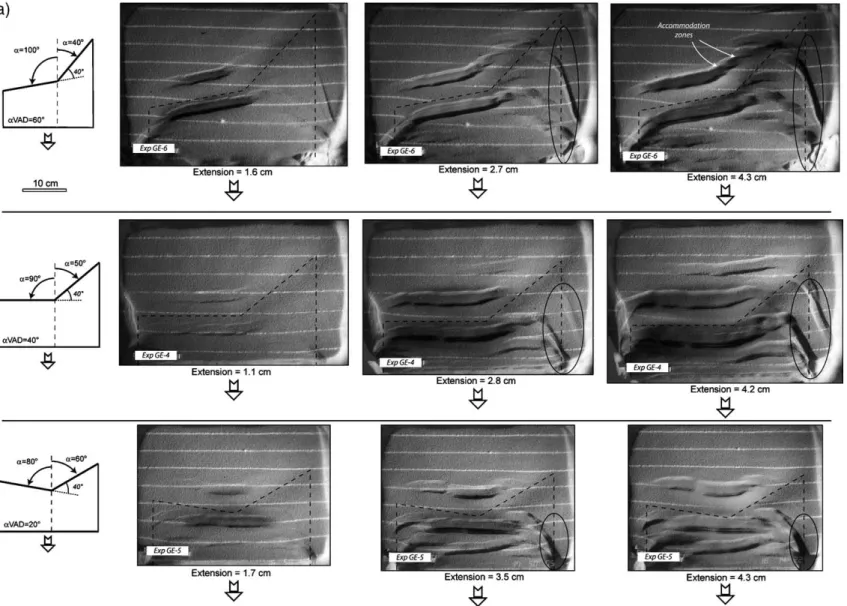
3.1.2. Propagation of the deformation
Fig. 5 shows the evolution of the deformation with increasing amount of extension for three different mod- els. Surface views reveal that the incipient faults which developed during the first increment of extension (1) propagate laterally along the VD segments charac- terised by the highest a-values (i.e., 808, 908 and 1008) and (2) control the formation of two parallel and linear main grabens. Then, when extension exceeds 2 cm, en-echelon grabens start to develop along the oblique VD segments (i.e., a-values ranging from 408 to 608). The geometry of these grabens varies as a function of a: increase of the graben number and obliquity with low a-values (Fig. 5b). Experiments show that the en-echelon grabens are linked by accom- modation zones rather than transfer zones as suggested by the lack of strike-slip fault between each graben (Fig. 5).
Note that the formation of the en-echelon grabens is associated with strike-slip deformation along the model lateral borders. The simultaneous development of the grabens and the strike-slip zones, and the lack of deformation between these two structures (Fig. 5) suggests that the strike-slip motion along the lateral borders do not induce the formation of the grabens but accommodates the extension on the borders.
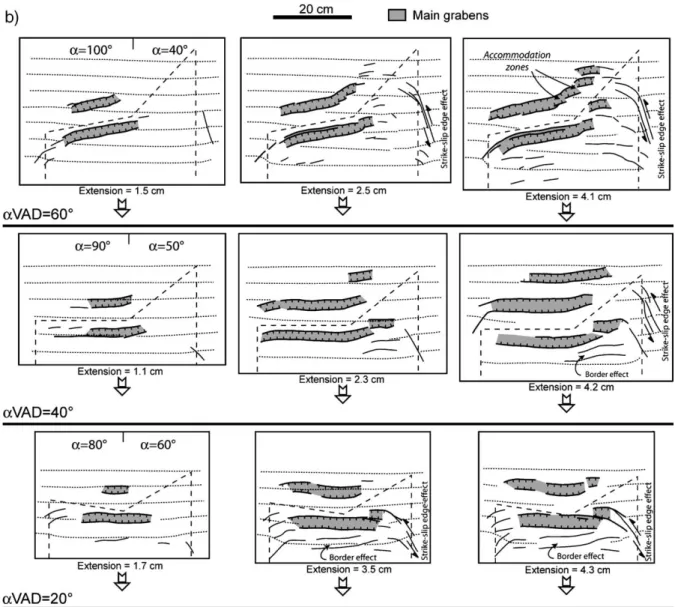
3.1.3. Final stage deformation
In the domains with nearly orthogonal extension (i.e., a-value ranging from 808 to 1108) (Fig. 6A, B, C and D), the two main grabens are linear and bounded by parallel to sub-parallel faults. In the domains characterized by a= 708, the geometry of the grabens is linear at the rift scale with en-echelon intra-rift sub-grabens (Fig. 6E). With strong oblique extension (a between 308 and 608), the formation of en-echelon grabens is limited by border faults, which are roughly parallel to the extension direction (Fig.
6A, B, C and D). Considering the system of grabens located on the fixed plate, it is interesting to note that the distance between each en-echelon grabens and their obliquity increases for low a-values. This suggests that with oblique extension the fault have a limited lateral prolongation and the deformation is accommodated by the creation of new grabens. In contrast, with orthogonal extension, lateral fault pro- longation is favoured and the size of the graben
increases laterally. The development of en-echelon grabens with high oblique extension (a= 308 to 508) is in agreement with the deformation style
observed by Tron and Brun (1991) with a single VD orientation and a strong oblique extension (a= 458 and 308), where the main border faults and
Fig. 4. Overhead views of the initial stage of surface deformation after ~1 cm of extension. (a)a= 308and 1108. (b)a= 408and 1008. (c)a= 508and 908. (d)a= 608and 808. (e)a= 708. The dashed lines on the pictures represent the location of the basal plastic sheet.
Fig. 5. (a) Overhead views for successive increments of extension with three different settings. Areas affected by the lateral edge effect are indicated by ellipses. See text for discussion on the role of the edge effect on the graben deformation. (b) Successive views illustrating the development of the grabens related to the VDs (grey) and to border effects.
the intra-rift grabens are nearly perpendicular to the direction of extension. In contrast, it differs from the deformation obtained by McClay et al. (2002) in purely brittle models in which the graben border faults always remains parallel to the VD and the intra-rift basins are perpendicular to the extension direction.
3.2. Characteristics of the subsidence 3.2.1. Cross-section deformation analysis
In cross-section, the deformation varies as a function of a (Fig. 7). With high a-values (708bab908), the
system geometry is characterized by an asymmetric graben above the movable plastic sheet and a symmet- ric graben on the fixed part. The half-graben presents a pseudo-roll-over geometry, indicating a flattening of the graben master fault with depth mimicking a kinked planar or a nearly listric detachment. Due to the asym- metric thinning of the silicone, the initial horst located between the two main grabens evolves as a tilted and homogeneous block. Although the surface deformation reveals the development of several other faults and grabens during the experiments, the concentration of the subsidence remains into the two main grabens (Fig.
8a) and the strongest thinning of the silicone layer
Fig. 5 (continued).
between the two grabens (Fig. 8b), confirms that a basal VD induced the development of two main grabens at high extension rates (i.e., N1.4 cm/h) (Michon and
Merle, 2000). The faults of minor importance might result from edge effects and/or secondary flow of the silicone layer during the VD displacement.Michon and
Fig. 6. Overhead views of the final stage deformation. (A)a= 1108and 308. (B)a= 1008and 408. (C)a= 908and 508. (D)a= 808and 608. (E) a= 708. The dashed lines on the pictures represent the location of the basal plastic sheet. Thick lines designate the faults controlling the main graben formation (grey).
Merle (2000)also shown that with low extension rate, only the asymmetric graben located on the movable part remains.
In the present study, our analysis of the subsidence in the asymmetric graben is therefore relevant as it is the only graben that always develops whatever the extension rate.
With a-values lower than 708, the overall system geometry changes. The predominance of the two main grabens disappears and the deformation is distributed across the whole model (Fig. 7). Although the struc- tures related to the VD are poorly visible in the brittle part of the model, cross-sections illustrate that the thinning of the silicone layer associated with the VD remains. We explain the decrease of the thinned silicone width for lowa-values by a progressive predominance of the strike-slip component into the silicone layer when high oblique extension is applied.
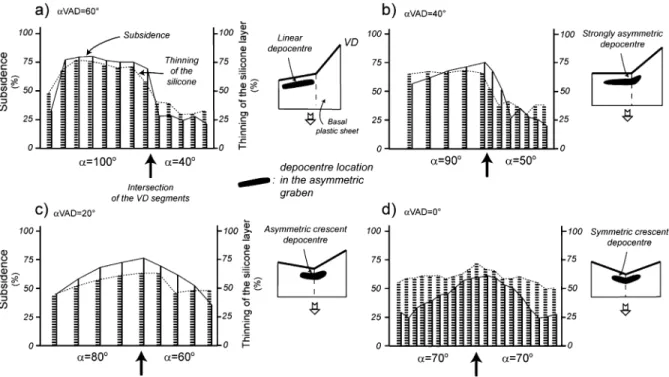
3.2.2. Location and geometry of the depocentres Analysis of the maximum amount of subsidence in each cross-section allows definition of the shape and the location of the depocentres. For low and high a- values, the amount of subsidence is determined in the main graben associated with the thinning of the silicone layer (i.e., the asymmetric graben for high a-values).
Fig. 9shows that the characteristics of the depocentres depend on the direction of extension with respect to fabrics. When the aVAD between the two VDs is greater than 408 (Fig. 9a), the subsidence is almost homogeneous along each segment and is maximum in the graben related to the VD with the highesta-value (a= 1008). In contrast, when the aVAD is lower than 408, the subsidence is maximum above the intersection of the two VDs, inducing the development of a depo- centre (Fig. 9b, c and d). For decreasingaVAD (from 408 to 08), subsidence values become progressively
Fig. 7. Cross-sections in the models for differenta-values showing the development of two main grabens whenab608and several grabens with aN708. With higha-values the progressive decrease of the area affected by the silicone thinning (with a similar amount of extension) suggests an increase of the strike slip component in the silicone layer. See cross-section location onFig. 6.
symmetric and centred above the VD intersection, cre- ating a crescent shape depocentre foraVAD = 08.
Fig. 9also illustrates the thinning of the silicone layer for each cross-section. The comparison of the subsidence and the thinning of the silicone values for different aVAD provide information, which are note- worthy. When aVAD equals 608 (Fig. 9a), both subsidence and thinning of the silicone layer are nearly constant along each VD segment (around 75–80% for a= 1008 and 25–35% for a= 408). The constant thinning of the silicone layer along the VD segments remains when aVAD = 408 (Fig. 9b), whereas the subsidence is concentrated above the intersection of the two VDs. Finally, when aVAD is lower than 408 (Fig. 9c and d), the thinning of the silicone layer is slightly greater at the intersection of the two VD segments than along them (i.e., around 15–20% of additional thinning), and the amount of subsidence significantly changes between the inter- section and the VD segments (i.e., 40 to 50% higher subsidence in the central part of the depocentre than in its borders). These different observations suggests that the development of the depocentre is not only
controlled by the thinning of the silicone, but also by the location of the intersection of the two VD seg- ments when aVAD is lower or equals to 408. This interpretation is confirmed by the location of the initial deformation and subsidence (Fig. 4). Finally, our study reveals that the depocentres are not prone to migration with increasing amount of extension.
Therefore, the displacement of the depocentre loca- tion most likely results from a change of the exten- sion rate and/or the direction of extension.
4. Discussion
Oblique rifting was already studied during the last decade using different type of extension (symmetric vs.
asymmetric), different experimental apparatuses, differ- ent rheological stratifications and a linear VD s.l. (i.e., mobile or fixed edge of a basal plate, or rubber sheet) (Tron and Brun, 1991; McClay and White, 1995; Clif- ton et al., 2000; McClay et al., 2002).
We carried out analogue experiments with asymmet- ric extension to analyse (1) the role of oblique exten- sion and (2) the effect of the coeval activity of two
Fig. 8. 3D reconstruction of the experiment witha= 708(Fig. 6E). (a) 3D geometry of the model showing the location of both the depocentre and the silicone thinning. For the top of the sand layer, red to blue colours are used to show the increasing amount of subsidence. The black line indicates the location of the intersection between the two orientations. The black arrow shows the direction of extension. (b) Thinning of the silicone layer. Red, white and blue colours correspond to low, medium and high amount of thinning, respectively. The grey plane represents the fault plane of the major fault linked to the half-graben. The white arrow indicates the direction of extension.
oblique inherited lithospheric faults in the graben and depocentre formation.
4.1. Comparison of the experimental procedures We first focus our discussion on the effect of the type of extension (i.e., symmetric vs. asymmetric) and the different experimental procedures in the deforma- tion of purely brittle and brittle–ductile models in order to estimate the a priori difference of deformation related to both the apparatus and the type of extension.
4.1.1. Experiments with brittle materials only
Two main procedures are usually used to simulate rifting processes in the upper crust. Extension is in- duced by either the limit of a basal plastic sheet lying on a fixed platform (e.g.,Fauge`re et al., 1986), or by a central basal rubber sheet (BRS) linked to one or two movable parts (McClay and White, 1995; McClay et al., 2002). The first procedure with a discrete VD allows simulation of discrete crustal fabric while in the second procedure the BRS mimics a basal detach- ment (McClay and White, 1995).
With asymmetric orthogonal extension (i.e., mov- ing only one part), a discrete mobile or fixed VD entails the formation of an asymmetric graben with a permanent master fault and several conjugate normal
faults (Fauge`re et al., 1986; Allemand and Brun, 1991) (Fig. 10a). With a symmetric orthogonal exten- sion imposed by two discrete VDs, the deformation pattern depends on the initial distance between the VDs. If the initial distance is large enough to prevent any interaction between the half-grabens related to each VD, two opposite half-grabens form, bounding a central horst above the fixed central part. This global geometry (i.e., two lateral half-grabens and a central horst) is nearly similar to the one obtained with a 10 cm wide BRS where two asymmetric grabens separat- ed by a central horst are created (McClay et al., 2002) (Fig. 10b). The development of an asymmetric graben above each limit of the BRS suggests that the latter(s) correspond to two discrete VDs.
Experiments with oblique extension show that whatever the approach is (i.e., BSR or discrete VD above a fixed basal plate), extension always entails the formation of linear rift, parallel to the VD (Higgins and Harris, 1997; McClay et al., 2002) (Fig. 11a). The main difference is that in the BRS approach the model central part, which lies above the BRS is affected by several normal faults roughly perpendicular to the extension direction while no deformation occurs above the fixed central part with the discrete VD approach. Thus, in experiments with brittle material and a BRS, the rift orientation is imposed by the VD
Fig. 9. Subsidence (thin lines) and thinning of the silicone layer (thick dashed lines) measured in percent of the initial thickness (i.e., 1 cm for the silicone layer and 2 cm for the sand layer) on cross-sections form experiments witha= 408and 1008(a),a= 508and 908(b),a= 608and 808(c), and a= 708(d). For each experiment, small cartoons illustrate the location of the depocentre with respect to the basal plastic sheet.
orientation and only the intra-rift fault and intra-gra- ben orientation depend on the extension direction. The use of a BRS subsequently allows a partial decoupling between the deformation controlled by the VDs (i.e., parallel to the VDs) and the deformation related to the stretching of the rubber sheet (i.e., perpendicular to extension).
4.1.2. Experiments with brittle–ductile materials Instead of using a BRS to allow a decoupling in the model, several studies performed experiments with a basal silicone layer and simulated rifting processes at crustal scale (e.g.,Allemand and Brun, 1991; Tron and Brun, 1991; Bonini et al., 1997; Michon and Merle, 2000). Michon and Merle (2000) have shown that asymmetric orthogonal extension due to a basal discrete VD leads to the development of one or two grabens, depending on the extension rate. With symmetric or- thogonal extension (i.e., 2 discrete VDs), the overall geometry depends on both the extension rate and the initial distance between the VDs. The 2, 3 or 4 grabens that are prone to form are connected to the VDs by shear zones within the ductile layer (Fig. 10c). Thus, in a way similar to models with brittle materials, symmet-
ric extension induces a multiplication of the structures and subsequently complexifies the rift geometry.
Experiments with oblique extension clearly demon- strate that the silicone layer allows a decoupling of the deformation between the VDs and the upper brittle layer (Tron and Brun, 1991; Bonini et al., 1997; Higgins and Harris, 1997). Our models with two oblique basal VDs suggest that this decoupling is partial as the rift system shape mimics the geometry of the VD (Fig. 6).
Comparison of an experiment performed by McClay and White (1995) with a= 608, with the geometry of the symmetric graben developed in our model with a= 708 reveals striking similarities in terms of fault orientation and depocentre location (Fig. 11). Despite the use of different experimental procedures in both models, (1) the depocentre and sub-graben formation is caused by intra-rift normal faults with an orientation sub-orthogonal to the stretching direction, and (2) the depocentres are lat- erally shifted and linked by accommodation zones, which form topographic highs. The similarity be- tween the structures obtained by McClay and White (1995) and in the present work is kept for high a-values (z608) and stops for low a-values
Fig. 10. Comparison of the structures obtained with different experimental procedures and orthogonal extension. (a) Experiment with brittle material only and a discrete mobile VD (afterFauge`re et al., 1986). (b) Experiment with brittle material only and a basal rubber sheet (afterMcClay et al., 2002). (c) Brittle ductile experiment with a discrete mobile VD (afterMichon and Merle, 2003). See text for discussion.
(b608). Indeed, in experiment with a BRS and a= 458, the overall structure remains linear with intra-rift en-echelon sub-basins (see Fig. 6 inMcClay et al., 2002), whereas independent en-echelon gra- bens are formed in our models (Fig. 6). This geom- etry difference (i.e., presence or absence of faults parallel to the VDs) suggests that the decoupling is more important in the brittle–ductile experiments than with a BRS and brittle materials only.
Finally, one could ask whether asymmetric or sym- metric extension best simulates rifting processes.
Experiments with brittle materials and a BRS were performed with both asymmetric extension (i.e., one moving wall) (McClay and White, 1995) and symmet- ric extension (i.e., two moving walls) (McClay et al., 2002). Similarly, crustal or lithospheric scale brittle–
ductile experiments were conducted with asymmetric (e.g.,Brun and Beslier, 1996) and symmetric extension (Michon and Merle, 2000). Sandbox experiments with a linear BRS show similar deformation patterns with asymmetric or symmetric extension (McClay and White, 1995; McClay et al., 2002), suggesting that the extension mode does not correspond to the key parameter that controls the graben geometry. In brit-
tle–ductile experiments at crustal or lithospheric scale, asymmetric extension is achieved with one VD (e.g., Brun and Beslier, 1996; Michon and Merle, 2000), while symmetric extension is performed by two VDs (e.g., Michon and Merle). It is widely accepted that the VD simulates the rupture of the brittle mantle litho- sphere (Brun and Beslier, 1996). Subsequently, asym- metric or symmetric extensions are not used to determine the effect of the extension mode in the graben formation but are simply used to understand the role of the brittle mantle lithosphere rupture number in the rift system geometry. It consequently follows that symmetric and asymmetric extension does not have the same signification in the sandbox experiments with a BRS and in brittle–ductile experiments. Symmetric and asymmetric extension is complementary extension modes allowing to understand better the complexity of rift systems.
4.2. Model deformation
It is widely accepted that the formation of a depo- centre results from differential displacements along the graben or sub-basin border faults. The location of the
Fig. 11. Comparison of fault pattern in experiments carried out with (a) a linear basal rubber sheet, a brittle material anda= 608(afterMcClay and White, 1995), and (b) coeval oblique VDs (a= 708), brittle–ductile materials. See text for explanation.
depocentres in experiments with a linear VD reveals that this maximum amount of vertical displacement is achieved along the newly formed faults (i.e., sub-or- thogonal to the stretching direction) (McClay and White, 1995). In a first approximation order, this result is confirmed by our experiment with two coeval oblique VDs, where depocentres are located in the VD domain characterised by the most orthogonal ex- tension direction (Fig. 9a, c and d). However, it is noteworthy that in experiment with a= 908 and 508 (Fig. 9b), the depocentre developed above the two VD segment intersection, while orthogonal extension is achieved uniformly along the VD segment with a= 908. Furthermore, the different deformation pattern obtained along segments with the same angle to the extension direction (i.e., 808and 1008are of the same obliquity with respect to the extension direction) (Fig.
9a and c) indicates that besides the extension direction the intersection of the two VD segments is a key parameter, which plays a role in the development of depocentres. Finally, the more parallel to the stretching direction the bisecting line of the two VD segments is, the more symmetric the depocentres are prone to de- velop. Applied to nature, these results first suggest that when two oblique lithospheric faults are reactivated they concentrate the deformation (i.e., the subsidence) at their intersection. At crustal scale, Bellahsen and Daniel (2005) have recently shown a similar control of the intersection of oblique inherited and new crustal faults in the depocentre development. Then, the struc- tural inheritance may act at both crustal and lithospheric scale, controlling the rift system geometry and inducing heterogeneous subsidence within the graben. Addition- ally the depocentre geometry and location are highly sensitive to the extension direction. These geological features can be used in nature for establishing the extension direction.
Experiments with coeval sub-orthogonal and oblique stretching directions show that grabens appear first in the domain with the highesta-value and are secondly formed in en-echelon pattern along the oblique VD segments (Fig. 5). This timing of deformation is explained by a partitioning of the total displacement in strike-slip and normal components along the oblique VDs, while only normal component exists in orthogo- nal extension. In consequence, for a uniform amount of displacement in the model or in nature, the rupture due to normal stress (i.e., leading to the development of pure normal faults) is reached first in the domain char- acterised by orthogonal extension and secondly along the oblique VD segments or the oblique lithospheric faults.
5. Application to natural examples
5.1. The Upper Rhine graben (West European rift) The Upper Rhine graben (URG) is a 300 km long linear Cenozoic structure, which corresponds to the central segment of the West European rift (Fig. 12a).
The graben subsidence started during the Late Eocene (Priabonian) and is still active during the Quaternary.
Recent models proposed several extension directions to explain the URG formation and geometry. Early models argued that the graben development resulted from an E–
W extension due to the N–S collision between Eurasian and African plates (Tapponnier, 1977). A second inter- pretation, based on microtectonic studies stated that the graben formation was characterised by successive changes of the paleo-stress since the Late Eocene (e.g., Bergerat, 1987). This model was recently sup- ported by a comparison between the paleo-stress results and the geometry of the URG depocentres (Schuma- cher, 2002). According to these authors the graben formation could result from 4 successive paleo-stresses (i.e., Priabonian N–S compression, Rupelian E–W ex- tension, Chattian SW–NE compression and Miocene–
Quaternary SE–NW compression), which originated from plate reorganisation during the Eurasia–Africa collision. Based on a three-dimensional kinematic res- toration, Behrmann et al. (2003) proposed a two-fold evolution of the graben with a N80 Late Eocene–Oli- gocene early extension, followed by a N60 Miocene–
Quaternary oblique extension. This model agreed the NE–SW oblique rifting interpretation already proposed byChorowicz and Deffontaines (1993).
Structurally, the URG is characterized by two main orientations referred as Permo-Carboniferous and Rhenish trends, which are inherited from the Variscan to Late Variscan evolution (Schumacher, 2002). The main Permo-Carboniferous structure is the Lalaye–
Lubine–Baden–Baden fault (LBF) bounding the Sax- othuringian and Moldanubian Variscan lithospheric domains (Wickert and Eisbacher, 1988). This WSW–
ENE trending fault crosscuts the graben in its central part and forms a topographic high separating two zones of subsidence (Fig. 12). The structure is interpreted as a transfer fault for the Late Eocene–Oligocene period as it separates two half-grabens of opposite polarity (Brun et al., 1992). In the North, the graben is bounded in the east by a west dipping major fault. South to the Var- iscan fault, the fault is east dipping and the thickest sediment deposit is localized in the Western part. The second Variscan orientation (i.e., Rhenish trend) is parallel to the Cenozoic graben and is recognized in
outcrops in the Variscan massifs (Vosges, Black Forest and Odenwald) and with geophysical methods into the graben (Edel and Fluck, 1989). This Rhenish trend was
reactivated during the Late Eocene–Oligocene exten- sion and has controlled the orientation of the graben borders faults. Recent tomographic data show that these
Fig. 12. Geological map of the West European Rift. The Upper Rhine graben corresponds to the central segment of this Cenozoic rift system. (b) Isopach maps of the Upper Eocene, Lower Rupelian, Upper Rupelian and Chattian sedimentation (afterSchumacher, 2002). The small cartoons indicate the general shape of the depocentres and our interpretative stress field inferred from this geometry (constant NW–SE direction of extension).
faults affect the whole lithosphere (Lopes Cardozo and Granet, 2003).
We use in the following section our experimental results to determine the paleo-stress fields, which affected the URG during the Late-Eocene–Oligocene evolution. Experiments show that the development of a depocentre is highly sensitive to a contemporaneous activity of oblique faults and to the extension direc- tion. Isopach maps were published for four periods between the Late Eocene and the Oligocene (Schuma- cher, 2002) (Fig. 12b). As the Oligocene sedimenta- tion was partly eroded during the Miocene to present- day uplift south to the LBF (Villemin et al., 1986), we focus our analysis in the northern part of the graben.
In this segment, each period is characterized by the development of a main depocentre which is always bounded in the south and the east by the LBF and the eastern main border fault, respectively (Fig. 12b). This suggests first a continuous coeval activity of these two main structures, which have controlled the formation of the depocentres. Although the depocentre geometry has slightly changed between the Late Eocene to Oligocene, one can note that it is nearly symmetric from the intersection of the two main faults. Accord- ing to our models, the development of a nearly sym- metric depocentre at the intersection of two oblique orientations occurs for extension directions correspon- ding to the bisecting line of the two directions. In consequence, we interpret the development of the Late Eocene–Oligocene depocentres and the URG forma- tion as resulting from a constant NW–SE extension direction. Variations of the extension rate and a slight rotation of the extension direction (b108) may explain the depocentre geometry differences.
As proposed by several authors (Meier and Eisba- cher, 1991; Schumacher, 2002; Michon et al., 2003), we interpret the Early Miocene migration of the Late Eocene–Oligocene depocentre towards the northern part of the URG as the result of a change in the stress field at the Oligocene–Miocene transition. The super- position of the Miocene and Quaternary depocentres suggests a constant NE–SW stress field since the be- ginning of the Miocene.
This two-fold evolution of the URG with a Late Eocene–Oligocene NW–SE extension followed by a NE–SW Miocene–Quaternary extension is similar to the one observed in the Roer Valley rift system (i.e., the northern continuity of the URG) (Michon et al., 2003). According to these authors, the URG develop- ment and the global evolution of the European platform may result from the formation of the Alpine mountain chain since the latest Cretaceous.
5.2. Southern East African rift (Tanganyika, Rukwa and Malawi rifts)
The southern East African rift (SEAR) corresponds to the southern part of the western branch of the East African rift. It is composed from north to south of the Tanganyika, Rukwa and Malawi rifts (Fig. 13). At a regional scale, the Tanganyika rift is characterised by two different orientations. North of the Rukwa shear zone, the graben trends N–S whereas it presents a N150 direction south of this Precambrian shear zone. The Rukwa rift is a N130–140 half-graben parallel to the Rukwa shear zone. The southernmost main expression of the SEAR (i.e., the Malawi rift) is a N–S trending structure limited in the north by the Rukwa shear zone.
In the SEAR, the first sediments related to the extension deposited 12 My ago in the central part of the incipient Tanganyika rift (Lezzar et al., 2002). Subsidence then propagated diachronously toward the northern (7–8 Ma) and southern (2 Ma) halves of the graben (Rosendahl et al., 1992; Lezzar et al., 2002). In the Malawi rift, the first syn-rift sediments have an age estimated at 8.6 Ma (Ring and Betzler, 1995). Sedimentation started first in the northern half of the Malawi rift and propagated toward the south with ongoing extension (Rosendahl et al., 1992).
Seismic profiles reveal that the two main grabens (i.e., the Malawi and Tanganyika rifts) are asymmetric grabens characterised by a succession of opposing half- grabens (Rosendahl et al., 1992). The Rukwa graben is a half-graben, which overlies Permo-Triassic and Me- sozoic basin structures. In contrast to the Malawi and Tanganyika rifts, seismic data show a lack of alternating half-graben in the Rukwa rift (Rosendahl et al., 1992) which may result from a strong control of the Precam- brian to Mesozoic structures on the development of this graben during the Cenozoic. Such an influence of pre- existing structures on the graben geometry in the SEAR has been suggested by many authors (e.g.,Ring, 1994;
Bonini et al., 1997; Lezzar et al., 2002).
At a regional scale, the province is characterised by (1) two Precambrian cratonic areas (the Tanzanian and Zambian blocks) separated by the N130–140 Rukwa shear zone and (2) several orogenic belts resulting from Kibaran and Panafrican orogenies. West of the Tanza- nian craton (i.e., in the northern Tanganyika Lake area), the dominant foliation in the Precambrian basement trends N–S while it turns to N130–140 in the Tanga- nyika Lake central part. This foliation direction, which is associated with the Ubendian belt, is connected toward the southeast to the Rukwa shear zone. South of the Tanzanian craton, the pre-Cenozoic basement
presents two mains orientations (i.e., SE–NW and SW–
NE) in relation with the Ubendian belt, and the Chima- liro shear zone and NE–SW Karoo grabens, respective- ly (Ring, 1994). It is noteworthy that each rift is parallel to a pre-existing structure except the southern branch of the Tanganyika rift which is the only rift segment that affects a cratonic province (i.e., the Zambian block) south of the Rukwa shear zone.
During the last decades, several extension directions were proposed to explain the formation and the geom- etry of the East African rift. Based on the overall geometry of the graben, selected earthquake focal mechanism solutions and the potential existence of large NW–SE transfer zones, Chorowicz and Mukonk (1980)andRosendahl et al. (1992) argued that the rift system results from an oblique NW–SE extension. In opposition, some studies suggested an E–W extension for the same period (Morley, 1988; Ebinger, 1989).
These interpretations are supported by reconstructions of plate kinematics indicating a roughly E–W extension direction (Jestin et al., 1994). Microstructural analysis in the Malawi rift reveals a multi-stage extensional history with an initial ENE/E–WSW/W rifting direction between 8.6 and 0.55 Ma and a ESE/SE–WNW/NW extension since 0.55 Ma (Ring, 1994). Based on basin analysis in the northern Tanganyika rift a similar two- fold evolution was proposed by Lezzar et al. (2002) with a E–W extension between 12 and 3.5 Ma followed by a second NW–SE extension (1.1–0.4 Ma).
In the light of our experimental results which allow determination of the extension direction from the sub- sidence location and evolution, we consider that the regional geometry of the SEAR and the location of the incipient subsidence during the Miocene resulted from an initial E–W extension. First as shown above, the Tanganyika rift is characterised by two oblique orienta-
Fig. 13. Geological map of the South East African rift (SEAR) showing the graben location and the Precambrian and Panafrican structural inheritance.
tions, which intersect in the rift central part. The be- ginning of the subsidence at the intersection of two structural trends (N–S and SE–NW) and its propagation in the northern branch can be compared to the defor- mation pattern observed in experiment witha= 908and 508(Fig. 14).
Second, the location and style of deformation suggest that the Rukwa shear zones and the segment of the Ubendian orogenic belt which is located below the northern branch of the Tanganyika rift were contemporaneously reactivated at a lithospheric scale during extension. The location of the southern Lake Tanganyika rift, south of the main structural trend intersection and into the bstrongQ Zambian cratonic area may explain its delayed and less intense deformation. As shown in Fig. 14b, the reactivation of oblique lithospheric structures leads to the forma- tion of en-echelon grabens above the mobile part of the model. Comparison of these experimental results and integration of the natural pre-existing structures in the southern end of the SEAR may explain the formation and the orientation of the Malawi rift (Fig.
14). The different location of the en-echelon graben in nature (i.e., Malawi rift) and in the model may result from the strong role of the Rukwa shear zone, which has induced a transfer of deformation east of the Zambian cratonic area. In addition, the deforma- tion (i.e., narrow subsidence) recorded in the Rukwa rift while no oblique graben is formed in our isotro- pic models may result from the control of the Rukwa shear zone at crustal and lithospheric scale. Finally, the lack of secondary grabens (visible above the motionless part of our models) parallel to the Tanga- nyika and Malawi rifts likely results from a low extension rate.
The present interpretation may explain the large- scale geometry of the SEAR with a E–W direction of extension and the reactivation of two main lithospheric structures (i.e., the NE–SW Rukwa shear zone and the N–S trending Ubendian orogenic belt in the northern part of the Lake Tanganyika rift). This Mio-Pliocene evolution is not in disagreement with a recent NW–SE extension direction deduced from microstructural (Ring, 1994) and basin (Lezzar et al., 2002) analyses.
Fig. 14. Comparison of the deformation in the SEAR (a) and in experiment witha= 508and 908(b). Note (1) the location of the initial subsidence and (2) the roughly similar graben shape (grey) in nature and in the model. The difference in the location of the en-echelon graben between the model and the SEAR may result from a transfer of the deformation east of the Zambian Block favoured by the Rukwa shear zone.
6. Conclusions
Analysis of natural graben geometries and fault patterns reveals the nearly systematic occurrence of two fault orientations with an angular obliquity of around 408 during extension. These faults are parallel or sub-parallel to pre-existing crustal and lithospheric fabrics. We carried out experiments to simulate the reactivation of coeval oblique lithospheric faults in the graben and depocentre development. Comparison of our results with those obtained with different exper- imental procedures shows differences and similarities which highlight the limits of each experimental ap- proach. Nevertheless, common results are observed.
In previous works (Tron and Brun, 1991; McClay and White, 1995; McClay et al., 2002), the depocentre formation is controlled by faults which present the most orthogonal orientation with respect to the stretch- ing direction. Our experiments with two oblique VD segments, which simulate the reactivation of two inher- ited lithospheric faults complete these results and allow to better understand the role of the inheritance in the graben formation. When two oblique lithospheric fab- rics are contemporaneously reactivated, the models suggest that the intersection of the two lithospheric faults controls the location of the depocentres, its ge- ometry (i.e., symmetric or asymmetric) depending on the stretching direction. Then, analysis of the natural depocentre geometry allows determination of the direc- tion of extension during syn-rift sedimentation.
Application to the Upper Rhine Graben suggests that this segment of the West European rift was affected by a constant NW–SE extension direction between the Late Eocene and the Late Oligocene. In the Southern East African Rift the global geometry and the distribu- tion of the subsidence may result from the coeval reactivation of the Rukwa shear zone and the Ubendian segment of the Pan-African orogenic belt located in the northern part of the Lake Tanganyika rift. The location of the initial subsidence suggests an E–W extension direction which has induced the progressive formation of the Late Tanganyika rift, Rukwa rift and Lake Malawi rift.
Acknowledgments
This publication is a contribution of the Environ- mental Tectonic (ENTEC) European Project funded by EU (RTN-1999-00003). Dimitrios Sokoutis is grateful to ISES (the Netherlands Centre for Integrat- ed Solid Earth Science) and NWO (the Netherlands Organization for Scientific Research) for the financial
support. The authors want to thank Giacomo Corti, Tim Dooley and Jean-Pierre Brun for useful com- ments which helped to greatly improve the prelimi- nary version of the manuscript. Thanks are also given to Geza Worum for the preparation of the 3D reconstruction.
References
Allemand, P., 1990. Approche expe´rimentale de la me´canique du rifting continental. Me´m. Doc. Ge´osci. Rennes 38 175 pp.
Allemand, P., Brun, J.P., 1991. Width of continental rifts and rheo- logical layering of the lithosphere. Tectonophysics 188, 63 – 69.
Baldridge, W.S., Keller, G.R., Haak, V., Wendlandt, E., Jiracek, G.R., Olsen, K.H., 1995. The Rio Grande rift. In: Olsen, K.H. (Ed.), Continental Rifts: Evolution, Structure, Tectonics, Development in Geotectonics, vol. 25. Elsevier, Amsterdam.
Basile, C., Brun, J.P., 1999. Transtensional faulting patterns ranging from pull-apart basins to transform continental margins: an exper- imental investigation. J. Struct. Geol. 21, 23 – 37.
Behrmann, J.H., Hermann, O., Horstmann, M., Tanner, D.C., Bertrand, G., 2003. Anatomy and kinematics of oblique continental rifting revealed: a three-dimensional case study of the southeast Upper Rhine graben (Germany). Bull. Am. Assoc. Pet. Geol. 87, 1 – 17.
Bellahsen, N., Daniel, J.-M., 2005. Fault reactivation control on normal fault growth: an experimental study. J. Struct. Geol. 27, 769–780.
Bergerat, F., 1987. Stress fields in the European platform at the time of Africa–Eurasia collision. Tectonics 6, 99 – 132.
Bois,, 1993. Initiation and evolution of the Oligo-Miocene rift basins of southwestern Europe: contribution of deep seismic reflection profiling. Tectonophysics 226, 227 – 252.
Bonini, M., Souriot, T., Boccaletti, M., Brun, J.P., 1997. Successive orthogonal and oblique extension episodes in a rift zone: labora- tory experiments with application to the Ethiopian Rift. Tectonics 16, 347 – 362.
Brun, J.P., 1999. Narrow rifts versus wide rifts: inferences for the mechanics of rifting from laboratory experiments. Philos. Trans.
R. Soc. Lond. Ser. A: Math. Phys. Sci. 357, 695 – 712.
Brun, J.P., Beslier, M.O., 1996. Mantle exhumation at passive margin.
Earth Planet. Sci. Lett. 142, 161 – 173.
Brun, J.P., Gutscher, M.A.DEKORP-ECORS team, 1992. Deep crust- al structure of the Rhine graben from DEKORP-ECORS seismic reflexion data: a summary. Tectonophysics 208, 139 – 147.
Chorowicz, J., Deffontaines, B., 1993. Transfer faults and pull-apart model in the Rhine graben from analysis of multi-source data. J.
Geophys. Res. 98, 14.339 – 14.351.
Chorowicz, J., Mukonk, N.B., 1980. Line´ament anciens, zones trans- formantes re´centes et ge´otectonique des fosse´s de l’Est Africain, d’apre`s la te´le´de´tection et la microtectonique, Museum Royal de l’Afrique centrale, De´partement de Ge´ologie et Mine´ralogie, Ter- vuren. Rapp. Ann., 143 – 167.
Clifton, A.E., Schlische, R.W., 2001. Nucleation, growth, and linkage of faults in oblique rift zones: results from experimental clay models and implications for maximum fault size. Geology 29, 455 – 458.
Clifton, A.E., Schlische, R.W., Withjack, M.O., Ackermann, R.V., 2000. Influence of rift obliquity on fault population systemat- ics: results of experimental clay models. J. Struct. Geol. 22, 1491 – 1509.
Davy, Ph., Cobbold, P.R., 1991. Experiments on shortening of 4-layer continental lithosphere. Tectonophysics 188, 1 – 25.
Ebinger, C.J., 1989. Tectonic development of the western branch of the East African Rift System. Geol. Soc. Amer. Bull. 101, 885 – 903.
Edel, J.B., Fluck, P., 1989. The Upper Rhenish shield basement (Vosges, Upper Rhinegraben, Schwarzwald) main structural fea- tures deduced from magmatic, gravimetric and geological data.
Tectonophysics 169, 303 – 316.
Færseth, R.B., Knudsen, B.E., Liljedahl, T., Midbøe, P.S, Søder- strøm, B., 1997. Oblique rifting and sequential faulting in the Jurassic development of the northern North Sea. J. Struct.
Geol. 19, 1285 – 1302.
Fauge`re, E., Brun, J.P., Van Den Driessche, J., 1986. Bassins asyme´triques en extension pure et en de´crochement: mode`les expe´rimentaux. Bull. Cent. Rech. Explor. Prod. Elf-Aquitaine 10, 13 – 21.
Higgins, R.I., Harris, L.B., 1997. The effect of cover composition on extensional faulting above re-activated basement faults: result from analogue modelling. J. Struct. Geol. 19, 89 – 98.
Hubbert, K.M., 1937. Theory of scale models as applied to the study of geologic structures. Geol. Soc. Amer. Bull. 48, 1459 – 1520.
Illies, J.H., 1981. Mechanism of graben formation. Tectonophysics 73, 249 – 266.
Jestin, F., Huchon, P., Gaulier, M., 1994. The Somalia plate and the East African Rift System: present-day kinematics. Geophys. J. Int.
116, 637 – 654.
Lezzar, K.E., Tiercelin, J.J., Le Turdu, C., Cohen, A.S., Reynolds, D.J., Le Gall, B., Scholz, C.A., 2002. Control of normal fault interaction on the distribution of major Neogene sedimentary depocenters, Lake Tanganyika, Eat African rift. Bull. Am.
Assoc. Pet. Geol. 86, 1027 – 1059.
Lopes Cardozo, G., Granet, M., 2003. Teleseismic investigations in the Southern Upper Rhine Graben. Geophys. Res. Abstr. 5 (EAE03-A-01967).
Manatschal, G., Froitzheim, N., Rubenach, M., Turrin, B.D., 2001.
The role of detachment faulting in the formation of an ocean- continent transition: insights from the Iberia Abyssal Plain. In:
Wilson, R.C.L., Whitmarsh, R.B., Taylor, B., Froitzheim, N.
(Eds.), Non-Volcanic Rifting of Continental Margins: a Compar- ison of Evidence from Land and Sea, Geol. Soc. London Spec.
Public, vol. 187, pp. 405 – 428.
McClay, K.R., White, M.J., 1995. Analogue modelling of orthogonal and oblique rifting. Mar. Pet. Geol. 12, 137 – 151.
McClay, K.R., Dooley, T., Whitehouse, P., Mills, M., 2002. 4-D evolution of rift systems: insights from scaled physical models.
Am. Assoc. Pet. Geol. 86, 935 – 959.
McConnell, R.B., 1972. Geological development of the rift system of eastern Africa. Geol. Soc. Amer. Bull. 83, 2549 – 2572.
Meier, L., Eisbacher, G.H., 1991. Crustal kinematics and deep structures of the northern Rhine Graben, Germany. Tectonics 10, 621 – 630.
Michon, L., 2001. Dynamique de l’extension continentale-application au rift ouest-europe´en par l’e´tude de la province du Massif Central. Me´m. Geosci. 99 263 pp.
Michon, L., Merle, O., 2000. Crustal structures of the Rhinegraben and the Massif Central grabens: an experimental approach. Tec- tonics 19, 896 – 904.
Michon, L., Merle, O., 2003. Mode of lithospheric extension: con- ceptual models from analogue modelling. Tectonics 22, 1028, doi:10.1029/2002TC001435.
Michon, L., Van Balen, R.T., Merle, O., Pagnier, H., 2003. The Cenozoic evolution of the Roer Valley rift system integrated at a European scale. Tectonophysics 367, 101 – 126.
Morange, A., Heritier, F., Villemin, J., 1971. Contribution de l’ex- ploration pe´trolie`re a` la connaissance structurale et se´dimenatire de la Limagne, dans le Massif Central. Symposium J. Jung, Plein Air Service, Clermont-Ferrand, pp. 295-308.
Morley, C.K., 1988. Variable extension in Lake Tanganyika. Tecton- ics 7, 785 – 802.
Morley, C.K., 1999. How successful are analogue models in addres- sing the influence of pre-existing fabrics on rift structures. J.
Struct. Geol. 21, 1267 – 1274.
Ramberg, H., 1981. Gravity, Deformation and the Earth’s Crust.
Academic Press, London. 452 pp.
Rey, P., Burg, J.P., Casey, M., 1997. The Scandinavian Caledonides and their relationship to the Variscan belt. In: Burg, J.P., Ford, M.
(Eds.), Orogeny Through Time, Spec. Publ. Geol. Soc. London, vol. 121, pp. 179 – 200.
Ring, U., 1994. The influence of preexisting structure on the evolu- tion of the Cenozoic Malawi rift (East African rift system).
Tectonics 13, 313 – 326.
Ring, U., Betzler, C., 1995. Geology of the Malawi Rift: kinematic and tectonosedimentary background to the Chiwondo Beds, north- ern Malawi. J. Hum. Evol. 28, 7 – 21.
Rosendahl, B.R., Kilembe, E., Kaczmarick, K., 1992. Comparison of the Tanganyika, Malawi, Rukwa and Turkana Rift zones from analyses of seismic reflection data. Tectonophysics 213, 235 – 256.
Schumacher, M.E., 2002. Upper Rhine Graben: role of preexisting structures during rift evolution. Tectonics 21, 6.1 – 6.17.
Seranne, M., 1999. The Gulf of Lion continental margin (NW Med- iterranean) revisited by IBS: an overview. In: Durand, B., Jolivet, L., Horvath, F., Seranne, M. (Eds.), The Mediterranean Basins:
Tertiary Extension within the Alpine Orogen, Spec. Publ. Geol.
Soc. London, vol. 156, pp. 15 – 36.
Tapponnier, P., 1977. Evolution tectonique du syste`me alpin en Me´diterrane´e: poinc¸onnement et e´crasement rigide-plastique.
Bull. Soc. Ge´ol. Fr. 19, 437 – 460.
Tron, V., Brun, J.P., 1991. Experiments on oblique rifting in brittle–
ductile systems. Tectonophysics 188, 71 – 84.
Villemin, T., Alvarez, F., Angelier, J., 1986. The Rhinegraben : extension, subsidence and shoulder uplift. Tectonophysics 128, 47 – 59.
Wickert, F., Eisbacher, G.H., 1988. Two-sided Variscan thrust tecton- ics in the Vosges Mountains, north-eastern France. Geodin. Acta 2, 101 – 120.