HAL Id: hal-00193677
https://hal.archives-ouvertes.fr/hal-00193677
Submitted on 4 Dec 2007
HAL is a multi-disciplinary open access archive for the deposit and dissemination of sci- entific research documents, whether they are pub- lished or not. The documents may come from
L’archive ouverte pluridisciplinaire HAL, est destinée au dépôt et à la diffusion de documents scientifiques de niveau recherche, publiés ou non, émanant des établissements d’enseignement et de
Investigation of dioctahedral smectite hydration properties by modeling of X-ray diffraction profiles:
Influence of layer charge and charge location
Eric Ferrage, Bruno Lanson, Boris.A. Sakharov, Nicolas Geoffroy, Emmanuel Jacquot, Victor.A. Drits
To cite this version:
Eric Ferrage, Bruno Lanson, Boris.A. Sakharov, Nicolas Geoffroy, Emmanuel Jacquot, et al.. Investi- gation of dioctahedral smectite hydration properties by modeling of X-ray diffraction profiles: Influence of layer charge and charge location. American Mineralogist, Mineralogical Society of America, 2007, 92, pp.1731-1743. �10.2138/am.2007.2273�. �hal-00193677�
Investigation of dioctahedral smectite hydration properties by modeling of X-ray diffraction profiles: Influence of layer charge and charge location
1 2 3 4 5 6 7 8 9 10 11 12 13 14 15 16
Revision 3
Eric Ferrage1,2*, Bruno Lanson1, Boris A. Sakharov3, Nicolas Geoffroy1, Emmanuel Jacquot2, and Victor A. Drits3
1 Environmental Geochemistry Group, LGIT – Maison des Géosciences, Joseph Fourier University – CNRS, BP53, 38041 Grenoble cedex 9, France
2 ANDRA, Parc de la Croix Blanche, 1-7 rue Jean Monnet, 92298 Châtenay-Malabry cedex, France
3 Geological Institute, Russian Academy of Sciences, 7 Pyzhevsky street, 109017 Moscow, Russia
17 18
*Corresponding author: e.ferrage@nhm.ac.uk . Present address: The Natural History Museum, Department of Mineralogy, Cromwell Road, London SW7 5BD, United Kingdom.
ABSTRACT
19 20 21 22 23 24 25 26 27 28 29 30 31 32 33 34 35 36 37 38 39 40 41 42
Hydration of the <1 µm size fraction of a high-charge montmorillonite (Clay Minerals Society Source Clay SAz-1), and of low- and high-charge beidellites (Source Clays SbId-1 and SbCa-1, respectively) was studied by modeling of X-ray diffraction patterns recorded under controlled relative humidity (RH) for Sr- and/or Ca-saturated specimens. The influence of layer charge and charge location on smectite hydration was studied. Distribution of layers with different hydration states (dehydrated – 0W, monohydrated – 1W, bi-hydrated – 2W, or tri-hydrated – 3W) within smectite crystals often leads to two distinct contributions to the X-ray diffraction pattern, each contribution having different layer types randomly interstratified. Structure models are more heterogeneous for beidellite than for montmorillonite. For beidellite, two distinct populations of particles with different coherent scattering domain sizes account for the heterogeneity. Increased hydration heterogeneity in beidellite originates also from the presence of 0W (non-expandable) and of 1W layers under high relative humidity (RH) conditions. Similarly, after ethylene-glycol (EG) solvation, some beidellite layers incorporate only one plane of EG molecules whereas homogeneous swelling was observed for montmorillonite with the systematic presence of two planes of EG molecules.
For montmorillonite and beidellite, the increase of layer charge shifts the 2W-to-1W and the 1W-to-0W transitions towards lower RH values. For all samples, layer thickness of 0W, 1W, and 2W layer types was similar to that determined for low-charge SWy-1 montmorillonite (Source Clay SWy-1), and no change of layer thickness was observed as a function of the amount or of the location of layer charge. Layer thickness however increased with increasing RH conditions.
INTRODUCTION
43 44 45 46 47 48 49 50 51 52 53 54 55 56 57 58 59 60 61 62 63 64 65 66 67
Bentonite, a rock containing mostly smectite, is a promising buffer material for engineered barriers for nuclear waste disposal. This potential results from its mechanical self- healing ability, its low hydraulic conductivity, and its high sorption capacity. This combination is expected to prevent or delay possible radionuclide migration. However, the properties of smectite can be altered by storage-induced conditions such as the thermal pulse resulting from the waste package. By analogy with burial diagenesis of clayey sediments (Weaver 1960; Hower and Mowatt 1966; Burst 1969; Shutov et al. 1969; Perry and Hower 1972; Hower et al. 1976; among many others), smectite is expected to transform to illite by way of intermediate interstratified structures with increasing temperature. This transition was originally conceived as following smectite dehydration (Burst 1969; Shutov et al. 1969; Perry and Hower 1972). More recently, structural changes affecting smectite during the early stages of transformation have been shown to impact essentially the location and amount of layer charge (Sato et al. 1996; Drits et al. 1997; Beaufort et al. 2001), the initial smectite being a low-charge montmorillonite with dominant octahedral charge. Sato et al. (1996) proposed that beidellite-like layers (with dominant tetrahedral charge) initially form from montmorillonite in addition to an increase in layer charge. Then, these beidellite-like layers transform to illite.
This proposal is supported by hydrothermal alteration experiments conducted at moderate temperatures (<200°C, see Beaufort et al. 2001) leading to beidellitic layers from alteration of montmorillonite.
Modification of layer charge and charge location can possibly affect smectite hydration ability. Crystalline swelling of 2:1 phyllosilicates is controlled indeed by the balance between repulsive forces between adjacent 2:1 layers and attractive forces between hydrated interlayer cations and the negatively charged surface of 2:1 layers (Norrish 1954;
68 69 70 71 72 73 74 75 76 77 78 79 80 81 82 83 84 85 86 87 88 89 90 91
Van Olphen 1965; Kittrick 1969a, 1969b; Laird 1996, 1999). Thus crystalline swelling is characterized by the amount of layer charge and its location (octahedral vs. tetrahedral).
Different hydration states may correspond to 0, 1, 2 or 3 “planes” of H2O molecules in smectite interlayers. Intercalation of H2O planes produces a stepwise hydration depending on RH, easily detected by X-ray diffraction (XRD) by an increase in basal spacing (Nagelschmidt 1936; Bradley et al. 1937; Mooney et al. 1952; Méring and Glaeser 1954;
Norrish 1954; Walker 1956; among others).
From these considerations, an increase in layer charge increases attractive forces between the hydrated interlayer cation and the 2:1 layers, thus decreasing interlayer thickness.
Charge location may affect smectite hydration from the charge under-saturation of oxygen atoms defining the basal surfaces of 2:1 layers. In montmorillonite-like layers, the charge under-saturation resulting from R2+-for-R3+ substitutions in the octahedral sheet is distributed among a large number of basal oxygen atoms which are thus weakly under-saturated. In contrast, when Al3+-for-Si4+ substitutions occur in tetrahedral sites the charge deficit is distributed by the three nearest neighbor basal oxygen atoms. These oxygen atoms are strongly under-saturated and produce strong attractive interactions with interlayer cations.
This strong local under-saturation is sometimes assumed to decrease layer hydration (e.g., Laird 1996, 1999). However, experimental results are not consistent with this expected influence of the size and location of layer charge on hydration behavior. For example, Sato et al. (1992) reported similar d(001) values for smectite with different layer-charge locations, and smaller d(001) values were not observed for smectite with higher layer charge.
Furthermore, Chiou and Rutherford (1997) and Michot et al. (2005) reported an increase in H2O content with increasing layer charge. Similar results were obtained by Laird (1999) who attributed the increased hydration to H2O adsorption on external surfaces of the crystallites.
92 93 94 95 96 97 98 99 100 101 102 103 104 105 106 107 108 109 110 111 112 113 114 115 116
This article complements Ferrage et al. (2005b), in which the hydration of low- charge montmorillonite was studied, and investigates the effect of the size and location of layer charge on smectite hydration. The hydration of three reference smectites, including high-charge montmorillonite, and low- and high-charge beidellites, is considered as a function of relative humidity after saturation by Ca2+ and Sr2+.
MATERIAL AND METHODS
Sample preparation
Smectites used here are montmorillonite and beidellite samples from the Source Clay Repository of The Clay Minerals Society. The high-charge montmorillonite (SAz-1) has a structural formula of: [(Al2.80 Fe3+0.20 Mg1.00)(Si7.86 Al0.14)O20(OH)4] M+1.14 (Jaynes and Bigham 1987). Compared to SWy-1 montmorillonite studied by Ferrage et al. (2005b), SAz-1 has more Mg2+-for-Al3+ octahedral substitutions and limited tetrahedral substitution.
Low-charge SbId-1 beidellite (Glen Silver Pit, DeLamare Mine, Idaho) has a structural formula of: [(Al3.77 Fe3+0.11 Mg0.21)(Si7.27 Al0.73)O20(OH)4] M+0.67 (Post et al. 1997).
High-charge SbCa-1 beidellite contains more Al3+-for-Si4+ tetrahedral substitutions with a structural formula: [(Al3.82 Fe3+0.18 Mg0.06)(Si6.80 Al1.20)O20(OH)4] M+1.07.
For all samples, size fractionation to < 1 µm was obtained by centrifugation. Then, ion exchange was achieved with 1 mol.L-1 aqueous solutions of CaCl2, for SAz-1 only, and SrCl2, with three steps of saturation followed by three washing steps, as described by Ferrage et al. (2005b). Resulting samples are hereafter referred to as Ca- and Sr-SAz-1, Sr-SbId-1 and Sr-SbCa-1.
X-ray diffraction and fitting strategy 117
118 119 120 121 122 123 124 125 126 127 128 129 130 131 132 133 134 135 136 137 138 139 140
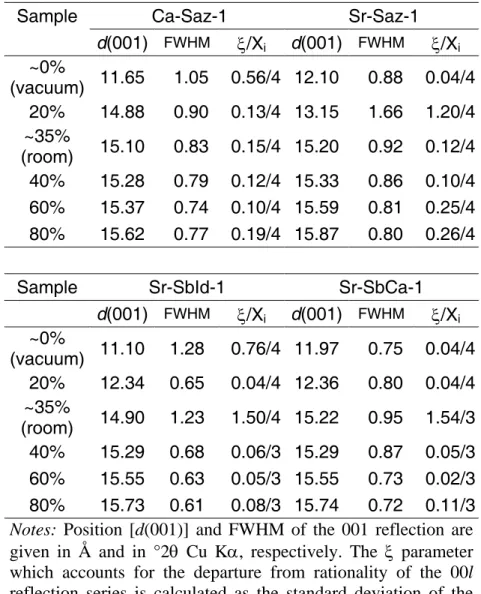
XRD patterns were recorded from oriented preparations of the air-dried homoionic samples. Full-width at half-maximum intensity (FWHM) of the 001 reflection and 00l reflection irrationality (ξ parameter) were measured to qualitatively estimate hydration heterogeneity (see Ferrage et al. 2005b). The ξ parameter is calculated as the standard deviation of the l×d(00l) values (in Å) for all measurable 00l reflections over the 2-50°2θ angular range, although some of these reflections may correspond to various interstratified structures. These values are listed in Table 1.
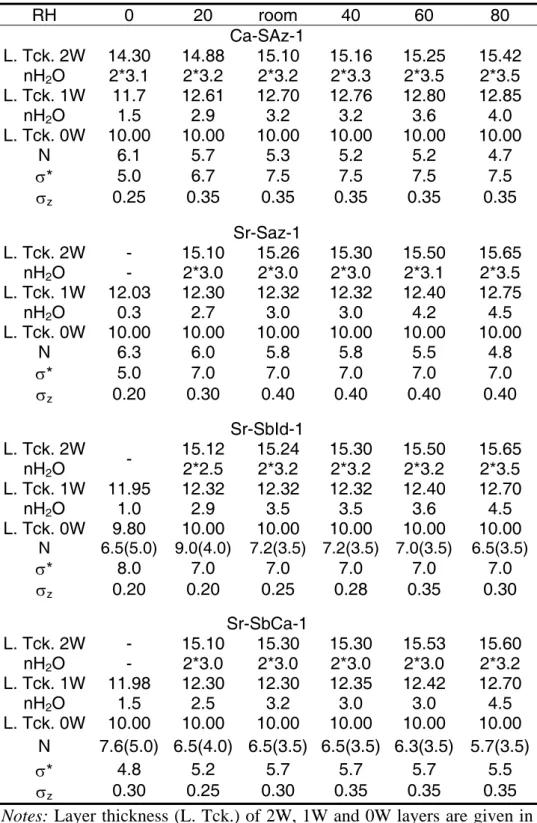
Models combine the XRD modeling algorithm of Drits and coworkers (Sakharov and Drits 1973; Drits and Sakharov 1976; Drits et al. 1997; Sakharov et al. 1999) with a trial-and- error approach to quantify hydration heterogeneity. The calculation of the XRD profile includes the mean number of layers (N) in the coherent scattering domains (CSDs), the absorption coefficient (μ*), and the preferred orientation of the sample (σ*). The z coordinates of dehydrated (0W), monohydrated (1W), and bi-hydrated (2W) layers, and crystal strains (σz) described by Ferrage et al. (2005b) were used. H2O molecules were distributed in 2W smectite as a unique plane of H2O molecules on each side of the central interlayer mid-plane, at ~1.20 Å along the c* axis. The number of interlayer H2O molecules in hydrated layers was considered a variable parameter.
The fitting strategy developed by Ferrage et al. (2005b) was used to model XRD patterns. A main structure, periodic along the c* axis where possible, was used to reproduce the experimental XRD pattern. If required, additional contributions to the diffracted intensity were introduced. These additional contributions are related to random interstratifications of two or three layer types (0W, 1W, 2W layers), which are hereafter referred to as
142 143 144 145 146 147 148 149 150 151 152 153 154 155 156 157 158 159 160 161 162 163 164 165 166
tri-hydrated layers (3W layers at 18.0-18.5 Å) were not observed, as transition from 2W-to- 3W smectite occurs for RH values of > 90% for Ca-exchanged smectites (Watanabe and Sato 1988). Up to four structures (periodic and/or interstratified) were used for very heterogeneous samples but these contributions are not necessarily related to distinct populations of crystals.
To minimize the number of adjustable parameters, layers of same hydration state present in different structures were assumed to have identical properties. Thus, for a given sample, each layer type (0W, 1W or 2W layers) was assigned a chemical composition (number of interlayer H2O molecules and cations, and chemical composition of the 2:1 layer), layer thickness, and atomic coordinates for each component. Similarly, a unique value of σ* and σz parameters was assigned for each RH value. Each parameter was allowed to vary with RH. For beidellite, models consider either (1) a unique CSD size for all interstratified structures at a given RH, or (2) the physical mixture of two or more interstratified structures with different CSD sizes (see below).
Hereafter, indices “00l” and “001, 002, …” are used to identify experimental diffraction maxima, although these maxima correspond to interstratified and not to periodic structures.
RESULTS
Qualitative description of experimental patterns
Ca- and Sr-saturated montmorillonite SAz-1. At 0% RH, Ca-SAz-1 (Fig. 1a) exhibits a 001 reflection at ~11.65 Å, a position intermediate between 0W and 1W smectite, indicating hydration heterogeneity. Accordingly, the 001 reflection is broad (FWHM = 1.05°, Table 1) and a large value of ξ parameter was obtained (0.56 Å, Table 1). In contrast, the
167 168 169 170 171 172 173 174 175 176 177 178 179 180 181 182 183 184 185 186 187 188 189 190
pattern of Sr-SAz-1 recorded at 0% RH (Fig. 1b) is typical of 1W smectite (001 at ~12.10 Å) with a low value of ξ (0.04 Å), but note the high FWHM of the 001 reflection (0.88°). At 20%
RH, the d(001) value of Sr-SAz-1 at ~13.1 Å is intermediate between 2W and 1W smectites.
Experimental diffraction maxima are poorly defined, and peaks at ~6.1 Å (002 reflection of 1W smectite), and at ~5.1 Å (003 reflection of 2W smectite) are observed (Fig. 1b). For this sample, high values are obtained for ξ and FWHM of the 001 reflection (1.20 Å and 1.66°, respectively). In contrast, Ca-SAz-1 exhibits a 001 reflection at ~14.9 Å and well-defined diffraction maxima of 2W smectite. Over the 35-80% RH range, XRD patterns for Ca- and Sr-SAz-1 are similar, and correspond to dominant 2W smectite (Ca: d(001) = 15.1-15.6 Å; Sr:
d(001) = 15.2-15.9 Å – Table 1). Note that the 002 reflection is poorly defined whatever the
RH (Figs. 1a, 1b).
Sr-saturated beidellite (SbId-1 and SbCa-1). XRD patterns of both beidellites samples include reflections at ~7.2 and ~3.6 Å (K on Figs. 1c, 1d), produced by a minor contribution from kaolinite-group minerals. At 0% RH, Sr-SbId-1 displays poorly defined diffraction maxima with a 001 reflection at ~11.10 Å and large values of FWHM and ξ (1.28°
and 0.76 Å, respectively, Fig. 1c, Table 1). In contrast, Sr-SbCa-1 shows well-defined diffraction maxima corresponding to 1W smectite (d(001) ~12.0 Å) and low values for FWHM of the 001 reflection and ξ (0.75° and 0.04 Å, respectively). At 20% RH, d(001) values at ~12.3-12.4 Å for both samples indicate a 1W smectite, along with low values for FWHM and ξ. At ambient RH, the d(001) values near 14.9 Å for Sr-SbId-1 and near 15.2 Å for Sr-SbCa-1 indicate dominant 2W smectite with well-defined diffraction maxima.
However, both XRD patterns present a high-angle shoulder of the 001 reflection and a peak at
~6.1 Å corresponding to 1W smectite (Figs. 1c, 1d), which increases ξ. From 40 to 80% RH, the peak at ~6.1 Å is absent and the high-angle shoulder of the 001 reflection decreases with
192 193 194 195 196 197 198 199 200 201 202 203 204 205 206 207 208 209 210 211 212 213 214 215 216
this RH range and low values of FWHM and ξ systematically indicate the dominance of 2W smectite. As for SAz-1, the 002 reflection of 2W smectite is poorly defined.
Note also the peaks at ~25 Å and ~22 Å for samples recorded over the 35-80% RH and 0-20% RH range, respectively. These peaks may be attributed to an ordered interstratified structure consisting of 2W and 0W and of 1W and 0W smectite, respectively (Figs. 1c, 1d).
For Sr-SbCa-1, these reflections are similar to those reported by Chipera and Bish (2001).
Modeling of X-ray diffraction profiles
Structure models providing optimum fits shown in Figure 1 are described schematically (relative proportion and composition of each structure) in Figure 2 as a function of RH. Structural parameters are listed in Table 2.
Ca- and Sr-SAz-1 montmorillonite. XRD patterns for Ca-SAz-1 and Sr-SAz-1 over the 0-80% RH range were fitted assuming two structures (Figs. 1a, 1b, 2a, 2b). Over the 20- 80% RH range for Ca-SAz-1 and the 35-80% RH range for Sr-SAz-1, the model consists of a main structure dominated by 2W smectite and of a second, heterogeneous, structure containing 0W, 1W, and 2W layers (Figs. 2a, 2b). 2W layers are systematically prevailing in the heterogeneous structure except for Sr-SAz-1 at 35% RH where 2W and 1W smectite are present in equal amounts (Figs. 2a, 2b). Relative abundance of the heterogeneous structure decreases with increasing RH. The proportion of 1W and 0W layers in the dominantly 2W structure decreases also with increasing RH. Both trends account for the sharpening and the increased intensity of the reflection at ~7.75 Å with increasing RH (Figs. 1a, 1b). At 20% RH, two contributions were used to fit the pattern of Sr-SAz-1, a near-periodic 1W smectite, and a heterogeneous structure containing 0W, 1W, and 2W layers. 1W and 2W layers prevail in the latter structure which accounts for the reflection at ~5.1 Å. The different compositions of the
217 218 219 220 221 222 223 224 225 226 227 228 229 230 231 232 233 234 235 236 237 238 239 240
two structures produce the broadening of the 001 reflection observed at this RH (1.66°, Table 1). At 0% RH, patterns of Ca-SAz-1 and Sr-SAz-1 were fitted assuming a main structure dominated by 1W smectite and a more heterogeneous structure dominated by 0W layers (Figs. 2a, 2b). The irrationality of 00l reflections for Ca-SAz-1 (ξ = 0.56 Å) is produced by the high amount of 0W layers in the main structure, in which 1W layers prevail, and by the strong contribution of the most heterogeneous structure.
With increasing RH, the layer thickness of 1W and 2W layers increases for both samples to accommodate the larger numbers of interlayer H2O molecules (Table 2), as reported by Ferrage et al. (2005b) for low-charge montmorillonite. Among other parameters, σ* was found nearly constant (6.7-7.5°) for all XRD patterns except for 0% RH, whereas N
and σz are steadily decreasing and increasing, respectively, with increasing RH.
Sr-SbId-1 and Sr-SbCa-1 beidellite. In the optimum structure model determined for Sr-SbId-1 and Sr-SbCa-1, interstratified structures can have different N values. In this case, the evolution of beidellite hydration results from the hydration properties of two particle populations with distinct N values. However, to minimize the number of adjustable parameters other parameters (layer chemical composition, layer thickness, σ*, σz, e.g.) are identical for all layer types, whatever the interstratified structure (Table 2).
At 60% and 80% RH, one particle population contains essentially 2W layers and accounts for the main features of the experimental patterns (Figs. 2c, 2d, 3). The second population is a very heterogeneous structure of small CSD size (3.5 layers, Table 2, Figs. 2c, 2d, 3), which produces the asymmetry of the 001 reflection at high angles and of the 005 reflection at low angles (Fig. 3). At 40% RH, a second interstratified structure with dominant 2W layers coexisting with 1W layers occurs with a large CSD size (30 and 40% of 1W layers for Sr-SbId-1 and Sr-SbCa-1, respectively, Figs. 2c, 2d). Structure models determined at 35%
242 243 244 245 246 247 248 249 250 251 252 253 254 255 256 257 258 259 260 261 262 263 264 265
structures were considered to reproduce patterns recorded at 20% and 0% RH. The first structure, with a large CSD size, is dominated by 1W smectite and accounts for the shape of the 001 reflection and for the position of other maxima. For Sr-SbId-1 at 0% RH, this structure incorporates significant proportions of 0W layers. The second structure, whose content does not depend on RH, has smaller CSD size and contains 1W and 0W layers, the proportion of 0W layers increasing with decreasing RH (Figs. 2c, 2d).
For both Sr-SbId-1 and Sr-SbCa-1 the amount of kaolinite-group minerals did not vary (~16% and ~10% for Sr-SbId-1 and Sr-SbCa-1, respectively, Figs. 2c, 2d). As observed for montmorillonite (this study and Ferrage et al. 2005b), layer thickness of 1W and 2W layers increased with increasing RH for Sr-SbId-1 (11.95-12.70 Å and 15.12-15.65 Å, respectively) and for Sr-SbCa-1 (11.98-12.70 Å and 15.10-15.60 Å, respectively). Among other parameters, σ* is nearly constant (7.0-8.0° and 4.8-5.5° for Sr-SbId-1 and Sr-SbCa-1, respectively). With increasing RH, σz increases whereas N decreases, except at 0% RH for Sr- SbId-1.
For beidellite, the low intensity reflection at ~25 Å over the 35-80% RH range may correspond to an ordered (Reichweit parameter R = 1 with maximum possible degree of order, R1-MPDO, see Drits and Tchoubar 1990) interstratified structure containing similar proportions of 0W and 2W layers (Figs. 1c, 1d, 5). Similarly, the reflection at ~22 Å observed over the 0-20% RH range may correspond to a R1-MPDO structure containing 1W and 0W layers in similar proportions. These features are discussed below.
Note that fits of similar quality were obtained for Sr-SbId-1 and Sr-SbCa-1 with structures models in which all contributions contain identical layers and have identical crystal parameters (N, σ*). However, modeling of XRD patterns obtained after ethylene-glycol (EG) solvation allows rejection of these alternative models (see below).
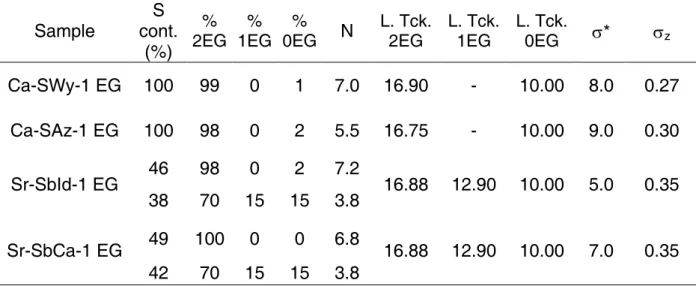
Modeling of X-ray diffraction profiles after EG solvation. XRD patterns obtained after EG solvation of Ca-saturated SWy-1 and SAz-1 and of Sr-saturated SbId-1 and SbCa-1 are compared to calculated profiles in Figure 4 and optimal structural parameters are listed in Table 3. For montmorillonite, the best model involves a unique structure of 2EG layers (with two planes of interlayer EG molecules), interstratified with non-expandable (0EG) layers at 1% and 2% in Ca-SWy-1 and Ca-SAz-1, respectively. These contents of collapsed layers are similar to samples at 80% RH. No 1EG layers were found.
266 267 268 269 270 271 272 273 274 275 276 277 278 279 280 281 282 283 284 285 286 287 288 289
XRD patterns of EG-solvated beidellite were only simulated assuming two interstratified structures (Table 3). One (with a large CSD size) contains mostly 2EG layers, and the second is more heterogeneous and contains 15% of 1EG and 15% of 0EG layers.
After EG solvation, the relative abundance of the most heterogeneous structure (with a low CSD size) is similar to that of the population with a low CSD size in the air-dried state (38%
and 42% for Sr-SbId-1 and Sr-SbCa-1, respectively). This similarity strongly supports the presence of different particle populations. Combining the two contributions leads to a 2EG:1EG:0EG ratio of 86:7:7 for both Sr-SbId-1 and Sr-SbCa-1.
DISCUSSION
Structure models
Montmorillonite. Structure models determined for SAz-1 (this study) and SWy-1 (Ferrage et al. 2005b) are consistent for a given interlayer cation. From ambient to 80% RH these models include two interstratified structures dominated by 2W layers, one being more heterogeneous with the presence of the three layer types (0W, 1W and 2W layers – Figs. 2a,
290 291 292 293 294 295 296 297 298 299 300 301 302 303 304 305 306 307 308 309 310 311 312 313 314
2b). Hydration of high-charge SAz-1 montmorillonite is thus homogeneous, with a slight segregation of 2W layers.
Beidellite. Complex structure models with numerous contributions were required to reproduce experimental XRD patterns for beidellites. At ambient RH, the large high-angle asymmetry of the 001 reflection and reflections from both 1W- and 2W-dominated structures required a greater number of contributions. In addition, structure models include a heterogeneous structure containing high proportions of 0W and 1W layers even at 80% RH.
This contribution has a small CSD size (3.5-5.0 layers), and its relative proportion is constant (~40-45% for Sr-SbId-1 and Sr-SbCa-1) through the RH range investigated.
The particle population with a large CSD size (population A in Figure 6) exhibits transitions to higher hydration states with increasing RH: from 0W/1W to 1W and further to 2W (for Sr-SbId-1) and from 1W to 2W (for Sr-SbCa-1). In both samples, the 1W-2W transition occurs through intermediate 2W/1W interstratified structures. The particle population with a small CSD size (population B in Figure 6) maintains its heterogeneous layer composition throughout the RH range despite the steady increase of the 2W layer proportion, at the expense of 0W layers, with increasing RH.
Impurities in beidellites. For Sr-SbId-1 and Sr-SbCa-1, low-intensity reflections occur at ~25 Å and ~22 Å (for the 35-80% and 0-20% RH ranges, respectively). The ~25 Å peak possibly corresponds to a R1-MPDO structure containing similar proportions of 0W and 2W layers (Figs. 1c, 1d). Similarly, the reflection at ~22 Å possibly corresponds to a R1- MPDO structure containing 1W and 0W layers in similar proportions. The positions of these reflections do not significantly change after EG solvation (Fig. 4). The relative proportion of this structure was determined for Sr-SbId at 80% RH (Fig. 5). For Figure 5a, the optimum model (Fig. 2c) is shown for 2θ < 5°. Note that the computed “background” intensity is inconsistent with the measured one. Over this region, a R1-MPDO structure containing 0W
315 316 317 318 319 320 321 322 323 324 325 326 327 328 329 330 331 332 333 334 335 336 337 338
and 2W layers exhibits two main reflections at ~25.0 Å and ~12.5 Å, the latter being much weaker. To reproduce the shoulder at ~25 Å, the R1-MPDO structure should contribute ~3%
of the total diffracted intensity (Fig. 5b), without affecting the relative proportion of the different layer types. Consequently, the low-angle reflections may be related to impurities.
Origin of hydration heterogeneity in beidellite. Two populations of particles were found in beidellites (Fig. 6). Hydration of population A, with a large CSD size, is homogeneous with dominant 1W and 2W layer types except for Sr-SbId-1 at 0 and 35% RH and for Sr-SbCa-1 at 35 and 40% RH. In contrast, hydration of population B, with a small CSD size, is heterogeneous over the entire RH range for each beidellite. This observation suggests that layer charge and charge location in population B are likely similar for both samples. In addition, populations A and B probably differ in both samples from the heterogeneity of their layer charge distributions.
Because of population B, the number of 0W and 1W layers is relatively high at 80%
RH for Sr-SbId-1 (14% and 10%, respectively) and Sr-SbCa-1 (9% and 14%, respectively). In contrast, at this high RH value, Sr-SWy-1 contains 2% of 0W and 1W layers and Sr-SAz-1 shows 1% and 4% of 0W and 1W layers, respectively. Hydration heterogeneity persists at high relative humidity only for beidellite. XRD profile modeling of EG-solvated samples confirmed the observed hydration/swelling heterogeneity of beidellite (global 2EG:1EG:0EG ratio of 86:7:7 for both Sr-SbId-1 and Sr-SbCa-1), although EG solvation is known to induce homogeneous configuration of smectite interlayers (2EG layers). Collapsed layers after EG solvation are considered as non-expandable layers. Although the nature of 1EG layers is unknown, they may possess a higher layer charge than smectite (vermiculite-type layers).
Note that 0EG and 1EG layers are present mostly in the most heterogeneous structure.
Finally, 2EG layers in populations A and B probably have a similar layer charge, which is
339 340 341 342 343 344 345 346 347 348 349 350 351 352 353 354 355 356 357 358 359 360 361 362 363
close to that determined for the whole sample [~0.67 and ~1.07 per O20(OH)4, respectively for SbId-1 and SbCa-1] because of the high proportion of 2EG layers in EG-solvated samples.
The near complete swelling of layers following EG solvation is observed for montmorillonite and for population A of beidellite. In contrast, for beidellite increasing layer charge from the mean layer charge may produce vermiculite-like layers, discrete illite layers or irreversibly collapsed K-beidellite layers when potassium is present as assumed for SbId-1 (Post et al. 1997). However, heterogeneous structures where layers have different hydration/swelling abilities is not a priori characteristic of smectite with layer charge originating in the tetrahedra, although such interstratified structures probably occur more frequently in beidellite compared to montmorillonite. Further study is required to assess the systematic (?) presence of highly heterogeneous structures in natural beidellite.
Influence of layer charge and charge location on hydration of 2:1 phyllosilicates
The influence of layer charge on smectite hydration (Fig. 7) was derived from the relative proportions of layer types as a function of RH. For all samples, XRD patterns were recorded from RH = 35 (ambient) to 80% RH in adsorption conditions and then at 20% and 0% RH in desorption conditions. Relative proportions of the different layer types were considered for montmorillonite and beidellite along the adsorption (40%, 60% and 80% RH) and desorption (35%, 20% and 0% RH) pathways. See Ferrage et al. (2005b) for data on Ca- and Sr-saturated SWy-1 montmorillonite.
Smectite. 0W layer content is equal or slightly lower for Ca-SAz-1 compared to Ca- SWy-1 and gradually decreases with increasing RH (Fig. 7a). In adsorption conditions, 2W layers dominate the two samples, 1W layers being more abundant for Ca-SWy-1. At 20% RH along the desorption pathway, Ca-SAz-1 is dominated by 2W layers (~75%) whereas Ca- SWy-1 contains similar amounts of 2W and 1W layers. This difference indicates that the 2W-
364 365 366 367 368 369 370 371 372 373 374 375 376 377 378 379 380 381 382 383 384 385 386 387
to-1W transition occurs at lower RH values for Ca-SAz-1 compared to Ca-SWy-1. At 0% RH, the two samples have similar contents of 2W and 1W layers, 0W layers being more abundant in Ca-SAz-1.
The proportion of 0W layers is similar in Sr-SAz-1 and Sr-SWy-1 (Fig. 7b) except at 0% RH, where Sr-SAz-1 is dominated by 1W layers and Sr-SWy-1 is mostly dehydrated. At 20% RH, Sr-SWy-1 and Sr-SAz-1 are dominated by 1W layers, with a greater number of 0W and 2W layers in the latter. At 35% RH, 2W layers prevail in Sr-SAz-1 and Sr-SWy-1 is mostly monohydrated. These observations are similar to those made on Ca-saturated specimens: 2W-to-1W and 1W-to-0W transitions are shifted towards lower RH values with increasing layer charge. Along the adsorption pathway, the number of 2W layers in Sr-SAz-1 is similar (at 40 and 80% RH) or slightly lower (at 60% RH) compared to Sr-SWy-1, in contrast to Ca-saturated samples.
Proportions of layer types are plotted in Figures 7c, 7d as a function of RH for beidellite. Figure 7c describes the overall behavior of the two populations of particles, and the behavior of population A is given in Figure 7d. Note that for population A, the layer charge is likely homogeneous and close to that of the entire sample. Along the adsorption pathway and at 20% RH, hydration of Sr-SbCa-1 and Sr-SbId-1 is similar for the entire sample and for population A crystallites (Figs. 7c, 7d). At 35% RH, Sr-SbCa-1 contains more 2W layers than Sr-SbId-1 indicating that a greater layer charge shifts the 2W-to-1W transition to lower RH values, similar to montmorillonite. At 0% RH, the different composition of the two samples produces a shift of the 1W-to-0W transition to lower RH values with increasing layer charge.
Hydration of montmorillonite and beidellite is compared in Figures 7e, 7f for a given layer charge [~0.7 per O20(OH)4 for SWy-1 and SbId-1, and ~1.1 per O20(OH)4 for SAz-1 and SbCa-1]. Hydration of SbCa-1 and SbId-1 may be estimated from their population A. For a
389 390 391 392 393 394 395 396 397 398 399 400 401 402 403 404 405 406 407 408 409 410 411 412 413
RH. Additional studies on beidellite with a more homogenous layer charge distribution are required to confirm this observation.
Expandable 2:1 phyllosilicates. In summary, it appears that a greater layer charge increases the stability of 1W and 2W layers towards lower RH values, at least upon H2O desorption, for montmorillonite and beidellite. This trend probably occurs owing to the greater number of interlayer cations when increasing layer charge. Whatever the size and location of layer charge, smectite interlayer thickness and the number of interlayer H2O molecules are about constant for a given interlayer cation and RH value (see below). As the number of interlayer H2O molecules is systematically higher than necessary to provide octahedral coordination to interlayer cations, the hydration sphere of a given cation is constant for smectite. The amount of H2O molecules coordinating interlayer cations thus increases at the expense of H2O molecules not directly bound to these cations when layer charge increases. As the 2W-to-1W transition occurs as interlayer H2O molecules not coordinated to interlayer cations are still present in 2W smectite (Ferrage et al. 2007) the higher density of hydrated interlayer cations is likely responsible for the observed increased stability of most hydrated layers towards lower RH values when layer charge is increased.
Although consistent with the molecular simulations performed by Smith et al.(2004), this increased stability may appear as contradicting the conventional wisdom that high-charge layers are less hydrated than low-charge layers (Laird 1999). The inverse relationship between hydration (as measured from layer basal distance) and layer charge is the foundation to differentiate smectite from vermiculite (Brindley 1980; Calle and Suquet 1988; Suquet and Pezerat 1988). In addition, trioctahedral vermiculite basal distance decreases with increasing layer charge (Calle and Suquet 1988; Suquet and Pezerat 1988), and the stability of less hydrated layers is increased towards higher RH values when layer charge is increased (Suquet and Pezerat 1987). The present results can be reconciled with the hydration behaviors
414 415 416 417 418 419 420 421 422 423 424 425 426 427 428 429 430 431 432 433 434 435 436 437
attributed to smectite and vermiculite. In the present study, stability of hydrated smectite layers increases with increasing layer charge and is thus maximum at the upper limit of smectite layer charge [0.5-0.6 net charge per O10(OH)2]. This charge threshold is the lower charge limit for vermiculite, whose hydration differs from that of smectite most likely because of the prevalence of attractive forces between interlayer cations and the 2:1 layer above this threshold. The total number of interlayer H2O molecules is however slightly higher for vermiculite (6.6-7.6 per O20(OH)4 – Le Renard and Mamy 1971; Calle et al. 1977; Slade et al.
1985) than for smectite (5.0-7.0 per O20(OH)4 – This study and Laird 1999; Ferrage et al.
2005b). The reduced layer basal distance is thus not due to a reduced hydration of vermiculite compared to smectite but more likely linked to the reorganization of H2O molecules coordinated to interlayer cations. Consistently, increasing the layer charge favors ordering in the interlayer cation distribution (Drits 1987), and the layer-charge boundary between smectite and vermiculite may correspond to the onset of this ordering. This boundary may also coincide with the formation of a two-dimensional network of H2O molecules in the interlayer above a certain density of H2O molecules bound to interlayer cations. This hypothesis is supported by the reduced breadth of the H2O molecule distributions determined for saponite when layer charge is increased (Ferrage et al. 2005a).
In addition, the contrast of layer basal distance observed between dioctahedral smectite (this study) and trioctahedral vermiculite (Suquet and Pezerat 1987; Calle and Suquet 1988; Suquet and Pezerat 1988) is possibly enhanced by the ordered distribution of isomorphic substitutions in vermiculite, which probably favors interlayer species ordering.
Trioctahedral vermiculites are indeed isostructural to trioctahedral micas from which they differ essentially by the hydrophilic character of their interlayer cations. Layer stacking, which is commonly ordered for trioctahedral vermiculite in contrast to dioctahedral smectite,
439 440 441 442 443 444 445 446 447 448 449 450 451 452 453 454 455 456 457 458 459 460 461 462
enhance the observed contrast of layer basal distance. The influence of charge location (tetrahedral vs. octahedral) is probably minor, at least for dioctahedral smectite, because montmorillonite and beidellite display an equal hydration behavior as a function of layer charge (Fig. 7). Finally, note that 3W layer appears not to follow the same trend, in that their stability is more restricted when layer charge of dioctahedral smectite is increased (Laird et al.
1995). However, in this study layer-charge increase may be influenced by the relative proportion of tetrahedral substitutions.
Interlayer thickness (IT). The ratio of IT to cation radius is plotted in Figure 8 as a function of RH. Similar values were obtained for all samples, in agreement with Sato et al.
(1992) who reported similar d(001)-values for hydrated smectite regardless of the size and location of layer charge. This observation is consistent with the similar H2O content determined at a given RH for each sample (Table 2) but is counter to the frequently assumed decrease of layer thickness with increasing layer charge (Laird 1996).
For Ca-saturated samples, the greater number of 2W layers and the associated increase of H2O content in SAz-1 compared to SWy-1 (Figs. 7a, 7b) is consistent with the water-adsorption isotherms reported by Chiou and Rutherford (1997) for the same samples.
By comparing the water-adsorption isotherms for SAz-1 and SWy-1, these authors showed that the interlayer H2O uptake increases with the layer charge. Laird (1999) criticized these results as counter to the frequently accepted decrease of hydration ability with an increase in smectite layer charge. However, Laird (1999) reported similar d(001) values for smectites with different charges and attributed the increased number of adsorbed H2O to the adsorption on clay external surfaces. The results in the present article account only for interlayer H2O and support the conclusions of Chiou and Rutherford (1997), in agreement with Michot et al.
(2005). The water-vapor adsorption isotherms obtained by the latter authors on synthetic
463 464 465 466 467 468 469 470 471 472 473 474 475 476 477 478 479 480 481 482 483 484 485 486
saponite showed an increased number of adsorbed H2O molecules with increasing layer charge over the entire RH range.
Dehydrated layer thickness
Except for Sr-SbId-1 at 0% RH, the thickness of 0W layers was equal to 10.0 Å for Ca- and Sr-SAz-1 and for Sr-saturated beidellite (Table 2). Similar results were obtained for SWy-1 when saturated with Mg2+, Ca2+ and Sr2+, whereas the thickness of 0W layers was lower for samples saturated with monovalent cations at 9.6 Å, 9.6 Å and 10.0 Å for Na+, Li+ and K+, respectively (Ferrage et al. 2005b). The latter values are consistent with those expected for dehydrated specimens. Because of the smaller radii of divalent cations, layer thickness values of ~10.0 Å appear high. Ferrage et al. (2005b) observed an increase of σz in samples dominated by 2W layers compared to those dominated by 1W layers. This increase was attributed to the greater interlayer thickness, and thus to the weaker electrostatic interactions between the 2:1 layer and interlayer cations in 2W layers. Similar results were obtained for SAz-1 and beidellite samples (Table 2). However, σz does not decrease further in 0W layers, except for Na-SWy-1 at 0% RH (Ferrage et al. 2005b), probably because of residual H2O in the “dehydrated” layers. Monovalent interlayer cations ensures a local compensation of under-saturated basal oxygen atoms, whereas charge compensation is more diffuse with long-distance interactions, possibly through H-bonds, for divalent cations. The latter configuration would probably favor the presence of H2O molecules linked with under- saturated oxygen atoms via H-bonds. The presence of additional H2O molecules is favored also by the higher ionic potential (valency/ionic radius) of divalent cations. The coulombic radius of a H2O molecule (r = 1.4-1.5 Å – Williams et al. 1994; Li and Nussinov 1998) is
488 489 490 491 492 493 494 495 496 497 498 499 500 501 502 503 504 505 506 507 508 509 510 511 512
the 10.0 Å layer thickness determined here and by Ferrage et al. (2005b) for 0W layers in samples saturated with divalent cations. Residual H2O molecules would produce an increased σz, as observed, because of the different radii of H2O molecules and interlayer cations. Local charge compensation by monovalent interlayer cations reduces the number of interlayer H2O molecules, as observed for K- and Na-saturated SWy-1 montmorillonites (Ferrage et al.
2005b). For these two samples, the thickness of 0W layers is similar to that expected for totally dehydrated layers at 9.6 Å and 10.0 Å for Na- and K-saturated SWy-1 at 0% RH, respectively (Ferrage et al. 2005b). For Li-saturated SWy-1 montmorillonite, the layer thickness is higher than expected and σz is higher at 0% compared to other RH conditions, possibly from the presence of residual H2O molecules in 0W layers, in agreement with the high affinity of Li+ for H2O.
Limitations for qualitative indicators of smectite hydration heterogeneity
For SWy-1, Ferrage et al. (2005b) related smectite-hydration heterogeneity to the qualitative ξ parameter describing the irrationality of 00l reflection positions. Values of ξ were < 0.4 Å when a specific layer type accounted for > 70% of the layer content. However, this relation is mostly due to the specific distribution of the different layer types in SWy-1.
The different layer types are indeed randomly distributed in SWy-1, with possibly a slight tendency to segregation. In this case, diffraction features follow Méring’s principle (Méring 1949) and an increased heterogeneity broadens the 001 reflection and increases the positional irrationality of 00l reflections.
The relative proportion of the prevailing layer type is plotted in Figure 9 as a function of ξ for SAz-1, SbId-1 and Sr-SbCa-1. For beidellite, results are given after subtraction of the kaolinite contribution and normalization of the smectite layer abundances to
513 514 515 516 517 518 519 520 521 522 523 524 525 526 527 528 529 530 531 532 533 534 535
100%. As reported by Ferrage et al. (2005b), for most samples, ξ is > 0.4 Å when the dominant layer type accounts for ~70% or less of the layer content. However, note the
“outliers” in Figure 9. For instance, Sr-SbId-1 and Sr-SbCa-1 at 40% RH do not follow the trend and most beidellites have low ξ values relative to their hydration heterogeneity (Figs.
2c, 2d, 9). Furthermore, Sr-SbCa-1 at 35% and 40% RH have similar contents of the dominant layer type of 55-59% of 2W layers (Fig. 9) but different ξ of 1.54 Å and 0.05 Å at 35% and 40% RH, respectively (Table 1). Similarly, Sr-SAz-1 contains 66 % of 1W layers at 20% RH and 69% of 2W layers at 35% RH but has different ξ values of 1.20 Å and 0.12 Å, respectively (Table 1).
These discrepancies are related to the inability of qualitative parameters, such as ξ, to describe hydration heterogeneity in complex systems. The ξ parameter depends not only on the proportion of layer types but also on their distribution within crystallites. Similarly, the FWHM of the 001 reflection is influenced by CSD size and hydration heterogeneity. Some discrepancies observed for beidellite are explained from the experimental XRD patterns (Figs.
1c, 1d). At 40% RH, the 001 reflection of Sr-SbId-1 and Sr-SbCa-1 exhibits a sharp maximum and a pronounced high-angle shoulder. This shoulder corresponds to a heterogeneous structure with a small CSD size (Figs. 2c, 2d), which does not contribute much intensity to the XRD pattern. In contrast, the essentially 2W structure contributes more to the 001 reflection (position and shape) and most of the diffraction features, including ξ. Similarly, the FWHM of the 001 reflection is not influenced by the high-angle shoulders, although they stem from hydration heterogeneity (Figs. 1c, 1d, 2c, 2d).
The high value of ξ for Sr-SbCa-1 at 35% RH results mainly from the reflection at
~6.1 Å, which results from an interstratified structure dominated by 1W layers in a sample
538 539 540 541 542 543 544 545 546 547 548 549 550 551 552 553 554 555 556 557 558 559 560
sample at 40% RH. The inability of the qualitative parameters, such as ξ, to provide a realistic description of the beidellite hydration is a result of the segregation of the different layer types, leading to the numerous structures involved in the models and their compositions.
Finally, Sr-SAz-1 recorded at 20% and 35% RH have nearly equal contents of 1W and 2W layers, respectively, but different ξ values. For each sample, structure models consist of a main interstratified structure, dominated by 1W layers at 20% RH and 2W layers at 35%
RH, whereas a minor, more heterogeneous structure contains 1W and 2W layers in nearly equal proportions. The different values of ξ obtained for these two samples (Fig. 9) result from the different structure factors for 1W and 2W layers. The structure factor is larger for 2W layers than for 1W layers over the low-angle region, and if they exist equally in an interstratified structure, then related reflections are near the position expected for a periodic 2W smectite (e.g., peak at ~5.1 Å for Sr-SAz-1 at 20% RH, see Fig. 1b). The coexistence of a 1W/2W interstratified structure with a near periodic 2W smectite does not produce significant peak shift or broadening, and low value of ξ is determined at 35% RH. In contrast, the coexistence of a 1W/2W interstratified structure with a near periodic 1W structure produces a greater ξ value, as measured at 20% RH.
The above discussion outlines the limitations of qualitative parameters to describe hydration heterogeneity. These criteria are relevant only when layer types are randomly distributed (Ferrage et al. 2005b). Relevance of the qualitative parameters may be enhanced by careful analysis of position, intensity and profile of basal reflections over the entire 2- 50°2θ CuKα angular range. However, quantitative analysis of smectite hydration as obtained from XRD pattern modeling is preferred if the distribution of layer types is to be determined.
ACKNOWLEDGMENTS
561 562 563 564 565 566 567 568 569 570 571
This paper is a result of a PhD thesis granted by Andra (French National Agency for Nuclear Waste Disposal). Andra is thanked for permission to publish this manuscript and for financial support. BL acknowledges financial support from the CNRS/PICS709 program, and from the CNRS/SdU “postes rouges” fellowships granted to BAS. VAD and BAS are grateful to the Russian Science Foundation for financial support. We thank Laurent Michot (LEM, Nancy, France) for the fruitful discussions about smectite hydration, and John Yang (Univ.
Missouri) for providing the structural formula of SbCa-1. The manuscript was much improved by the constructive reviews of Javier Cuadros and David Laird, and by the editorial assistance of AE Steve Guggenheim.
REFERENCES
572 573 574 575 576 577 578 579 580 581 582 583 584 585 586 587 588 589 590 591 592 593 594 595
Beaufort, D., Berger, G., Lacharpagne, J.-C., and Meunier, A. (2001) An experimental alteration of montmorillonite to a di + trioctahedral smectite assemblage at 100 and 200°C. Clay Minerals, 36, 211-225.
Bradley, W.F., Grim, R.E., and Clark, G.F. (1937) A study of the behavior of montmorillonite upon wetting. Zeitschrift Kristallographie, 97, 216-222.
Brindley, G.W. (1980) Order-disorder in clay mineral structures. In G.W. Brindley, and G.
Brown, Eds., Crystal Structures of Clay Minerals and their X-ray Identification, p.
125-195. Mineralogical Society, London.
Burst, J.F. (1969) Diagenesis of Gulf Coast clayey sediments and its possible relation to petroleum migration. American Association of Petroleum Geologists Bulletin, 53, 73- 93.
Calle, C. de la, Pezerat, H., and Gasperin, M. (1977) Poblèmes d'ordre-désordre dans les vermiculites - Structure du minéral calcique hydraté à deux couches. Journal de physique, 38, C7 128-133.
Calle, C. de la and Suquet, H. (1988) Vermiculite. In S.W. Bailey, Ed., Hydrous phyllosilicates (exclusive of micas), 19, p. 455-496. Mineralogical Society of America, Chantilly, Va.
Chiou, C.T. and Rutherford, W. (1997) Effects of exchanged cation and layer charge on the sorption of water and egme vapors on montmorillonite clays. Clays & Clay Minerals, 45, 867-880.
Chipera, S.J. and Bish, D.L. (2001) Baseline studies of the clay minerals society source clays:
Powder X-ray diffraction analyses. Clays & Clay Minerals, 49, 398-409.
596 597 598 599 600 601 602 603 604 605 606 607 608 609 610 611 612 613 614 615 616 617 618 619
Drits, V.A. (1987) Electron diffraction and high-resolution electron microscopy of mineral structures, 304 p. Springer Verlag, Berlin Heidelberg.
Drits, V.A., Lindgreen, H., Sakharov, B.A., and Salyn, A.S. (1997) Sequential structure transformation of illite-smectite-vermiculite during diagenesis of Upper Jurassic shales, North Sea. Clay Minerals, 33, 351-371.
Drits, V.A. and Sakharov, B.A. (1976) X-Ray structure analysis of mixed-layer minerals, 256 p. Dokl. Akad. Nauk SSSR, Moscow.
Drits, V.A. and Tchoubar, C. (1990) X-ray diffraction by disordered lamellar structures:
Theory and applications to microdivided silicates and carbons, 371 p. Springer- Verlag, Berlin.
Ferrage, E., Kirk, C.A., Cressey, G., and Cuadros, J. (2007) Dehydration of Ca- montmorillonite at the crystal scale. Part 1. Structure evolution. American Mineralogist, in press.
Ferrage, E., Lanson, B., Malikova, N., Plançon, A., Sakharov, B.A., and Drits, V.A. (2005a) New insights on the distribution of interlayer water in bi-hydrated smectite from X-ray diffraction profile modeling of 00l reflections. Chemistry of Materials, 17, 3499-3512.
Ferrage, E., Lanson, B., Sakharov, B.A., and Drits, V.A. (2005b) Investigation of smectite hydration properties by modeling of X-ray diffraction profiles. Part 1. Montmorillonite hydration properties. American Mineralogist, 90, 1358-1374.
Hower, J., Eslinger, E.V., Hower, M.E., and Perry, E.A. (1976) Mechanism of burial metamorphism of argillaceous sediments: 1. Mineralogical and chemical evidence.
Geological Society of America Bulletin, 87, 725-737.
Hower, J. and Mowatt, T.C. (1966) The mineralogy of illites and mixed-layer illite/montmorillonites. American Mineralogist, 51, 825-854.
620 621 622 623 624 625 626 627 628 629 630 631 632 633 634 635 636 637 638 639 640 641 642
Jaynes, W.F. and Bigham, J.M. (1987) Charge reduction, octahedral charge, and lithium retention in heated, Li-saturated smectites. Clays & Clay Minerals, 35, 440-448.
Kittrick, J.A. (1969a) Interlayer forces in montmorillonite and vermiculite. Soil Science Society of America Journal, 33, 217-222.
_____. (1969b) Quantitative evaluation of the strong-force model for expansion and contraction of vermiculite. Soil Science Society of America Journal, 33, 222-225.
Laird, D.A. (1996) Model for crystalline swelling of 2:1 phyllosilicates. Clays & Clay Minerals, 44, 553-559.
_____. (1999) Layer charge influences on the hydration of expandable 2:1 phyllosilicates.
Clays & Clay Minerals, 47, 630-636.
Laird, D.A., Shang, C., and Thompson, M.L. (1995) Hysteresis in crystalline swelling of smectites. Journal of Colloid and Interface Science, 171, 240-245.
Le Renard, J. and Mamy, J. (1971) Etude de la structure des phases hydratées des phlogopites altérées par des projections de fourier monodimensionnelles. Bulletin du Groupe Français des Argiles, 23, 119-127.
Li, A.-J. and Nussinov, R. (1998) A set of van der Waals and Coulombic radii of protein atoms for molecular and solvent-accessible surface calculation, packing evaluation, and docking. Proteins: Structure, function, and genetics, 32, 111-127.
Méring, J. (1949) L'interférence des rayons-X dans les systèmes à stratification désordonnée.
Acta Crystallographica, 2, 371-377.
Méring, J. and Glaeser, R. (1954) Sur le rôle de la valence des cations échangeables dans la montmorillonite. Bulletin de la Société Francaise de Minéralogie et Cristallographie, 77, 519-530.
643 644 645 646 647 648 649 650 651 652 653 654 655 656 657 658 659 660 661 662 663 664 665
Michot, L.J., Bihannic, I., Pelletier, M., Rinnert, E., and Robert, J.L. (2005) Hydration and swelling of synthetic Na-saponites: influence of layer charge. American Mineralogist, 90, 166-172.
Mooney, R.W., Keenan, A.G., and Wood, L.A. (1952) Adsorption of water by
montmorillonite. II. Effect of exchangeable ions and lattice swelling as measured by X-ray diffraction. Journal of American Chemical Society, 74, 1371-1374.
Nagelschmidt, G. (1936) On the lattice shrinkage and structure of montmorillonite. Zeitschrift Kristallographie, 93, 481-487.
Norrish, K. (1954) The swelling of montmorillonite. Discussions of the Faraday society, 18, 120-133.
Perry, E.A. and Hower, J. (1972) Late-stage dehydration in deeply buried pelitic sediments.
American Association of Petroleum Geologists Bulletin, 56, 2013-2021.
Post, J.L., Cupp, B.L., and Madsen, F.T. (1997) Beidellite and associated clays from the DeLamar mine and Florida Mountain area, Idaho. Clays & Clay Minerals, 45, 240- 250.
Sakharov, B.A. and Drits, V.A. (1973) Mixed-layer kaolinte-montmorillonite: a comparison observed and calculated diffraction patterns. Clays & Clay Minerals, 21, 15-17.
Sakharov, B.A., Lindgreen, H., Salyn, A., and Drits, V.A. (1999) Determination of illite- smectite structures using multispecimen X-Ray diffraction profile fitting. Clays &
Clay Minerals, 47, 555-566.
Sato, T., Murakami, T., and Watanabe, T. (1996) Change in layer charge of smectites and smectite layers in illite/smectite during diagenetic alteration. Clays & Clay Minerals, 44, 460-469.
666 667 668 669 670 671 672 673 674 675 676 677 678 679 680 681 682 683 684 685 686 687 688 689 690
Sato, T., Watanabe, T., and Otsuka, R. (1992) Effects of layer charge, charge location, and energy change on expansion properties of dioctahedral smectites. Clays & Clay Minerals, 40, 103-113.
Shannon, R.D. (1976) Revised effective ionic radii and systematic studies of interatomic distances in halides and chalcogenides. Acta Crystallographica, A 32, 751-767.
Shutov, V.D., Drits, V.A., and Sakharov, B.A. (1969) On the mechanism of a
postsedimentary transformation of montmorillonite into hydromica. In L. Heller, Ed.
International Clay Conference, 1, p. 523-531. Israel University Press, Jerusalem, Tokyo, Japan.
Slade, P.G., Stone, P.A., and Radoslovitch, E.W. (1985) Interlayer structures of the two-layer hydrates of Na- and Ca-vermiculites. Clays & Clay Minerals, 33, 51-61.
Smith, D.E., Wang, Y., and Whitley, H.D. (2004) Molecular simulations of hydration and swelling in clay minerals. Fluid Phase Equilibria, 222-223, 189-194.
Suquet, H. and Pezerat, H. (1987) Parameters influencing layer stacking types in saponite and vermiculite: A review. Clays & Clay Minerals, 35, 353-362.
_____. (1988) Comments on the classification of trioctahedral 2:1 phyllosilicates. Clays and Clay Minerals, 36, 184-186.
Van Olphen, H. (1965) Thermodynamics of interlayer adsorption of water in clays. Journal of Colloid Science, 20, 822-837.
Walker, G.F. (1956) The mechanism of dehydration of Mg-vermiculite. Clays & Clay Minerals, 4, 101-115.
Watanabe, T. and Sato, T. (1988) Expansion characteristics of montmorillonite and saponite under various relative humidity conditions. Clay Science, 7, 129-138.
Weaver, C.E. (1960) Possible uses of clay minerals in search for oil. American Association of Petroleum Geologists Bulletin, 44, 1505-1518.
691 692
Williams, M.A., Goodfellow, J.M., and Thornnton, J.M. (1994) Buried water and internal cavities in monomeric proteins. Protein Science, 3, 1224-1235.
FIGURE CAPTIONS
693 694 695 696 697 698 699 700 701 702 703 704 705 706 707 708 709 710 711 712 713 714 715 716
Figure 1. Comparison between experimental and calculated XRD patterns as a function of RH. Experimental and calculated optimal XRD patterns are shown as crosses and as solid lines, respectively. a) Ca-SAz-1. b) Sr-SAz-1. c) Sr-SbId-1. d) Sr-SbCa-1. For all samples, the gray bar indicates a modified scale factor for the high-angle region.
Figure 2. Structure models obtained from XRD profiles modeling as a function of RH.
Relative proportions, expressed in wt%, of the interstratified contributions are plotted on the y-axis whereas their compositions (relative proportions of the different layer types) are plotted on the x-axis. Light gray, dark gray and solid bars represent 0W, 1W, and 2W layers, respectively. Open bars with a dashed outline represent a kaolinite contribution.
Figure 3. Illustration of the contributions to the calculated profiles for Sr-SbId-1 at 80% RH.
Intensities in the high-angle region (10-50°2θ) are scaled by ×10 compared to the low-angle region (4-10°2θ). Maxima corresponding to kaolinite-group minerals are labeled Kaol.
Figure 4. Comparison between calculated and experimental XRD patterns obtained after ethylene-glycol solvation of the samples. Experimental and calculated optimal XRD patterns are shown as crosses and as solid lines, respectively. For all samples, the gray bar indicates a modified scale factor for the high-angle region.
Figure 5. Contribution of an ordered R1-MPDO (see text for details) interstratified structure to the XRD pattern of Sr-SbId-1 recorded at 80% RH. a) Experimental and calculated pattern as in Figure 1c. XRD profile corresponding to the R1-MPDO structure is shown as open circles. b) Optimal fit to the experimental data including the contribution of a R1-MPDO structure to the diffracted intensity (see text for details). The gray bar indicates a modified scale factor for the high-angle region.
717 718 719 720 721 722 723 724 725 726 727 728 729 730 731 732 733 734 735 736 737 738 739 740
Figure 6. Evolution of relative abundance of the layer types as function of RH for each population of particles, including all interstratified structures contributing to that population, considered for beidellites. a) Sr-SbId-1. b) Sr-SbCa-1. Triangles, diamonds, and squares represent 0W, 1W and 2W layers.
Figure 7. Evolution of relative abundance of layer types as a function of RH. a) Ca-SAz-1 and Ca-SWy-1. b) Sr-SAz-1 and Sr-SWy-1. c) Sr-SbId-1 and Sr-SbCa-1. d) Population A of Sr-SbId-1 and Sr-SbCa-1. e) Sr-SAz-1 and population A of Sr- SbCa-1. f) Sr-SWy-1 and population A of Sr-SbId-1. Triangles, diamonds, and squares represent 0W, 1W and 2W layers. Data for Ca- and Sr-SWy-1 are those reported by Ferrage et al. (2005b). XRD data collection was perfomed in adsorption conditions at 40, 60, and 80% RH, and in desorption conditions at 0, 20, 35% RH.
Figure 8. Evolution of layer thickness of hydrated layers as a function of RH for all samples including SWy-1 (Ferrage et al. 2005b). Interlayer thickness (IT) is represented by the ratio IT:ionic radius. IT is calculated as the basal distance d(001) minus the thickness of the 2:1 layer (6.54 Å). Linear regression lines are plotted for each cation
742 743 744 745 746 747
Figure 9. Relative proportion of the major layer type derived from XRD profile modeling as a function of departure from rationality parameter ξ. Values of these two parameters (70% and 0.4 Å, respectively) limiting the “homogeneous” hydration are shown as dotted lines. Open symbols indicate samples with ξ parameters > 0.4 Å.
TABLES
Table 1: Basal-reflection qualitative parameters (position, width and rationality) as a function of relative humidity.
Sample Ca-Saz-1 Sr-Saz-1
d(001) FWHM ξ/Xi d(001) FWHM ξ/Xi
(vacuum) ~0% 11.65 1.05 0.56/4 12.10 0.88 0.04/4 20% 14.88 0.90 0.13/4 13.15 1.66 1.20/4
~35%
(room) 15.10 0.83 0.15/4 15.20 0.92 0.12/4 40% 15.28 0.79 0.12/4 15.33 0.86 0.10/4 60% 15.37 0.74 0.10/4 15.59 0.81 0.25/4 80% 15.62 0.77 0.19/4 15.87 0.80 0.26/4 Sample Sr-SbId-1 Sr-SbCa-1
d(001) FWHM ξ/Xi d(001) FWHM ξ/Xi
~0%
(vacuum) 11.10 1.28 0.76/4 11.97 0.75 0.04/4 20% 12.34 0.65 0.04/4 12.36 0.80 0.04/4
~35%
(room) 14.90 1.23 1.50/4 15.22 0.95 1.54/3 40% 15.29 0.68 0.06/3 15.29 0.87 0.05/3 60% 15.55 0.63 0.05/3 15.55 0.73 0.02/3 80% 15.73 0.61 0.08/3 15.74 0.72 0.11/3 Notes: Position [d(001)] and FWHM of the 001 reflection are given in Å and in °2θ Cu Kα, respectively. The ξ parameter which accounts for the departure from rationality of the 00l reflection series is calculated as the standard deviation of the l×d(00l) values (in Å) for the Xi measurable reflections over the 2-50°2θ Cu Kα angular range.
Table 2: Optimum structural parameters used for the simulation of XRD profiles.
RH 0 20 room 40 60 80
Ca-SAz-1 L. Tck. 2W
nH2O 14.30
2*3.1 14.88
2*3.2 15.10
2*3.2 15.16
2*3.3 15.25
2*3.5 15.42 2*3.5 L. Tck. 1W
nH2O 11.7
1.5 12.61
2.9 12.70
3.2 12.76
3.2 12.80
3.6 12.85 4.0 L. Tck. 0W 10.00 10.00 10.00 10.00 10.00 10.00
N 6.1 5.7 5.3 5.2 5.2 4.7
σ* 5.0 6.7 7.5 7.5 7.5 7.5
σz 0.25 0.35 0.35 0.35 0.35 0.35 Sr-Saz-1
L. Tck. 2W nH2O -
- 15.10
2*3.0 15.26
2*3.0 15.30
2*3.0 15.50
2*3.1 15.65 2*3.5 L. Tck. 1W
nH2O 12.03
0.3 12.30
2.7 12.32
3.0 12.32
3.0 12.40
4.2 12.75 4.5 L. Tck. 0W 10.00 10.00 10.00 10.00 10.00 10.00
N 6.3 6.0 5.8 5.8 5.5 4.8
σ* 5.0 7.0 7.0 7.0 7.0 7.0
σz 0.20 0.30 0.40 0.40 0.40 0.40 Sr-SbId-1
L. Tck. 2W
nH2O - 15.12
2*2.5 15.24
2*3.2 15.30
2*3.2 15.50
2*3.2 15.65 2*3.5 L. Tck. 1W
nH2O 11.95
1.0 12.32
2.9 12.32
3.5 12.32
3.5 12.40
3.6 12.70 4.5 L. Tck. 0W 9.80 10.00 10.00 10.00 10.00 10.00
N 6.5(5.0) 9.0(4.0) 7.2(3.5) 7.2(3.5) 7.0(3.5) 6.5(3.5)
σ* 8.0 7.0 7.0 7.0 7.0 7.0
σz 0.20 0.20 0.25 0.28 0.35 0.30 Sr-SbCa-1
L. Tck. 2W nH2O -
- 15.10
2*3.0 15.30
2*3.0 15.30
2*3.0 15.53
2*3.0 15.60 2*3.2 L. Tck. 1W
nH2O 11.98
1.5 12.30
2.5 12.30
3.2 12.35
3.0 12.42
3.0 12.70 4.5 L. Tck. 0W 10.00 10.00 10.00 10.00 10.00 10.00
N 7.6(5.0) 6.5(4.0) 6.5(3.5) 6.5(3.5) 6.3(3.5) 5.7(3.5)
σ* 4.8 5.2 5.7 5.7 5.7 5.5
σz 0.30 0.25 0.30 0.35 0.35 0.35 Notes: Layer thickness (L. Tck.) of 2W, 1W and 0W layers are given in Å. For hydrated layers, the number of interlayer H2O molecules (nH2O) is indicated per O20(OH)4. N is the mean number of layers in the coherent scattering domains, orientation parameter (σ*) and layer thickness variability parameter (σz) are given in ° and in Å, respectively. N values in parentheses correspond to the second population of particles (see text for details).
Table 3. Optimum structural parameters used for the simulation of XRD profiles obtained after EG solvation.
Sample S cont.
(%)
% 2EG %
1EG %
0EG N L. Tck. 2EG L. Tck. 1EG L. Tck. 0EG σ* σz
Ca-SWy-1 EG 100 99 0 1 7.0 16.90 - 10.00 8.0 0.27 Ca-SAz-1 EG 100 98 0 2 5.5 16.75 - 10.00 9.0 0.30
46 98 0 2 7.2 Sr-SbId-1 EG
38 70 15 15 3.8 16.88 12.90 10.00 5.0 0.35 49 100 0 0 6.8
Sr-SbCa-1 EG
42 70 15 15 3.8
16.88 12.90 10.00 7.0 0.35 Notes: Calculated XRD patterns include the contributions of one or two interstratified structures (S). Layer thickness (L. Tck.) of 2EG, 1EG, and 0EG layers are given in Å. N, σ*, and σz as in Table 2. For beidellites the contribution of kaolinite-group minerals should be added to fit the experimental XRD pattern.
2 7 12 17 22 27 32 37 42 47 vacuum (~0%)
20%
room (~35%)
40%
60%
80%
vacuum (~0%) 20%
room (~35%) 40%
60%80%
×3
×5
×3
×5
Ca-Saz-1
R
p4.14%
2.69%
1.71%
2.36%
3.60%
3.27%
RH
15.6Å
11.65Å
3.05Å
a
14.9Å
2θ CuKα
2 7 12 17 22 27 32 37 42 47 vacuum (~0%)
20%
room (~35%)
40%
60%
80%
vacuum (~0%) 20%
room (~35%) 40%
60%
80%
×3
×5
×3
×5
Sr-Saz-1
R
p3.67%
3.24%
3.43%
3.21%
2.44%
3.23%
RH
15.9Å
12.1Å
3.10Å
b
13.15Å
15.2Å
6.1Å
5.1Å
2 7 12 17 22 27 32 37 42 47 vacuum (~0%)
20%
room (~35%)
40%
60%
80%
vacuum (~0%) 20%
room (~35%) 40%
60%80%
×2
×5
×2
×5
Sr-SbId-1 Model II
R
p5.74%
4.13%
3.65%
2.85%
2.75%
2.72%
RH
15.7Å
11.1Å
3.10Å
c
12.3Å
2θ CuKα
14.9Å
6.11Å
5.16Å
K K
2 7 12 17 22 27 32 37 42 47 vacuum (~0%)
20%
room (~35%)
40%
60%
80%
vacuum (~0%) 20%
room (~35%) 40%
60%
80%
�