HAL Id: inria-00439284
https://hal.inria.fr/inria-00439284v2
Submitted on 11 Apr 2011
HAL is a multi-disciplinary open access archive for the deposit and dissemination of sci- entific research documents, whether they are pub- lished or not. The documents may come from teaching and research institutions in France or abroad, or from public or private research centers.
L’archive ouverte pluridisciplinaire HAL, est destinée au dépôt et à la diffusion de documents scientifiques de niveau recherche, publiés ou non, émanant des établissements d’enseignement et de recherche français ou étrangers, des laboratoires publics ou privés.
Joost van de Weijer, Cordelia Schmid, Jakob Verbeek, Diane Larlus
To cite this version:
Joost van de Weijer, Cordelia Schmid, Jakob Verbeek, Diane Larlus. Learning Color Names for Real- World Applications. IEEE Transactions on Image Processing, Institute of Electrical and Electronics Engineers, 2009, 18 (7), pp.1512-1523. �10.1109/TIP.2009.2019809�. �inria-00439284v2�
Learning Color Names for Real-World Applications
Joost van de Weijer, Cordelia Schmid, Jakob Verbeek, Diane Larlus
Abstract
Color names are required in real-world applications such as image retrieval and image annotation.
Traditionally, they are learned from a collection of labelled color chips. These color chips are labelled with color names within a well-defined experimental setup by human test subjects. However naming colors in real-world images differs significantly from this experimental setting. In this paper, we in- vestigate how color names learned from color chips compare to color names learned from real-world images. To avoid hand labelling real-world images with color names we use Google Image to collect a data set. Due to limitations of Google Image this data set contains a substantial quantity of wrongly labelled data. We propose several variants of the PLSA model to learn color names from this noisy data.
Experimental results show that color names learned from real-world images significantly outperform color names learned from labelled color chips for both image retrieval and image annotation.
I. INTRODUCTION
Within a computer vision context color naming is the action of assigning linguistic color labels to image pixels. We use color names routinely and seemingly without effort to describe the world around us. They have been primarily studied in the fields of visual psychology, anthropology and linguistics [1]. In computer vision color names are used in the context of image retrieval. A user might query an image search engine for ”red cars”. The system recognizes the color name ”red”, and orders the retrieved results on ”car” based on their resemblance to the human usage of ”red’.
Furthermore, knowledge of visual attributes can be used to assist object recognition methods. For example, for an image annotated with the text ”Orange stapler on table”, knowledge of the color name orange would greatly simplify the task of discovering where (or what) the stapler is. Color names are further applicable in automatic content labelling of images, colorblind assistance, and linguistic human-computer interaction [2].
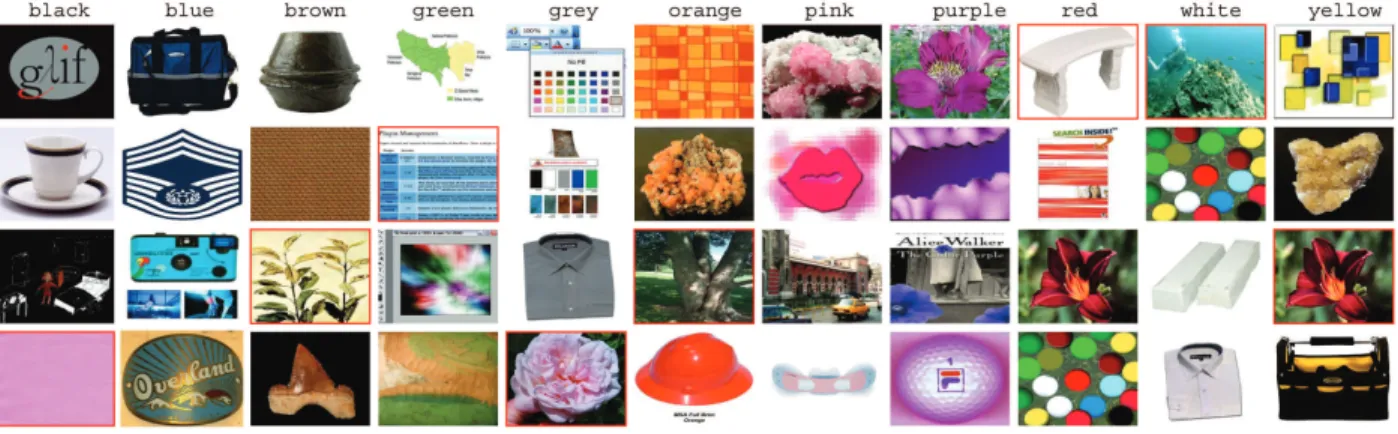
Fig. 1. Google-retrieved examples for color names. The red bounding boxes indicate false positives. An image can be retrieved with various color names, such as the flower image which appears in the red and the yellow set.
One of the most influential works in color naming is the linguistic study of Berlin and Kay [3]
on basic color terms. They are defined as those color names in a language which are applied to diverse classes of objects, whose meaning is not subsumable under one of the other basic color terms, and which are used consistently and with consensus by most speakers of the language.
Subjects of different languages where asked to identify prototypes (best examples) of the color names on a board with 329 color chips. Basic color names were found to be shared between languages. However the number of basic terms varies from two in some Aboriginal languages to twelve in Russian. In this paper, we use the eleven basic color terms of the English language:
black, blue, brown, grey, green, orange, pink, purple, red, white, and yellow.
To use color naming in computer vision requires a mapping between RGB values and color names. Generally this mapping is inferred from a labelled set [4], [5], [6], [7], [8], [9], [10].
Multiple test subjects are asked to label hundreds of color chips within a well-defined experi- mental setup. The colors are to be chosen from a preselected set of color names (predominantly the set of 11 basic color terms [6], [8], [9], [10] ). From this labelled set of color chips the mapping from RGB values to color names is derived. Throughout the paper we will refer to this methodology of color naming aschip-based color naming. Several of these papers have reported results of applying chip-based color names on real-world images [11], [6], [7], [8], [9], [12].
Although we do not wish to cast doubt on the usefulness of chip-based color naming within the linguistic and color science fields, we do question to what extent the labelling of isolated color
chips resembles color naming in the real-world. Color naming chips under ideal lighting on a color neutral background greatly differs from the challenge of color naming in images coming from real-world applications without a neutral reference color and with physical variations such as shading effects and different light sources. In this paper, we do not aim to improve color naming of isolated color patches, but instead investigate the use of color names in images from real-world applications. More precisely, with image data from real-world applications we refer to images which can be taken under varying illuminants, with interreflections, coming from unknown cameras, colored shadows, compression artifacts, aberrations in acquisition, unknown camera and camera settings, etc. The majority of the image data in computer vision belongs to this category: even in the cases that camera information is available and the images are uncompressed, the physical setting of the acquisition are often difficult to recover, due to unknown illuminant colors, unidentified shadows, view-point changes, and interreflections.
To obtain a large data set of real-world images with color names we propose to use Google Image search (see Fig. 1). We retrieve 250 images for each of the 11 color names. These images contain a large variety of appearances of the queried color name. E.g. the query ”red” will contain images with red objects, taken under varying physical variations, such as different illuminants, shadows, and specularities. The images are taken with different cameras and stored with various compression methods. The large variety of this training set suits our goal of learning color names for real-world images well, since we want to apply our color naming method on uncalibrated images taken under varying physical settings. Furthermore, a system based on Google image has the advantage that it is flexible with respect to variations in the color name set. Chip-based methods are known to be inflexible with respect to the set of color names, since adding for example new color names such as beige, violet or olive, would in principal imply to redo the human labelling for all patches.
The use of image search engines to avoid hand labelling was pioneered by Fergus et al. [13]
within the context of object category learning. The use of internet to obtain color name labels has been examined by Beretta and Moroney [14][15]. They ask users to label patches with the ”best possible color name”. The collected color names are used to compile an online color thesaurus, and they evaluate the color names on frequency of usage. The difference with the approach applied in this paper is twofold. Firstly, we use already labelled images as found by Google image, and therefore do not require users labelling images. Secondly, their approach aims to
correctly label image patches with color names, whereas the goal of this paper is to label colors in real-world images.
Retrieved images from Google search are known to contain many false positives. To learn color names from such a noisy dataset, we propose to use Probabilistic Latent Semantic Analysis (PLSA), a generative model introduced by Hofmann [16] for document analysis. One of the earliest works that uses generative models to learn the relation between images and words is that by Barnard et al. [17], where Latent Dirichlet Allocation (LDA) was used to learn relations between keywords and image regions. The original work which was limited to nouns was later extended to also include adjectives by Yanai and Barnard [18]. They compute the ”visualness”
of adjectives, based on the entropy between adjectives and image features. The work shows, among other adjectives, results for color names: several of these are correctly found to be visual, however the authors also report failure for others. Contrary to this work, we start from the prior-knowledge that color names are ”visual” and that they should be learned from the color distributions (and not for example from texture features), with the aim to improve the quality of the learned color names. We model RGB values (words) in images (documents) with mixtures of color names (topics), where mixing weights may differ per image, but the topics are shared among all images. In conclusion, by learning color names from real-world images, we aim to derive color names which are applicable on challenging real-world images typical for computer vision applications. In addition, since its knowledge on color names is derived from an image search engine, the method can easily vary the set of color names.
This paper is organized as follows. In Section II, the color name data sets used for training and testing are presented. In Section III, our approach for learning color names from images is described. In Section IV, experimental results are given, and Section V concludes the paper.
II. COLORNAMEDATA SETS
For the purpose of learning color names from real-world images, we require a set of color name labelled real-world images. Furthermore, to evaluate the proposed method a hand-labelled set of images is necessary. We briefly describe the data sets below together with three chip-based color name sets.
Google color name set: Google image search uses the image filename and surrounding web page text to retrieve the images. As color names we choose the 11 basic color names as indicated
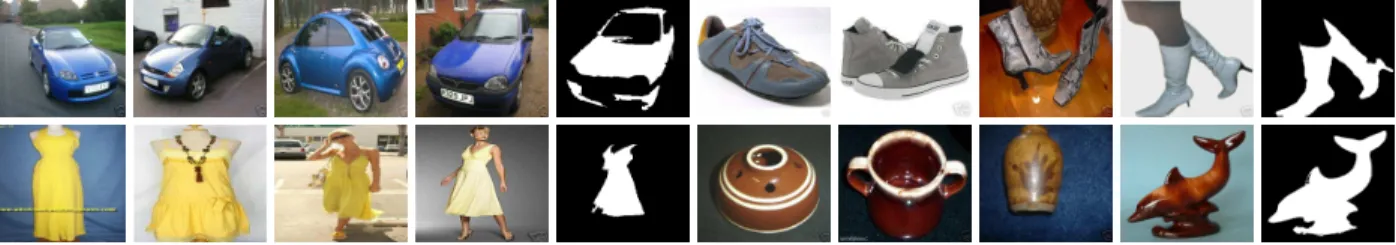
Fig. 2. Examples for the four classes of the Ebay data: blue cars, grey shoes, yellow dresses, and brown pottery. For all images masks with the area corresponding to the color name are hand segmented. One example segmentation per category is given.
in the study of Berlin and Kay [3]. We used Google Image to retrieve 250 images for each of the 11 color names. For the actual search we added the term ”color”, hence for red the query is
”red+color”. Examples for the 11 color names are given in Fig. 1. Almost 20 % of the images are false positives, i.e., images which do not contain the color of the query. We call this data set to be weakly labelled since the image labels are global, meaning that no information to which particular region of the image the label refers is available. Furthermore, in many cases only a small portion, as little as a few percent of the pixels, represents the color label. Our goal is to learn a color naming system based on the raw results of Google image, i.e., we used both true and false positives.
Ebay color name set: To test the color names a human-labelled set of object images is required.
We used images from the auction website Ebay. Users labelled their objects with a description of the object in text, often including a color name. We selected four categories of objects: cars, shoes, dresses, and pottery (see Fig. 2). For each object category 121 images where collected, 12 for each color name. The final set is split in a test set of 440 images, and a validation set of 88 images. The images contain several challenges. The reflection properties of the objects differ from matt reflection of dresses to highly specular surfaces of cars and pottery. Furthermore, it comprises both indoor and outdoor scenes. For all images we hand-segmented the object areas which correspond to the color name. In the remainder of the article when referring to Ebay images, only the hand segmented part of the images is meant, and the background is discarded. This data set together with the hand-segmented masks are made available online at http://lear.inrialpes.fr/data.
Chip-based color name sets: In the experimental section we compare our method to three
chip-based approaches. The chip-based methods resemble in that the color naming is performed in a controlled environment, where humans label individual color chips (CC) placed on a color neutral (grey) background under a known white light source.
• CC-I: dataset with 387 color named chips of Benavente et al. [8]. The chips are classified into the 11 basic color terms by 10 subjects. If desired the color patch could be assigned to multiple color names. Consequently every patch is represented by its sRGB values (standard default color space) and a probability distribution over the color names.
• CC-II: data set of 267 color named Munsell-coordinate-specified chips [19] developed by the U.S. National Bureau of Standards (NBS). The appointed color names are taken from the ISCC-NBS dictionary, which describes lightness, saturation and hue of the color. Examples are very dark red and pale yellowish pink. Similarly as Griffin [5], we reduce the set of color names to the 11 basic color terms by only taking the primary designator into account (indicated in bold above). Eleven violets were assigned to purple and six olives to green.
Next, the munsell coordinates are converted to sRGB. In contrast to the other two sets each color chip is assigned to a single color name.
• CC-III: dataset of 1014 color chips assembled by Menegaz et al. [9][10]. The sampling is based on the OSA-UCS color space [20] which is a perceptually uniform space. In [10], it is noted that the applicability of the original set (containing 424 samples) is limited due to the absence of samples in saturated colors. This shortcoming was overcome by the addition of 590 samples in the saturated color regions. Six subjects were asked to label the color chips with a distribution over the eleven basic color terms.
Preprocessing: The Google data set contains of weakly labelled data, meaning that we only have a image-wide label indicating that a part of the pixels in the image can be described by the color name of the label. To remove some of the pixels which are not likely indicated by the image label, we remove the background from Google images by iteratively removing pixels which have the same color as the border. Furthermore, since the color label often refers to an object in the center of the image, we crop the image to be 70% of its original width and height.
Both of these preprocessing steps were found to improve results.
The Google and Ebay images will be represented by color histograms. We consider the images from the Google and Ebay datasets to be insRGBformat. Before computing the color histograms
these images are gamma corrected with a correction factor of 2.4. Although images might not be correctly white balanced, we do not applying a color constancy algorithm, since color constancy often gives unsatisfying results [21]. Furthermore, many Google images lack color calibration information, and regularly break assumptions on which color constancy algorithms are based.
The images are converted to the L∗a∗b∗ color space, which is a perceptually linear color space, ensuring that similar differences between L∗a∗b∗ values are considered about equally important color changes to humans. This is a desired property because the uniform binning we apply for histogram construction implicitly assumes a meaningful distance measure. To compute the L∗a∗b∗ values we assume a D65 white light source.
For the three chip-based approaches the probability over the color names of a limited set of samples is given. We also require the assignments of colors outside and in between the color chips samples. To compute the probability over the color names z for all L∗a∗b∗-bins (we use the same discretization as is applied in our algorithm), we assign to each L∗a∗b∗-bin w the probability of the neighbors according to
p(z|w)∝ XN
i=1
p(z|wi)gσ(|wi−w|) (1) where thewi’s are theL∗a∗b∗-values for the color chips andN is total number of chips.p(z|wi) is given for all the color chips. The distance between the color chips, wi, and w is computed in L∗a∗b∗-space. For the weighting kernel gσ we use a Gaussian, for which the scale σ has been optimized on the validation dataset.
III. LEARNINGCOLORNAMES
Latent aspect models have received considerable interest in the text analysis community as a tool to model documents as a mixture of several semantic –but a-priori unknown, and hence
“latent”– topics. Latent Dirichlet allocation (LDA) [22] and probabilistic latent semantic analysis (PLSA) [16] are perhaps the most well known among such models. Recently such models have also been applied in computer vision, where images take the role of documents and pixels or small image patches take the role of words [17], [23], [24], [25], [26], [27].
In our work we use the topics to represent the color names of pixels. Latent aspect models are of interest to our problem since they naturally allow for multiple topics in the same image, as is the case in our Google data set where each image contains a number of colors. Pixels are
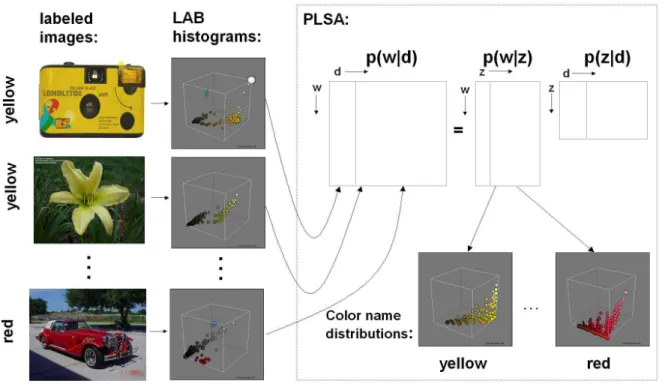
Fig. 3. Overview of standard PLSA model for learning color names. See text for explanation.
represented by discretizing their L∗a∗b∗ values into a finite vocabulary by assigning each value by cubic interpolation to a regular 10×20×20grid in theL∗a∗b∗-space1. An image (document) is then represented by a histogram indicating how many pixels are assigned to each bin (word).
A. Generative Models
We start by recalling the standard PLSA model, after which we propose an adapted version better suited to our problem. We follow the terminology of the text analysis community.
1Because theL∗a∗b∗-space is perceptually uniform we discretize it into equal volume bins. Different quantization levels per channel are chosen because of the different ranges: the intensity axis ranges from 0 to 100, and the chromatic axes range from -100 to 100.
Given a set of documentsD={d1, ..., dN}each described in a vocabularyW ={w1, ..., wM}, the words are taken to be generated by latent topics Z = {z1, ..., zK}. In the PLSA model the conditional probability of a word w in a document d is given by:
p(w|d) = X
z∈Z
p(w|z)p(z|d). (2)
Both distributionsp(z|d)andp(w|z)are discrete multinomial distributions, and can be estimated with an EM algorithm [16] by maximizing the log-likelihood function
L=X
d∈D
X
w∈W
n(d, w) logp(d, w) (3)
where p(d, w) = p(d)p(w|d), and n(d, w) is the term frequency, containing the word occur- rences for every document.
The method in Eq. 2 is called a generative model, since it provides a model of how the observed data has been generated given hidden parameters (the latent topics). The aim is to find the latent topics which best explain the observed data. In the case of learning color names, we model the color values in an image as being generated by the color names (topics). For example, the color name red generates L∗a∗b∗ values according to p(w|t = red). These word- topic distributions p(w|t) are shared between all images. The amount of the various colors we see in an image is given by the mixing coefficients p(t|d), and these are image specific. The aim of the learning process is to find the p(w|t)and p(t|d)which best explain the observations p(w|d). As a consequence, colors which often co-occur are more likely to be found in the same topic. E.g., the label red will co-occur with highly saturated reds, but also with some pinkish-red colors due to specularities on the red object, and dark reds caused by shadows or shading. All the different appearances of the color name red are captured in p(w|t=red).
In Fig. 3 an overview of applying PLSA to the problem of color naming is provided. The goal of the system is to find the color name distributions p(w|t). First, the weakly labelled Google images are represented by their normalized L∗a∗b∗ histograms. These histograms form the columns of the image specific word distribution p(w|d). Next, the PLSA algorithm aims to find the topics (color names) which best explain the observed data. This process can be understood as a matrix decomposition of p(w|d) into the word-topic distributions p(w|t) and the document specific mixing proportionsp(t|d). The columns ofp(w|t)contain the information we are seeking, namely, the distributions of the color names over L∗a∗b∗ values.
In the remainder of this section we discuss two adaptations to the standard model.
Exploiting image labels: the standard PLSA model cannot exploit the labels of images. More precisely, the labels have no influence on the maximum likelihood (Eq. 3). The topics are hoped to converge to the state where they represent the desired color names. As is pointed out in [28]
in the context of discovering object categories using LDA, this is rarely the case. To overcome this shortcoming we propose an adapted model that does take into account the label information.
We propose to use the image labels to define a prior distribution on the frequency of topics (color names) in documents p(z|d). This prior will still allow each color to be used in each image, but the topic corresponding to the label of the image—here obtained with Google—is a-priori assumed to have a higher frequency than other colors. Below, we use the shorthands p(w|z) =φz(w) and p(z|d) = θd(z).
The multinomial distribution p(z|d) is supposed to have been generated from a Dirichlet distribution of parameter αld where ld is the label of the document d. The vector αld has length K (number of topics), where αld(z) =c≥1 for z =ld, and αld(z) = 1 otherwise. By varying c we control the influence of the image labels ld on the distributions p(z|d). The exact setting of c will be learned from the validation data.
For an image d with label ld, the generative process thus reads:
1) Sample θd (distribution over topics) from the Dirichlet prior with parameter αld. 2) For each pixel in the image
a) sample z (topic, color name) from a multinomial with parameter θd b) sample w (word, pixel bin) from a multinomial with parameter φz
The distributions over words φz associated with the topics, together with the image specific distributions θd, have to be estimated from the training images. This estimation is done using an EM (Expectation-Maximisation) algorithm. In the Expectation step we evaluate for each word (color bin) w and document (image) d
p(z|w, d)∝θd(z)φz(w). (4)
During the Maximisation step, we use the result of the Expectation step together with the normalized word-document counts n(d, w) (frequency of word w in document d) to compute
p1
p2
m1 m2
p2
p1 p
1
p2
ρ1
ρ2
w w
w
p(w) p(w) p(w)
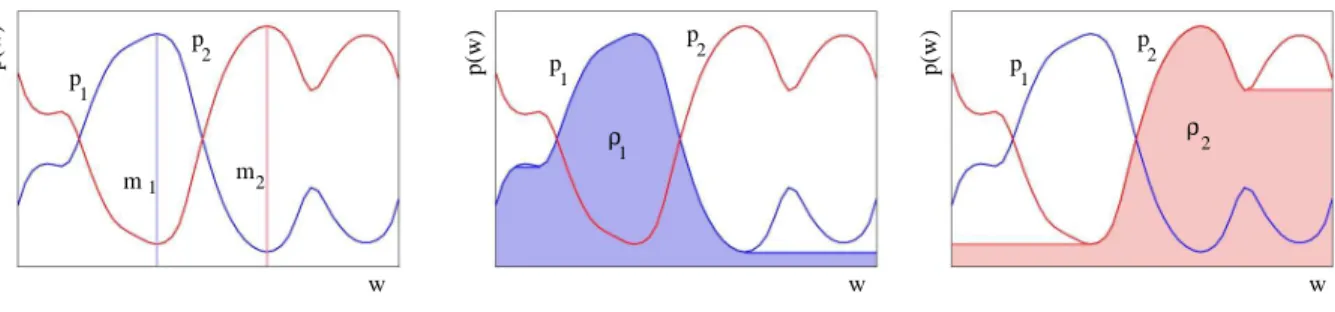
Fig. 4. Example of greyscale reconstruction. (left) Initial functions p1 = p(z1|w), p2 = p(z2|w), and markers m1 and m2. (middle) Greyscale reconstruction ρ1 of p1 fromm1. (right) Greyscale reconstructionρ2 ofp2 fromm2. Sinceρ1 is by definition a unimodal function, enforcing the difference betweenp1 andρ1 to be small reduces the secondary modes ofp1.
the maximum likelihood estimates of φz and θd as φz(w)∝X
d
n(d, w)p(z|w, d), (5)
θd(z)∝(αld(z)−1) +X
w
n(d, w)p(z|w, d). (6)
Note that we obtain the EM algorithm for the standard PLSA model when αld(z) = c = 1, which corresponds to a uniform Dirichlet prior over θd (in the experimental section indicated with PLSA-std).
Enforcing unimodality: our second adaptation of the PLSA model is based on prior knowledge of the probabilities p(z|w). Consider the color name red: a particular region of the color space will have a high probability of red, moving away from this region in the direction of other color names will decrease the probability of red. Moving even further in this direction can only further decrease the probability of red. This is caused by the unimodal nature of the p(z|w) distributions. Next, we propose an adaptation of the PLSA model to enforce unimodality to the estimated p(z|w) distributions.
It is possible to obtain a unimodal version of a function by means of greyscale reconstruction.
The greyscale reconstruction of function p is obtained by iterating geodesic greyscale dilations of a markermunderpuntil stability is reached [29]. Consider the example given in Fig. 4. In the example, we consider two 1D topics p1 = p(z1|w) and p2 = p(z2|w). By iteratively applying a geodesic dilation from the marker m1 under the mask function p1 we obtain the greyscale reconstruction ρ1. The function ρ1 is by definition unimodal, since it only has one maximum
at the position of the marker m1. Similarly, we obtain a unimodal version of p2 by a greyscale reconstruction of p2 from marker m2.
Something similar can be done for the color name distributions p(z|w). We can compute a unimodal versionρmzz (w)by performing a greyscale reconstruction ofp(z|w)from markersmz
(finding a suitable position for the markers will be explained below). To enforce unimodality, without assuming anything about the shape of the distribution, we add the difference between the distributions p(z|w) and their unimodal counterpartsρmz z(z)as a regularization factor to the log-likelihood function:
L=X
d∈D
X
w∈W
n(d, w) logp(d, w)−γX
z∈Z
X
w∈W
(p(z|w)−ρmzz(w))2, (7) Adding the regularization factor in Eq. 3 forces the functions p(z|w) to be closer to ρmz z(z).
Since ρmzz(z) is unimodal this will suppress the secondary modes in p(z|w), i.e. the modes which it does not have in common with ρmzz(z).
In the case of the color name distributionsp(z|w) the grey reconstruction is performed on the 3D spatial grid inL∗a∗b∗space with a 26-connected structuring element. The markersmzfor each topic are computed by finding the local mode starting from the center of mass of the distribution p(z|w). This was found to be more reliable than using the global mode of the distribution. The regularization functions ρmzz, which depend upon p(z|w), are updated at every iteration step of the conjugate gradient based maximization procedure which is used to compute the maximum likelihood estimates of φz(w). The computation of the maximum likelihood estimate for θd(z) is not directly influenced by the regularization factor and is still computed with Eq. 6.
In conclusion, we introduce two improvements of the standard PLSA model. Firstly, we use the image labels to define a prior distribution on the frequency of topics. Secondly, we add a regularization factor to the log likelihood function which suppresses the secondary modes in the p(z|w) distributions. The two parameters, cand γ, which regularize the strength of the two adaptations will be learned from validation data.
B. Assigning Color Names in Test Images
Once we have estimated the distributions over words p(w|z) representing the topics, we can use them to compute the probability of color names corresponding to image pixels in test images.
As the test images are not expected to have a single dominant color, we do not use the label- based Dirichlet priors that are used when estimating the topics. Instead we consider two ways to assign color names to pixels.
The first method, PLSA-ind, is based on the individual pixel values and does not use regional information. The probability of a color name given a pixel is given by
PLSA−ind : p(z|w)∝p(z)p(w|z), (8)
where the prior over the color names p(z) is taken to be uniform.
The second method, PLSA-reg, takes into account a region around the pixel. As we expect a relatively small number of color names within a region, we estimate a region-specific distribution over the color names. The probability of a color name given the region is calculated as
PLSA−reg : p(z|w, d)∝p(w|z)p(z|d), (9)
where the region-based p(z|d) is estimated using the EM algorithm with the word topic distri- bution p(w|z) fixed. The difference between the two methods is that PLSA-reg estimates the distribution p(z|d) over the color names in the region to bias the assignments of pixels to color names. In practice this has the effect that less color names are found in an image, because the prior p(z|d) will suppress the less occurring color names, and favor the more occurring color names.
To obtain a probability distribution over the color names for an image region (e.g., the segmentation masks in the Ebay image set) we use the topic distribution over the region p(z|d) described above for PLSA-reg. For PLSA-ind the probability over the color names for a region is computed by a simple summation over all pixels in the region of the probabilities p(z|w), computed with Eq. 8 using a uniform prior. In the following section, we will compare PLSA-ind and PLSA-reg for retrieving colored objects and assigning color names to pixels.
IV. EXPERIMENTALRESULTS
In the first experiment, we analyze to what extent it is possible to learn color names from weakly labelled data, and we compare the proposed learning approach with alternative learning approaches. In the second experiment, we compare color names learned from Google Images with the traditional approach of learning color names from color chip. Finally, we illustrate the flexibility of our approach with respect to changes in the set of color names.
Settings:for both tasks, pixel annotation and image retrieval, we use the Ebay data set presented in Section II. The parametercwhich determines theαldvectors, and the regularization factorγare chosen as to optimize the pixel annotation results on the validation set of the Ebay dataset. In case the color names are learned from 200 Google images per color name, we found (c, γ) = (5,200) to be optimal. We report result for five learning methods. For PLSA-std color names are learned with the standard PLSA (corresponding to(c, γ) = (1,0)), and assignment of color names in new images without using the region. PLSA-bg refers to the method proposed in [30]. For PLSA- ind and PLSA-reg color names are learned with our modified PLSA, and pixel assignment is respectively based on individual pixels and regions.
For all PLSA methods the word-topic distributions p(w|z) are initialized by taking for each topic the average of the empirical distribution over words of all documents labelled with the class associated with that topic. Furthermore, we report pixel annotation results obtained with a linear support vector machine (SVM). The SVM classifier is trained on the L∗a∗b∗-histograms of the preprocessed Google images after which we apply it to classify individual pixels.
All the quantitative results are the average results obtained over 10 runs of the algorithm. For each run the set of training data is randomly selected from the total set of 250 Google images per color name. The maximum training data set we used is 200 images, since performance gain as a function of number of training examples was not found to further increase by adding more training examples.
A. Automatic Learning of Color Names from Weakly Labelled Data
In this experiment, we analyze to what extent the proposed approach is capable of learning color names from weakly labelled data. We test our method on three points. Firstly, do the proposed adaptation to the PLSA-model improve results. Secondly, what is the performance behavior as a function of the number of training samples. Thirdly, does the proposed method outperform other learning approaches.
The color naming methods are compared on the task of pixelwise color name annotation of the Ebay images. All pixels within the segmentation masks are assigned to their most likely color name. We report thepixel annotation score, which is the percentage of correctly annotated pixels.
In a first experiment, we investigate if the proposed modifications of the PLSA model do
10 25 50 100 150 200 30
40 50 60 70 80
number of training images
pixel classification (%)
labels regularization (c, γ) overall
no no (∞,0) 55.0
yes no (5,0) 60.8
no yes (∞,200) 60.0
yes yes (5,200) 62.5
PLSA-bg - - 57.3
(a) (b)
Fig. 5. (a) Pixel annotation score (in percentage) of PLSA-ind for different settings ofcandγlearned on a training set of 25 images per color name. The overall column contains the results averaged over the four classes in the Ebay set. Both adaptations of the PLSA model (i.e. exploiting the image labels by using a label-based prior and using the regularization term) are shown to improve results significantly. PLSA-bg indicates the method proposed in [30]. (b) Pixel annotation score of PLSA-ind with optimalc-γ settings (blue line) compared to(c, γ) = (∞,0)setting (green dashed line) as a function of the number of images in the training set. The black straight line indicates the theoretical maximum of pixel based color naming on this data set.
actually improve results. In Section III-A we proposed two adaptations to the standard PLSA model. Firstly, the labels were exploited by setting a prior on the frequency of the topics in the documents. Secondly, we added a regularization term to the log likelihood function (see Eq. 7) to enforce unimodality on the p(z|w) distributions. We learned the color names based on a subset of 25 training images of the Google set per color name. Results are summarized in Fig 5a. The results obtained by (c, γ) = (∞,0) are equal to the empirical distribution of the color names, which means that p(w|z) is obtained by a simple averaging of the histograms of all the images with the label z. Both adaptations are shown to improve the annotation results, and the combined use of the adaptations further improves results. The method is also shown to improve significantly upon the method proposed in [30].
A qualitative comparison of two of the settings is shown in Fig. 6. The image shows pixels of constant intensity, with varying hue in the angular direction, and varying saturation in the radial direction. On the right side of the image a bar with varying intensity is included. Color names are expected to be relatively stable for constant hue, only for low saturation they change to an achromatic color (i.e. in the center of the image). The only exception to this rule is brown which
oo
n=25,c= n=200,c=oo n=200,c=2, γ=200
(a) (b) (c) (d) (e)
n=25,c=5,γ=200
,γ=0 ,γ=0
Fig. 6. (a) A challenging synthetic image: the highly saturated RGB values at the border rarely occur in natural images. (b-e) results obtains with different settings forc, γ andnthe number of train images per color name. The figure demonstrates that our method, images (c) and (e), improves results.
method cars shoes dresses pottery overall
SVM 53 72 74 65 66.2
PLSA-std 54 74 75 66 67.3
PLSA-bg 56 76 79 68 70.0
PLSA-ind 56 77 80 70 70.6
PLSA-reg 74 94 85 82 83.4
CC-I 39 58 62 48 51.8
CC-II 51 66 69 61 61.8
CC-III 53 71 78 65 66.6
TABLE I
PIXEL ANNOTATION SCORE FOR THE FOUR CLASSES IN THEEBAY DATA SET. THE FIFTH COLUMN PROVIDES AVERAGE RESULTS OVER THE FOUR CLASSES. THE TOP FIVE ROWS GIVE THE RESULTS FOR THE VARIOUS LEARNING APPROACHES
FROM THEGOOGLE DATA. THE BOTTOM THREE ROWS GIVE THE RESULTS FOR CHIP-BASED COLOR NAMING.
is low saturated orange. Hence, we expect the color names to form a pie-like partitioning with an achromatic color in the center, and the color name brown for low saturated orange. Assigning color names based on the empirical distribution (Fig. 6(b)) leads to many errors, especially in the saturated regions. Our method trained from only 25 images per color name (Fig. 6(c)) obtains results much closer to what is expected.
Next, we look at the performance as a function of the number of training images, see Fig. 5(b).
The difference between the PLSA-ind method with optimal c-γ settings and the empirical distributions becomes smaller by increasing the number of training images. However, although the quantitative difference for the maximum of 200 training images is small, a qualitative comparison
shows that our method obtains significantly better results, see Fig. 6(d) and (e). The reason for the small quantitative difference is that the vast majority of pixels in real-world images are low saturated. For these pixels both methods obtain good results. For the more saturated pixels the empirical distribution fails often, as can be seen in the saturated green region which is named either red or blue. Such errors will be considered as very disturbing by users. We have further plotted a line in Fig. 5(b) indicating the theoretical maximum for pixel annotation on this data set. Purely pixel-based annotation is limited by the fact that the color name distributions have an overlap, i.e. some pixels can be assigned to multiple color names. The position of the line is computed by assigning every RGB value of the labelled Ebay test set images to the color name with which it was most often labelled. The line provides an upper bound for the results which can be obtained for pixel classification without taking any context into consideration.
Finally, we compare the results of our method, learned from 200 Google images per color name, to several other learning approaches (top five rows of Table IV-A). As can be seen PLSA- std obtains unsatisfying results, and our improved version PLSA-ind outperforms SVM and PLSA-bg. Also results for PLSA-reg are included, where we take the surrounding of the pixel into account, and use arg maxzp(z|w, d) to classify the pixel, where the region (document) is the set of all pixels in the segmentation mask. Taking the context into account does result in a further large improvement to 83.4%.
The PLSA-ind model learned on the Google images is available online at
http://lear.inrialpes.fr/people/vandeweijer/color names.html, in the form of a 32×32×32 lookup table which maps sRGB values to probabilities over color names.
B. Comparison to Chip-Based Color Naming
In this experiment we compare color naming based on real-world images, as done in our method, to chip-based color naming. The comparison is performed on two tasks: pixel annotation and image retrieval. The color names are learned from a training set of 200 Google images per color name. It should be noted that chip-based methods are not explicitly designed to perform color naming on real-world images.
Pixelwise Color Name Annotation: First we compare the results on the experiment discussed in Section IV-A. The bottom three rows of Table IV-A show the results obtained by the three chip-based approaches. The gain obtained by learning color names from real-world images is
Fig. 7. Three examples of pixelwise color name annotation. The color names are represented by their corresponding color. For each example the results of the chip-based methods CC-I, CC-III, and the real-world color names learned with PLSA-ind are given from left to right. Note that the color names learned from Google Image search, PLSA-ind, obtain also satisfying results for the achromatic regions, where the chip-based methods often fail.
significant: where the best chip-based method classifies only 66.6% of the pixels correctly, our method obtains a score of 70.6%. Examples of color name annotations based on PLSA-ind and two of chip-based methods are given in Fig. 7.
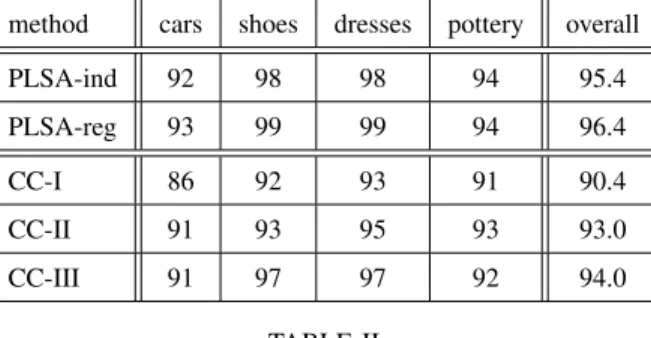
Color Object Retrieval: Another application of color names is retrieval of colored objects. We query the four categories of the Ebay set (see Section 2) for the 11 color names. For example, the car category is queried for ”red cars”. The images are retrieved based on the probability of the query color given an images, where only pixels within the segmentation masks are considered.
To assess the performance we compute the equal error rate (EER) for each query. The average EER’s over the eleven color names for the various color naming methods are reported in Table IV-B. Again we find that learning of color names from real-world images outperforms the chip- based methods consistently for all classes.
When comparing PLSA-reg and PLSA-ind in the pixel annotation and retrieval experiments we see a different picture (consistently over all four categories): for pixel annotation we observe
method cars shoes dresses pottery overall
PLSA-ind 92 98 98 94 95.4
PLSA-reg 93 99 99 94 96.4
CC-I 86 92 93 91 90.4
CC-II 91 93 95 93 93.0
CC-III 91 97 97 92 94.0
TABLE II
AVERAGE EQUAL ERROR RATES FOR RETRIEVAL ON THE FOUR CLASSES IN THEEBAY DATA SET. THE FIFTH COLUMN PROVIDES AVERAGE RESULTS OVER THE FOUR CLASSES.
a significant improvement with PLSA-reg, while for retrieval for performance of PLSA-reg is only slightly better. The difference between PLSA-reg and PLSA-ind is that the former couples the topic assignment of pixels within an image. This is important for pixel annotation. However, in the retrieval experiment the difference between the methods is much smaller. This is due to the fact that the retrieval score for PLSA-ind also accumulates the color name probabilities over the region, it is actually equal to PLSA-reg stopped after one iteration. When using PLSA-reg, the accumulation of color name probabilities is repeated to iteratively estimate the region-specific prior p(z|d), which is then used as the score. Our results correspond to the results reported by Quelhas et al. [25]. In the context of scene classification they also observed modest improvements in retrieval results when taking the region-context into account with p(z|d).
Discussion on Limitations of Chip-Based Color Naming: Our experimental results show that color names learned from real-world images outperform color names based on color chips. There are two main reasons for real-world color names to outperform chip-based methods.
Firstly, for both the CC-I and CC-II data set the color space is insufficiently sampled. This is the case for saturated colors, but also other regions of the color space are sparsely sampled, e.g., the assignment of some of the darker yellows on the sport car in Fig. 7 (second column) to orange is due to this fact. The CC-III set has overcome this problem by realizing a much denser and completer sampling of the sRGB space. From the results in Table IV-A and IV-B it can be seen that CC-III does significantly improve over both CC-I and CC-II. An alternative approach to counter the lack of samples is by using prior knowledge on the shape of the color name distributions in the sRGB space, as is done in the work of Benavente[8].
1 10 20 30 40
Fig. 8. top: color name categories on the Munsell color array obtained by Benavente [31]. The colored lines indicate the boundaries of the eleven color categories. below: color names obtained with PLSA-ind learned on the Google data set. Note the differences in chromatic and achromatic assignments.
The second reason for failure of chip-based methods is more fundamental to chip-based approaches. By analyzing in more detail the errors made by the best chip based method CC-III, and comparing them to our approach PLSA-ind, we found that the largest part (almost 70 %) of the error increase is caused by achromatic colors which are named with chromatic color names.
This can be explained by the difference in training data between the two methods. Learning color names from data obtained in a controlled laboratory setting, does not resemble color naming in the real-world. In the real-world colors are not presented on a color neutral background under a known white light source. Instead they appear in a world with interreflections, varying illuminants, colored shadows, compression artifacts, aberrations in acquisition, etc. This causes the vast majority of the errors to be made on the achromatic colors since after a small variations these colors would be considered chromatic in a laboratory setting. The black region under the vase is considered partially green by CC-III, as is the road next to the car. By learning the color names from real-world images a robustness to deviations which occur from the real object
color to the final sRGB value is automatically achieved. The learned color names show good robustness to physical variations, due to shadow and shading, as can be seen from the uniform color name assignment on both the vase and the car.
To further illustrate this, we have applied our color naming algorithm to the Munsell color array used in the World Color Survey by Berlin and Kay [3]. The results are shown in Fig. 8.
In the top the results of the chip-based method of Benavente [31], and in the bottom the results obtained by our approach PLSA-ind. The color names are similarly centered, and only on the borders there are some disagreements. The main difference which we want to point out is that all chromatic patches are named by chromatic color names in the Benavente experiment, whereas in our case multiple patches are named by the achromatic color names, black and white. In the case of naming individual patches in a controlled environment, the Benavente set is expected to obtain superior results, whereas for applications on real-world images, color names derived from real-word images are expected to obtain better results.
C. Flexibility Color Name Data Set
A further drawback of chip-based color naming is its inflexibility with respect to changes of the color name set. For example, Mojsilovic, in her study on color naming [7], asks a number of human test subjects to name the colors in a set of images. In addition to the eleven basic color terms beige, violet and olive were also mentioned. For a method based on an image search engine changing the set of color names is an undemanding task, since the collection of data is only several minutes of work.
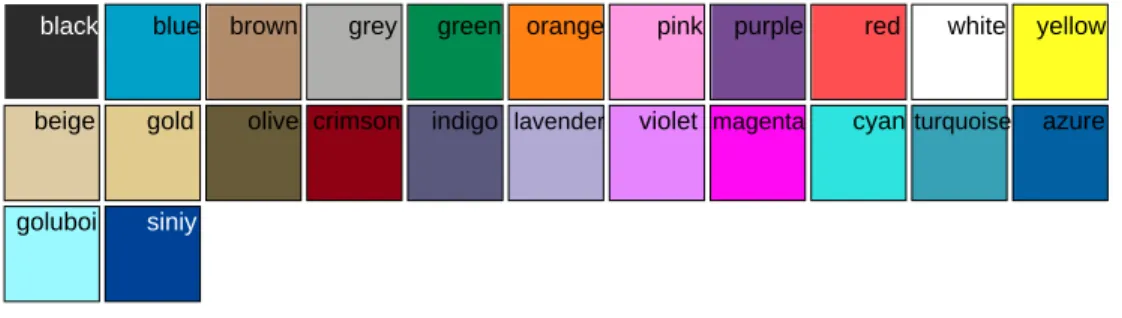
Next, we give two examples of varied color name sets. In Fig. 9 we show prototypes of the eleven basic color terms learned from the Google images. The prototypewz of a color name is that color which has the highest probability of occurring given the color namewz = argmaxwp(w|z).
Next, we add a set of eleven extra color names, for which we retrieve 100 images from Google image each. Again the images contain many false positives. Then a single extra color name is added to the set of eleven basic color terms, and the color distributions p(w|z) are re-computed, after which the prototype of the newly added color name is derived. This process is repeated for the eleven new color names. The results are depicted in the second row of Fig.9 and correspond to the colors we expect to find.
As a second example of flexibility we look into inter-linguistic differences in color naming.
beige gold olive crimson indigo violet cyan azure
goluboi siniy
white yellow red
purple pink
orange green
grey brown blue black
lavender magenta turquoise
Fig. 9. First row: prototypes of the 11 basic color terms learned from Google images based on PLSA-ind. Second row:
prototypes of a varied set of color names learned from Google images. Third row: prototypes of the two Russian blues learned from Google images.
The Russian language is one of the languages which has 12 basic color terms. The color term blue is split up into two color terms: goluboi (goluboi˘), and siniy (sinii˘). We ran the system on 30 images for both blues, returned by Google image. Results are given in Fig.9, and correspond with the fact that goluboi is a light blue and siniy a dark blue. This example shows internet as a potential source of data for the examination of linguistic differences in color naming.
V. CONCLUSIONS
In this paper, we have shown that color names learned from real-world images outperform chip-based color names on real-world applications. Furthermore, we have shown that real-world color names can be learned from weakly labelled images returned by Google Image search, even though the retrieved images contain many false positives. Learning color names from image search engines has the additional advantage that the method can easily vary the set of desired color names, something which is very costly in a chip-based setting. Finally, we show that our adapted version of the PLSA model outperforms the standard PLSA model significantly, and that the use of regional information is beneficial for color name annotation.
In a wider context this article can be seen as a case study for the automatic learning of visual attributes [18][32]. In recent years the computer vision community has achieved significant progress in the field of object recognition. Now that it is possible to detect objects such as people, cars, and vases in images, the question arises if we are able to retrieve small people, stripedvases, andred cars. The scope of these so called visual attributes is vast: they range from size descriptions, such as large, elongated, and contorted, to texture descriptions such as striped,
regular, and smooth, to color descriptions, such as red, cyan and pastel. The challenges which arose in the development of our automatic color naming system can be seen as exemplary for the problems which arise for visual attribute learning in general.
ACKNOWLEDGEMENTS
We acknowledge Robert Benavenate for his advice and for providing the Munsell color patch data. This work is partially supported by the Marie Curie European Reintegration Grant, the European funded CLASS project, the Consolider-Ingenio 2010 CSD2007-00018 of Spanish Ministry of Science and the Ramon y Cajal Program.
REFERENCES
[1] C. Hardin and L. Maffi, Eds.,Color Categories in Thought and Language. Cambridge University Press, 1997.
[2] L. Steels and T. Belpaeme, “Coordinating perceptually grounded categories through language: A case study for colour.”
Behavioral and Brain Science, vol. 28, pp. 469–529, 2005.
[3] B. Berlin and P. Kay,Basic color terms: their universality and evolution. Berkeley: University of California, 1969.
[4] D. Conway, “An experimental comparison of three natural language colour naming models,” inProc. east-west int. conf.
on human-computer interaction, 1992, pp. 328–339.
[5] L. Griffin, “Optimality of the basic colour categories for classification,”R. Soc. Interface, vol. 3, no. 6, pp. 71–85, 2006.
[6] J. Lammens, “A computational model of color perception and color naming,” Ph.D. dissertation, Univ. of Buffalo, 1994.
[7] A. Mojsilovic, “A computational model for color naming and describing color composition of images,”IEEE Transactions on Image Processing, vol. 14, no. 5, pp. 690–699, 2005.
[8] R. Benavente, M. Vanrell, and R. Bladrich, “A data set for fuzzy colour naming,” COLOR research and application, vol. 31, no. 1, pp. 48–56, 2006.
[9] G. Menegaz, A. L. Troter, J. Sequeira, and J. M. Boi, “A discrete model for color naming,”EURASIP Journal on Advances in Signal Processing, vol. 2007, 2007.
[10] G. Menegaz, A. L. Troter, J. M. Boi, and J. Sequeira, “Semantics driven resampling of the osa-ucs,” inComputational Color Imaging Workshop, Modena, Italy, 2007.
[11] S. Tominaga, “A color-naming method for computer volor vision,” inIEEE Int. Conf. on Systems, Man, and Cybernetics, Osaka, Japan, 1985.
[12] Y. Liu, D. Zhang, G. Lu, and W.-Y. Ma, “Region-based image retrieval with high-level semantic color names,” inProc.
11th Int. Conf. on Multimedia Modelling, 2005.
[13] R. Fergus, L. Fei-Fei, P. Perona, and A. Zisserman, “Learning object categories from Google’s image search,” in Proc.
IEEE Int. Conf. on Computer Vision, Beijing, China, 2005.
[14] N. Moroney, “Unconstrained web-based color naming experiment, in color imaging: Device-dependent color, color hardcopy and graphic arts,” inVIII, Reiner Eschbach, Gabriel Marcu, Editors, Proc. of the SPIE, 2003.
[15] G.Beretta and N. Moroney, “Cognitive aspects of color,”HP technical reports, no. HPL-2008-109, 2008.
[16] T. Hofmann, “Probabilistic latent semantic indexing,” in Proc. ACM SIGIR Conf. on Research and Development in Information Retrieval, 1999, pp. 50–57.
[17] K. Barnard, P. Duygulu, D.Forsyth, N. de Freitas, D. M. Blei, and M. I. Jordan, “Matching words and pictures,”J. Mach.
Learn. Res., vol. 3, pp. 1107–1135, 2003.
[18] K. Yanai and K. Barnard, “Image region entropy: a measure of ”visualness” of web images associated with one concept,”
in MULTIMEDIA ’05: ProcP of the 13th annual ACM international conference on Multimedia. New York, NY, USA:
ACM Press, 2005, pp. 419–422.
[19] K. Kelly and D. Judd,Color:Universal Language and Dictionary of Names. National Bureau of Standards, 1976.
[20] G. Wyszecki and W. Stiles, Color Science: Concepts and Methods, Quantitative Data and Formulae. New York, NY, USA: John Wiley & Sons, 1982.
[21] B. Funt, K. Barnard, and L. Martin, “Is machine colour constancy good enough?” Proc. European Conf. on Computer Vision, vol. 1406, pp. 445–459, 1998.
[22] D. Blei, A. Ng, and M. Jordan, “Latent Dirichlet allocation,” J. of Machine Learning Research, vol. 3, pp. 993–1022, 2003.
[23] F. Monay and D. Gatica-Perez, “On image auto-annotation with latent space models,” inMULTIMEDIA ’03: Proceedings of the eleventh ACM international conference on Multimedia. New York, NY, USA: ACM, 2003, pp. 275–278.
[24] J. Sivic, B. Russell, A. Efros, A. Zisserman, and B. Freeman, “Discovering objects and their location in images,” inProc.
IEEE Int. Conf. on Computer Vision, 2005.
[25] P. Quelhas, F. Monay, J.-M. Odobez, D. Gatica-Perez, T. Tuytelaars, and L. van Gool, “Modeling scenes with local descriptors and latent aspects,” inProc. IEEE Int. Conf. on Computer Vision, 2005.
[26] J. Verbeek and B. Triggs, “Region classification with markov field aspect models,” inProc. Computer Vision and Pattern Recognition, 2007.
[27] A. Bosch, A. Zisserman, and X. Munoz, “Scene classification using a hybrid generative/discriminative approach,” vol. 30, no. 4, 2008, pp. 712–727.
[28] D. Larlus and F. Jurie, “Latent mixture vocabularies for object categorization,” inBritish Machine Vision Conference, 2006.
[29] L. Vincent, “Morphological grayscale reconstruction in image analysis: applications and efficient algorithms,”IEEE Trans.
on Image Processing, vol. 2, no. 2, pp. 176–201, Apr. 1993.
[30] J. van de Weijer, C. Schmid, and J. Verbeek, “Learning color names from real-world images,” inProc. Computer Vision and Pattern Recognition, Minneapolis, Minnesota, USA, 2007.
[31] R. Benavente, M. Vanrell, and R. Baldrich, “Parametric fuzzy sets for automatic color naming,” Journal of the Optical Society of America A, vol. 25, no. 10, pp. 2582–2593, 2008.
[32] V. Ferrari and A. Zisserman, “Learning visual attributes,” in Advances in Neural Information Processing Systems 20, J. Platt, D. Koller, Y. Singer, and S. Roweis, Eds. Cambridge, MA: MIT Press, 2008, pp. 433–440.

![Fig. 8. top: color name categories on the Munsell color array obtained by Benavente [31]](https://thumb-eu.123doks.com/thumbv2/1bibliocom/470000.73934/21.918.109.809.108.496/fig-color-categories-munsell-color-array-obtained-benavente.webp)