HAL Id: hal-00298004
https://hal.archives-ouvertes.fr/hal-00298004
Submitted on 9 May 2008
HAL is a multi-disciplinary open access archive for the deposit and dissemination of sci- entific research documents, whether they are pub- lished or not. The documents may come from teaching and research institutions in France or abroad, or from public or private research centers.
L’archive ouverte pluridisciplinaire HAL, est destinée au dépôt et à la diffusion de documents scientifiques de niveau recherche, publiés ou non, émanant des établissements d’enseignement et de recherche français ou étrangers, des laboratoires publics ou privés.
Branch xylem density variations across Amazonia
S. Patiño, J. Lloyd, R. Paiva, C. A. Quesada, T. R. Baker, A. J. B. Santos, L.
M. Mercado, Y. Malhi, O. L. Phillips, A. Aguilar, et al.
To cite this version:
S. Patiño, J. Lloyd, R. Paiva, C. A. Quesada, T. R. Baker, et al.. Branch xylem density variations across Amazonia. Biogeosciences Discussions, European Geosciences Union, 2008, 5 (3), pp.2003-2047.
�hal-00298004�
BGD
5, 2003–2047, 2008
Amazonian xylem density variation
S. Pati ˜no et al.
Title Page Abstract Introduction Conclusions References
Tables Figures
◭ ◮
◭ ◮
Back Close
Full Screen / Esc
Printer-friendly Version Interactive Discussion
Biogeosciences Discuss., 5, 2003–2047, 2008 www.biogeosciences-discuss.net/5/2003/2008/
© Author(s) 2008. This work is distributed under the Creative Commons Attribution 3.0 License.
Biogeosciences Discussions
Biogeosciences Discussionsis the access reviewed discussion forum ofBiogeosciences
Branch xylem density variations across Amazonia
S. Pati ˜no1,2,3, J. Lloyd2, R. Paiva4, C. A. Quesada2,5, T. R. Baker2, A. J. B.
Santos5,6,†, L. M. Mercado7, Y. Malhi8, O. L. Phillips2, A. Aguilar9, E. Alvarez11, L.
Arroyo12, D. Bonal3, A. C. L. Costa13, C. I. Czimczik14, J. Gallo15, R. Herrera16, N.
Higuchi5, V. Horna17, E. J. Hoyos18, E. M. Jimenez9, T. Killeen19, E. Leal10, F. Luiz ˜ao5, P. Meir20, A. Monteagudo21,22, D. Neill23, P. N ´u ˜nez-Vargas21, W.
Palomino21, J. Peacock2, A. Pe ˜na-Cruz22, M. C. Pe ˜nuela9, N. Pitman24, N. Priante Filho25, A. Prieto1, S. N. Panfil26, A. Rudas27, R. Salom ˜ao10, N. Silva28,29,
M. Silveira30, S. Soares de Almeida10, A. Torres-Lezama31, J. D. Turriago15, R. V ´asquez-Mart´ınez21, M. Schwarz16, A. Sota16, J. Schmerler16, I. Vieira10, B.
Villanueva15, and P. Vitzthum9
1Instituto de Investigaci ´on de Recursos Biol ´ogicos Alexander von Humboldt. Diagonal 27 No.
15-09, Bogot ´a D.C, Colombia
2Earth and Biosphere Institute, School of Geography, Univ. of Leeds, LS2 9JT, UK
3UMR-ECOFOG, INRA, 97310 Kourou, French Guiana
4Secretr ´aria Municipal de Desenvolvimento e Meio Ambiente na Prefeitura Municipal de Mau ´es, Mau ´es, Brazil
2003
BGD
5, 2003–2047, 2008
Amazonian xylem density variation
S. Pati ˜no et al.
Title Page Abstract Introduction Conclusions References
Tables Figures
◭ ◮
◭ ◮
Back Close
Full Screen / Esc
Printer-friendly Version Interactive Discussion 5Institito National de Pesquisas Amaz ˆonicas, Manaus, Brazil
6Departamento de Ecologia, Universidade de Bras´ılia, Brazil
7Centre for Ecology and Hydrology, Wallingford, UK
8Oxford University, Centre for the Environment, Oxford, UK
9Universidad Nacional de Colombia Sede Amazon´ıa, Leticia, Colombia
10Museu Paraense Emilio Goeldi, Belem, Brazil
11Equipo de Gesti ´on Ambiental, Interconexi ´on El ´ectrica S.A. ISA., Medell´ın, Colombia
12Museo Noel KempffMercado, Santa Cruz, Bolivia
13Universidade Federal de Par ´a, Belem, Brazil
14Department of Earth System Science, University of California, Irvine, CA, USA
15Departamento de Biolog´ıa, Universidad Distrital, Bogot ´a, Colombia
16Max-Planck-Institut f ¨ur Biogeochemie, Jena, Germany
17Abteilung ¨Okologie und ¨Okosystemforschung, Albrecht-von-Haller-Institut f ¨ur Pflanzenwis- senschaften, Universit ¨at G ¨ottingen, G ¨ottingen, Germany
18Departamento de Ciencias Forestales, Univ. Nacional de Colombia, Medell´ın, Colombia
19Center for Applied Biodiversity Science, Conservation Int., Washington D.C., WA, USA
20School of Geography, University of Edinburgh, Edinburgh, Scotland, UK
21Herbario Vargas, Universidad Nacional San Antonio Abad del Cusco, Cusco, Per ´u
22Proyecto Flora del Per ´u, Jard´ın Bot ´anico de Missouri, Oxampapa, Per ´u
23Herbario Nacional del Ecuador, Quito, Ecuador
24Center for Tropical Conservation, Duke University, Durham, NC, USA
25Universidade Federal do Mato Grosso, Cuiaba, Brazil
26Department of Botany, University of Georgia, Athens, GA, USA
27Instituto de Ciencias Naturales, Universidad Nacional de Colombia, Bogot ´a, Colombia
28CIFOR, Tapajos, Brazil
29EMBRAPA Amazonia Oriental, Belem, Brazil
30Departamento de Ci ˆencias da Natureza, Universidade Federal do Acre, Rio Branco, Brazil
BGD
5, 2003–2047, 2008
Amazonian xylem density variation
S. Pati ˜no et al.
Title Page Abstract Introduction Conclusions References
Tables Figures
◭ ◮
◭ ◮
Back Close
Full Screen / Esc
Printer-friendly Version Interactive Discussion 31Facultad de Ciencias Forestales y Ambiental, Universidad de Los Andes, M ´erida, Venezuela
†deceased
Received: 27 February 2008 – Accepted: 10 March 2008 – Published: 9 May 2008 Correspondence to: S. Pati ˜no ([email protected])
2005
BGD
5, 2003–2047, 2008
Amazonian xylem density variation
S. Pati ˜no et al.
Title Page Abstract Introduction Conclusions References
Tables Figures
◭ ◮
◭ ◮
Back Close
Full Screen / Esc
Printer-friendly Version Interactive Discussion
Abstract
Measurements of branch xylem density,Dx, were made for 1466 trees representing 503 species, sampled from 80 sites across the Amazon basin. Measured values ranged from 240 kg m−3 for a Brosimum parinarioides from Tapajos in West Par ´a, Brazil to 1130 kg m−3 for an Aioueasp. from Caxiuana, Central Par ´a, Brazil. Analysis of vari-
5
ance showed significant differences in average Dx across the sample plots as well as significant differences between families, genera and species. A partitioning of the total variance in the dataset showed that geographic location and plot accounted for 33%
of the variation with species identity accounting for an additional 27%; the remaining
“residual” 40% of the variance accounted for by tree to tree (within species) variation.
10
Variations in plot means, were, however, hardly accountable at all by differences in species composition. Rather, it would seem that variations of xylem density at plot level must be explained by the effects of soils and/or climate. This conclusion is sup- ported by the observation that the xylem density of the more widely distributed species varied systematically from plot to plot. Thus, as well as having a genetic component
15
branch xylem density is a plastic trait that, for any given species, varies according to where the tree is growing and in a predictable manner. Exceptions to this general rule may be some pioneers belonging toPourouma and Miconiaand some species within the genera Brosimum, Rinorea and Trichillia which seem to be more constrained in terms of this plasticity than most species sampled as part of this study.
20
1 Introduction
The Amazon Basin remains the home to the most diverse and largest contiguous trop- ical forest on the planet (Malhi and Grace, 2000; Laurance et al., 2004). Different ecological systems and vegetation formations exist within its boundary creating a mo- saic of forests and vegetation types with a floristic complexity the basis of which is still
25
not well understood (Phillips et al., 2003).
BGD
5, 2003–2047, 2008
Amazonian xylem density variation
S. Pati ˜no et al.
Title Page Abstract Introduction Conclusions References
Tables Figures
◭ ◮
◭ ◮
Back Close
Full Screen / Esc
Printer-friendly Version Interactive Discussion
How and why species are distributed and where trees can grow in this mosaic of trop- ical forest types is a central question for tropical ecology (Pitman et al., 2001; Phillips et al., 2003). On the one hand water availability has been considered as an important factor determining tree species distributions at global (Woodward, 1987) and regional scales (Borchert, 1998; Veenendaal and Swaine, 1998; Bongers et al., 1999). Tree
5
physiology data also shows that it may be one key factor determining species distri- butions in tropical rain forest despite the substantial rainfall they receive (Meinzer et al., 1999; Engelbrecht et al., 2002, 2005, 2006, 2007; Tyree et al., 2003; Baltzer et al., 2008). On the other hand, although water shortage (seasonality and rainfall) is not considered by some as an important selective pressure determining the functional
10
composition of moist and wet tropical forest (Baker et al., 2004b; ter Steege and Ham- mond, 2004), it clearly does help to determine overall diversity and distribution patterns of canopy tree genera across the Amazon basin (ter Steege et al., 2006). Light as a factor explaining coexistence of trees has also been considered (Poorter and Arets, 2003) and climate more than geographic distance in lowland forest seems also to af-
15
fect species composition (Pitman et al., 2001) and distributions (Bongers et al., 1999;
Baltzer et al., 2008). Additionally, even if there clearly is some “distance-decay” i.e. the similarity between two sites declines as the distance between them increases, see (Soininen et al., 2007) in Amazonian forest communities (Condit et al., 2002; Tuomisto et al., 2003), consistent with the view of plant species distribution as a partly random
20
controlled process (Hubbell, 2001), it is also clear that substrate-mediated processes play a significant deterministic role in controlling species distributions across Amazo- nian landscapes (Gentry, 1988; Tuomisto et al., 1995, 2003; Phillips et al., 2003), this also being the case for other tropical forests (Harms et al., 2001; Robert et al., 2007).
These theories are by no means exclusive, and one of the main purposes of the work
25
described in this special issue (Lloyd et al., 2008a1) was to interface dedicated plant physiological trait data with species abundance, climate and soil type information to
1Lloyd, J., Grace, J., and Meir, P.: Introducing the “Biogeochemistry and Function of Amazon Forest” project, Biogeosciences Discuss., in preparation, 2008a.
2007
BGD
5, 2003–2047, 2008
Amazonian xylem density variation
S. Pati ˜no et al.
Title Page Abstract Introduction Conclusions References
Tables Figures
◭ ◮
◭ ◮
Back Close
Full Screen / Esc
Printer-friendly Version Interactive Discussion
help understand the underlying factors controlling species distribution, composition and stand dynamics at the Basin-wide scale. In what is the first of a series of papers, we here analyse in detail geographic and taxonomic patterns of tree branch wood density across Amazonia. Although wood density (Dw) is most often measured on tree boles sampled after destructive harvesting, often in association with commercial operations
5
(Baker et al., 2004b; Chave et al., 2006), here we have used an alternative approach – the sampling of the density of the functional xylem or sapwood of small (ca. 1.5 cm diameter) branches. This measurement, referred here as “xylem density”,Dx, is a plant trait usually considered in physiological processes studies; for example when looking at wood properties in relation to transpiration, stem water storage capacity, cavitation
10
resistance, mechanical support, photosynthesis and/or growth (Niklas, 1997; Enquist et al., 1999; Stratton et al., 2000; Hacke et al., 2001; Meinzer, 2003; Bucci et al., 2004;
Santiago et al., 2004; Jacobsen et al., 2007a, 2007b; Pratt et al., 2007; Scholz et al., 2007). We rationalised that these are all processes that should be expected to influ- ence where a given tree species can survive and thus should ultimately contribute to
15
the shaping of species distributions across landscapes.
For any given species Dx and Dw should be related as both reflect an individ- ual species’ water transport strategy and the invariable trade-off against mechanical strength (Taneda and Tateno, 2004; Wagner et al., 1998; Asner and Goldstein, 1997).
But Dw may well be affected by factors in addition to those modulating Dx. For ex-
20
ample it may also reflect differences in the storage of resins and/or increased of sec- ondary compounds of bole heartwood with time, different biomechanical requirements for maintaining vertical position and support of the whole tree and individual branches, also generally reflecting the longer term growth history of the tree. It means that,Dw may be considered to effectively integrate plant ontogeny, edaphic and climatic effects
25
over a plant’s lifetime.
It has long known thatDwis a genetically conserved trait, and this characteristic has been used extensively in tree breeding (Yang et al., 2001) also leading to studies of its phylogenetic inheritance (Enquist et al., 1999; Chave et al., 2006). Nevertheless, it has
BGD
5, 2003–2047, 2008
Amazonian xylem density variation
S. Pati ˜no et al.
Title Page Abstract Introduction Conclusions References
Tables Figures
◭ ◮
◭ ◮
Back Close
Full Screen / Esc
Printer-friendly Version Interactive Discussion
also long been known that for a given tree species, marked variations may be observed attributable to differences in site quality and/or forest type. There have already been several reports of variations with site/growth conditions of order 10% for plantation trop- ical tree species (Roque, 2004; Erskine et al., 2005). Similarly, site specific differences have been noted when comparing the same species growing in different forests or site
5
conditions (Gonzalez and Fisher, 1998; Woodcock et al., 2000; Muller-Landau, 2004;
Parolin and Ferreira, 2004; Roque, 2004; Nogueira et al., 2005; Nogueira et al., 2007).
LowerDwis often associated with early and secondary succession vegetation (Saldar- riaga 1989; Woodcock et al., 2000) and higher growth rates (Wiemann and Williamson, 1989; Erskine et al., 2005; Nogueira et al., 2005; King et al., 2005, 2006).
10
We thus hypothesised that Dx is a “plastic” trait that reflects both phylogenetic her- itage of trees and overall site conditions. Therefore variations inDx at the stand level across Amazonia should not only reflect differences in species composition, but differ- ences in soil and climate conditions. If a given species can grow in different sites,Dxof that species may converge to an “average” value of that of co-occurring species within
15
each site. If this is true, species with enough phenotypic plasticity can occupy more and larger areas and become more common than species with small plasticity which will occupy restricted areas and become “rare” species at a large-scale but common in just one site.
2 Methods
20
2.1 Study sites
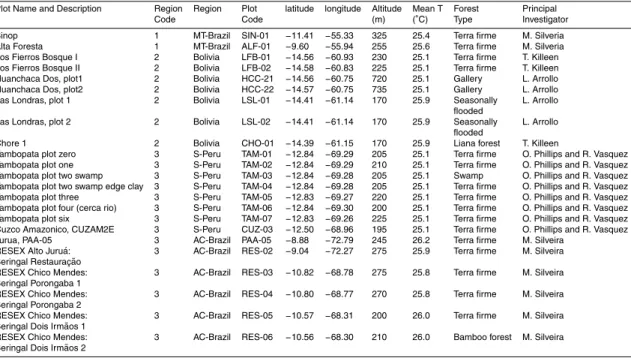
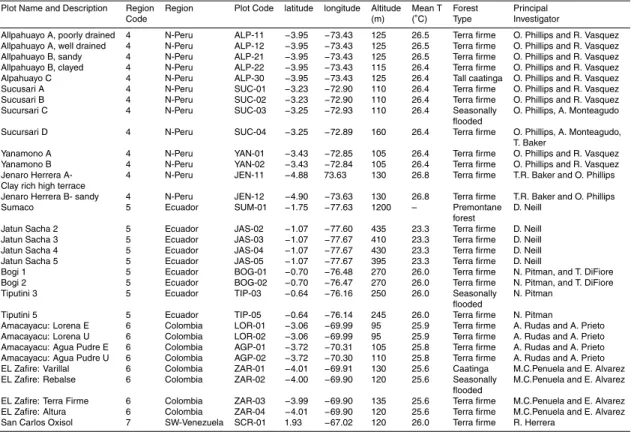
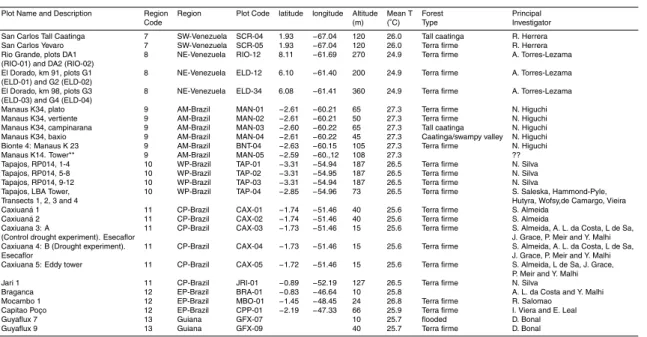
Eighty forest plots from across the Amazon basin were sampled normally, at the end of the rainy season of the region between January 2001 and December 2005. Addi- tionally, two plots were sampled in Paracou, French Guiana in September 2007 (see details below). These plots form part of the RAINFOR project (www.rainfor.org; Malhi
25
et al., 2002) and span local, regional and Basin-wide environmental gradients. Many 2009
BGD
5, 2003–2047, 2008
Amazonian xylem density variation
S. Pati ˜no et al.
Title Page Abstract Introduction Conclusions References
Tables Figures
◭ ◮
◭ ◮
Back Close
Full Screen / Esc
Printer-friendly Version Interactive Discussion
of the plots have been described in detail elsewhere (Baker et al., 2004a, b; Malhi et al., 2002; Phillips et al., 2004; Vinceti, 2003) and Appendix A lists all the plots visited, including those not previously described and in some cases with updated information.
2.2 Sampling of plant material
Normally, around 20 trees greater than 10 cm dbh (diameter at breast height i.e. at
5
1.3 m from the base of the tree) were chosen in each plot. On some occasions, for instance when plots were unusually heterogeneous, as a consequence of topographic variations and/or shape (i.e. 1000×10 m) more trees were sampled (for example Bogi plots in Ecuador). For two of the Caxiuana plots (Central Par ´a, Brazil) we had sampled in two consecutive years (2002 and 2003) and since there was no statistical difference
10
inDx for the two years, we merged the data in just one set. When a plot was clearly composed of different defined landscapes, and each landscape was considered as an individual plot with often less than 20 trees sampled within it (e.g. Jacaranda Plots, Km 34 Manaus, Brazil).
Trees were not chosen completely at random but taking into account two factors.
15
First, often there was a selection of three to six contrasting areas (slopes, valleys, gaps, flood, etc) where these were present, a professional tree climber then choose a “climbable tree” within the generally identified areas. Naturally, this “climbable tree”
varied from climber to climber according to the technique employed and overall climbing skills. Nevertheless a general rule was that the “climbable tree” was>10 cm dbh with
20
at least some neighbouring trees reachable by a clipper pole. From the climbed tree, the climber sampled one branch from each of the upper, (exposed to the sun), middle (semi light) and lower crown (shade), and one branch from the upper crown of the (usually three to five) surrounding trees.
The only difference for this sampling strategy was for two of the Guyaflux plots at
25
Paracou, French Guiana where only lower branches from subcanopy trees were sam- pled. An analysis of over 200 trees comparingDx of branches from the upper, middle
BGD
5, 2003–2047, 2008
Amazonian xylem density variation
S. Pati ˜no et al.
Title Page Abstract Introduction Conclusions References
Tables Figures
◭ ◮
◭ ◮
Back Close
Full Screen / Esc
Printer-friendly Version Interactive Discussion
and lower crown of the trees using the techniques described in Lloyd et al. (2008b)2 has, however, shown no statistically significant effect of height onDx(data not shown).
The subcanopy trees sampled at Paracou represented the distribution of the main fam- ilies present in those plots withDxshowing the same distribution of frequencies found forDwof 309 trees from Paracou (J. Beauchen, personal communication). In any case,
5
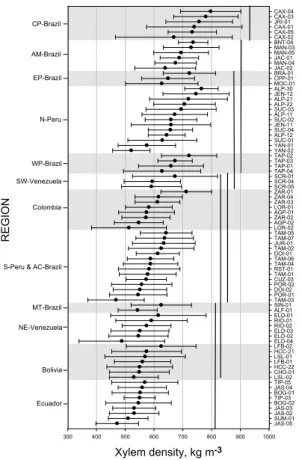
because these measurements were made after the main analysis of this paper we have simply included these values to help illustrate regional patterns (Fig. 1).
2.3 Species identification
Details of the species identification from the permanent plots are described elsewhere (Baker et al., 2004b) and in this work we have used the new classification given by the
10
Angiosperm Phylogeny Group II (APG 2003,http://www.mobot.org/MOBOT/Research/
APweb/), in whichBombacaceae,Sterculiaceae, andTiliaceae are all included in the Malvaceae; Papillionaceae, Caesalpinaceae, and Mimosaceae are included in the Fabaceae;Cecropiaceaein theUrticaceae; andFlacoutiaceaein theSalicaceae.
2.4 Xylem density determinations
15
A pair of stem segments of 0.05 to 0.1 m long and 0.01 to 0.02 m diameter were cut from each branch after harvesting and immediately placed in plastic bags to avoid des- iccation and returned to the laboratory or field station. Normally within 12 h of sampling (but sometimes as long as 36 h later) the outer bark and phloem were removed from one of the two sample stems and its fresh volume calculated from its stem length and
20
the average diameter of the two equiaxial diameters at each end. When the pith was wider than 2 mm diameter the stem was cut into a small segment (0.02 to 0.05 m long)
2Lloyd, J., Pati ˜no, S., Paiva, R. Q., Nardoto, G., Quesada, C. A., Santos, A. J. B., Baker, T. R., Brand, W. A., Hilke, I., Gielmann, H., Raessler, M., and Mercado, L. M.: Gradients in leaf physiological properties within Amazon forest canopies, Biogeosciences Discuss., in preparation, 2008b.
2011
BGD
5, 2003–2047, 2008
Amazonian xylem density variation
S. Pati ˜no et al.
Title Page Abstract Introduction Conclusions References
Tables Figures
◭ ◮
◭ ◮
Back Close
Full Screen / Esc
Printer-friendly Version Interactive Discussion
and the pith removed with a small screw driver or scalpel. When the pith was thinner than 2 mm it was not removed from the stem (as it was thus assumed to be of negligible mass) but its volume subtracted from the volume of the stem without bark. Pith volume was calculated by measuring the average diameter (two measurements of diameter at each end of the stem) and stem length. All stems were then dried at 70–90◦C for three
5
to four days (to constant mass) and weighed. Xylem density,Dx, was then determined as the dry mass divided by the green volume of the sample.
2.5 Statistical analysis
Basic statistics shown in Figs. (1), (2), and (3) were performed with Minitab 14 (Minitab Inc.). All Standard Major Axis Regression analysis (Fig. 5) were done using SMATR
10
(Warton et al., 2006). Variance partitioning for Fig. 4 was accomplished by applying Residual Error Maximum Likelihood (REML) analysis (Gilmour et al., 1995) employing GENSTAT Discovery Edition. Mixed-effect modelling (Fig. 6) was carry out with the
“lmne” package (Bates et al., 2007) and rank-based linear regression (Fig. 7) accom- plished as in Terpstra and McKean (2005), both using the “R” statistical computing
15
package (R Development Core Team, 2007). For the latter analysis, we applied the
“high-breakpoint” option (Chang et al., 1999) to account for the possibility of “contam- inated” data having been included in any of the Dw values assimilated from a wide range of sources into the RAINFOR “wood density” database.
In order to determine the extent to which Dx changes in a given species within the
20
same plot and between plots, IPP, index of phenotypic plasticity (Valladares et al., 2000), was calculated as the absolute difference between the maximum value and the minimum value divided by the maximum value.
BGD
5, 2003–2047, 2008
Amazonian xylem density variation
S. Pati ˜no et al.
Title Page Abstract Introduction Conclusions References
Tables Figures
◭ ◮
◭ ◮
Back Close
Full Screen / Esc
Printer-friendly Version Interactive Discussion
3 Results
We measuredDx of 1466 trees from 80 plots across the Amazon basin (Appendix A) http://www.biogeosciences-discuss.net/5/2003/2008/bgd-5-2003-2008-supplement.
pdf. Data for Dx followed a normal distribution with a mean value of 620 kg m−3; normality test (StDev=0.13,N=1466, AD=1.82P <0.001).
5
Of all the trees sampled, 92% (1352) had been identified to the family level, 86%
(1258) to the genus level, and 69% (1006) to the species level. The trees sampled accounted for 58 families, representing 40% of the total number of families present in the neotropics (Mass and Westra, 1993) with 249 genera, and 503 species being sam- pled. The most common families sampled were Fabaceae, Sapotaceae, Moraceae,
10
Lecythidaceae, Burseraceae, Myristicaceae, Lauraceae, Euphorbiaceae, Chrysobal- anaceae, Annonaceae; with the most common genera being Eschweilera, Pouteria, Protium, Inga, Licania, Pseudolmedia, Virola, Pourouma, Miconia. The most com- mon species were Eschweilera coriacea, Pseudolmedia laevis, Rinorea guianensis, Tetragastris altissima,Minquartia guianensis,Pourouma guianensis, andPseudolme-
15
dia macrophylla. We had 20 undetermined Protium sp., 17Pouteria sp., 14Inga sp., 11Ocoteasp., 10Eschweilerasp.
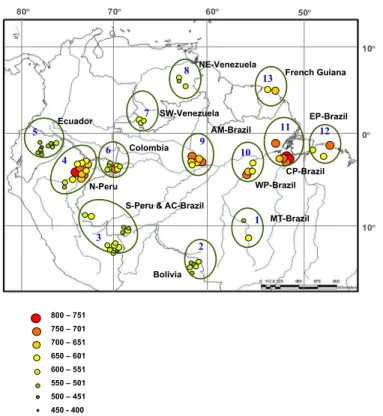
3.1 Geographic variation
Arithmetic meanDx for the 80 plots are shown in Fig. 1, which also shows our separa- tion into 13 specified geographical regions and used for subsequent analysis.
20
From Fig. 1 a gradient of increasingDx from south and north towards the Amazon River is apparent with highDx being concentrated along the river itself. Plots located close to the Andes tend to have the lowestDx. For example, all plots in Ecuador, some in North Per ´u, South Per ´u and Bolivia had a relatively low Dx compared to plots in Colombia and North Per ´u which were all at a lower altitude and closer to the Amazon
25
River (see Appendix A). Similar patterns of lowDw in forests close to the Andes have previously been reported (Chave et al., 2006; Baker et al., 2004b; ter Steege et al.,
2013
BGD
5, 2003–2047, 2008
Amazonian xylem density variation
S. Pati ˜no et al.
Title Page Abstract Introduction Conclusions References
Tables Figures
◭ ◮
◭ ◮
Back Close
Full Screen / Esc
Printer-friendly Version Interactive Discussion
2006). Taking the basin as a whole (no division into regions), statistically significant differences existed between plot means (P <0.001) ranging from 800±50 kg m−3 (±
standard deviation) at the dry experiment plot at Caixuana (Projecto Secaflor), CAX- 04, with the nearby control plot CAX-03 being the second highest at 780±120 kg m−3. These are both terra firme forests located in Central Par ´a, Brazil (CP-Brazil region).
5
The lowest plot means were for TAM-03 a swamp forests in Tambopata, South Per ´u (S-Per ´u & AC-Brazil region) and JAS-05 a forest growing on recently deposited river sediments (fluvisol) in Jatun Sacha in the Ecuador region. Both these plots had a mean Dx of 470 kg m−3. Data for all 80 plots are summarised in Appendix B.
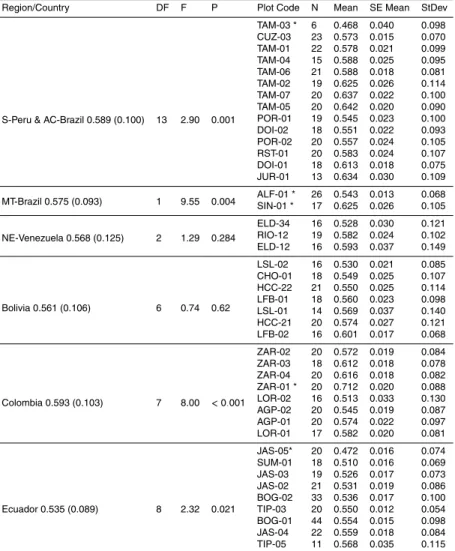
Figure 2 gives means (±standard deviations) for all plots, grouped according to re-
10
gion, with regions being presented sequentially from top to bottom according to the overall meanDxfor the trees sampled within them. This shows that, although consid- erable plot-to-plot variation existed within regions (e.g. N. Per ´u and Colombia) large statistical differences between regions also existed (P <0.001). Of these, the highest overall value was for Central Par ´a in Brazil (760±130 kg m−3,N=144) which had sig-
15
nificantly higher Dx (Tukey Test) than the rest of the regions while Ecuador had the lowest overall values (540±92 kg m−3). Nevertheless, this region did not differ signif- icantly from Acre, Mato Grosso (Brazil), Colombia and Bolivia. Within some regions:
PC-Brazil, PE-Brazil, N-Per ´u, PW-Brazil, Colombia, S-Per ´u, MT-Brazil, and Ecuador meanDxof plots varied considerably (Appendix B), while in some regions Bolivia, AC-
20
Brazil, NE-Venezuela, SW-Venezuela, plots were not significantly different from each other.
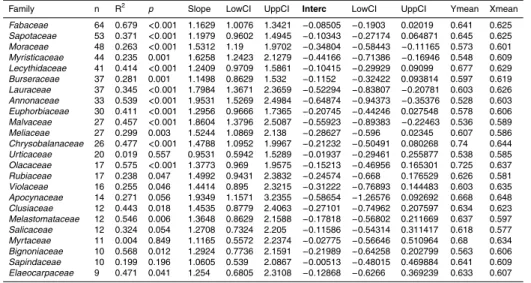
3.2 Taxonomic variation
In a similar manner to the Region/Plot analysis above, variation inDxat the family and genera level is summarised in Fig. 3. Overall there were significant differences between
25
the families sampled (F=8.08DF=57P <0.001). Families withDxhigher than the basin mean wereOlacaceae, Celastraceae,Chrysobalanaceae, Humiriaceae,Ochnaceae, Linaceae, Scrophulariaceae, Myrtaceae, and Lecythidaceae (Fig. 3). Families with
BGD
5, 2003–2047, 2008
Amazonian xylem density variation
S. Pati ˜no et al.
Title Page Abstract Introduction Conclusions References
Tables Figures
◭ ◮
◭ ◮
Back Close
Full Screen / Esc
Printer-friendly Version Interactive Discussion
lower Dx were Boraginaceae, Bixaceae, Sabiaceae, Lepidobotryaceae, Lacistemat- aceae, Rhamnaceae, Malvaceae, Annonaceae, Myristicaceae, Urticaceae, Vochysi- aceae,Araliaceae,Dichapetalaceae,Bignoniaceae, andEuphorbiaceae. The remain- ing families all contained genera characterised by both high and lowDx and include some of the most abundant families across the basin: Fabaceae, Rubiaceae, Lau-
5
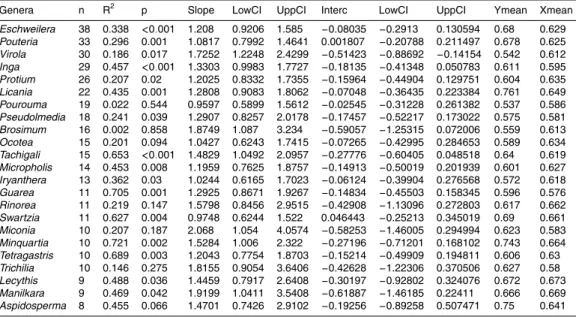
raceae, Sapotaceae, Apocynaceae (Fig. 3). There were also significant differences between genera (F=3.78DF=249 P <0.0001) with the highest density genera being Aiouea,Callichlamys,Pithecellobium,Vatairea,Stachyarrhena,Dipteryx,Machaerium.
The genera with lower density wereAnnona,Matisia,Tetrorchidium,Collophora,Ony- chopetalum,Hyeronima,Luehea.
10
3.3 Partialling out geographical and taxonomic differences
In order to apportion the total variance in the dataset observed (Searle et al., 2006) into geographical and taxonomic components, we used Residual Maximum Likelihood (REML) Analysis to fit a model according to
D=µ+r/p+f /g/s+ε (1)
15
whereµrepresents the overall mean of the dataset (620 kg m−3); effects of location are incorporated in the termr/p,which denotes that within each region (r) are nested more than one plot (p); genetic effects are represented by the termf/g/s, which denotes that within each family (f) are nested various genera (g), within which are nested several species (s); and (ε) represents the residual variance. All effects were taken as random
20
variables, as we had sampled only a limited subset of plots within distinct but not com- prehensive regions; also sampling a more or less random (and incomplete) selection of Amazon families, genera and species.
Results of this analysis are shown in Fig. 4. Taken together, the geographical param- eters (region and plot) accounted for 33% of the total variation with 26% of this being
25
attributable to between region variations (this effectively representing the average vari- ation between plots in any one region). Taxonomic variability inDx, was inferred as
2015
BGD
5, 2003–2047, 2008
Amazonian xylem density variation
S. Pati ˜no et al.
Title Page Abstract Introduction Conclusions References
Tables Figures
◭ ◮
◭ ◮
Back Close
Full Screen / Esc
Printer-friendly Version Interactive Discussion
27% of the total variability in the dataset, with species and family accounting for about 10% and genus per se accounting only for 6%. Overall, the proportion of the vari- ance in the dataset that remained unexplained was 40%, this also being the “residual variance” reflecting within tree variation (only one branch per tree was sampled), tree- to-tree variation and also may reflect measurement errors. Note that in this analysis we
5
only included species that were observed to occur in more than one site and included families and genera for which more than one species had been sampled. The analysis presented here for Dx differs from others (Chave et al., 2006; Baker et al., 2004b) in that we have not taken overall means for each species; but rather included intra-specific variation and the possibility of systematic plot-to-plot variations in our interpretation.
10
Figure 4 suggests that geographic location is as important, if not more important than taxonomic identity in determining the value ofDx observed for any given tree but with considerable variation accountable for by neither. This point is demonstrated further in Fig. 5, where we have taken the more widely abundant families, genera and species in our data set and plotted the values observed in all plots were they were sampled
15
as a function of the average tree density of all other trees sampled in the same plot.
Detailed results from this analysis (which also included a consideration of likely errors in both mean plot and mean family/genus/species values for that plot) are also given in Appendix C.
Figure 5A shows that nearly all families examined converged to a statistically signifi-
20
cant trend for an increase in the averageDxobserved with a slope close to 1:1 as the values observed by other families at that site also increased. Likewise the same trend was observed when different genera were examined (Fig. 5B) and, somewhat surpris- ingly, also for species (Fig. 5C). Notable exceptions did however exist for the families Urticaceae(Fig. 4A, panel M) the family containing the genusPouroumawhich almost
25
entirely consist of pioneer species (Withmore 1989) andMyrtaceae (Fig. 4A, panel U) which in our data set includes the generaEugenia and Myrcia. Likewise at the genus levelPouroumaandBrosimumalso seemed to vary less than all the genera examined.
The relationships forMiconia and Trichilia were also not highly significant (Appendix
BGD
5, 2003–2047, 2008
Amazonian xylem density variation
S. Pati ˜no et al.
Title Page Abstract Introduction Conclusions References
Tables Figures
◭ ◮
◭ ◮
Back Close
Full Screen / Esc
Printer-friendly Version Interactive Discussion
C). Figure 5C shows the same trend for the species examined. Nearly half of the species examined showed significant relationships. Non significant relationships might be related to the “pioneer” character of the examined species i.e. Pourouma minor, Pourouma guianensis and perhaps to the reduced number of plots where they were collected and use for this analysis (Appendix C).
5
3.4 Geographical and taxonomic contributions to stand level differences
In order to evaluate the extent to which overall plot-to-plot variations might be account- able in terms of geographical versus taxonomic effects, we utilised estimates of the individual plot and species effects from Eq. (1) and compared them to direct stand level calculations. This was achieved by first estimating the average value for each species
10
within each plot and then obtaining a weighted average value forDx for that plot ac- cording to the observed abundance of each species within it, denoted here ashDxi.
A similar calculation was done for the REML “species effects” which are plotted along with REML fixed plot effects (ther/pterm from Eq. (1) as a function of hDxi in Fig. 6.
This analysis shows that by far the majority of the variation inhDxi was accountable
15
in terms of plot-to-plot differences, with the plot effects increasing almost linearly with hDxiwith a slope close to 1.0. By contrast the species (i.e.f /g/s) effects were more or less constant (and close to zero) forhDxi>ca. 550 kg m−3, although declining slightly thereafter. We treated our plot term as a fixed effect for the analysis in Fig. 6 (as op- posed to a random effect in Fig. 4), as this permitted us to allow for different plots to
20
have different intrinsic variances which were broadly consistent with difference of plot topographic and soil heterogeneity, also removing a slight bias in residuals which was present when treating ther/pterm as random.
3.5 Phenotypic plasticity
In order to determine inter and intra-specific variation we compared the IPP of the
25
same species collected several times within one plot and in many plots. The IPP of one 2017
BGD
5, 2003–2047, 2008
Amazonian xylem density variation
S. Pati ˜no et al.
Title Page Abstract Introduction Conclusions References
Tables Figures
◭ ◮
◭ ◮
Back Close
Full Screen / Esc
Printer-friendly Version Interactive Discussion
species collected in more than two plots (mean=0.29±0.12, N=86) was significantly higher (mean=0.14±0.10,N=86) than the variation of the same species collected more than twice within one plot (DF=1,F=77.94,P <0001).
4 Discussion
Our results show that there is a large variation of branch xylem density across Amazo-
5
nia and that considerable plasticity occurs for many species growing in different forests.
This suggests that branch xylem density may not be a simple genetically inherited trait that is predictable on the basis of the knowledge of plant taxonomy alone, and that across basin patterns may not be only explained by patterns of species composition and abundance as has been previously suggested for bole wood density (Enquist et al.,
10
1999; Baker et al., 2004b; Chave et al., 2006). But, knowledge of the site conditions is also necessary. For example, irrespective of the genotypic level examined (Fig. 5C),Dx observed varied by as much as 400 kg m−3 across sites. Moreover, this variation was systematic with different trees sampled within a given family/genus/species tending to have higher values ofDx along with other trees in the same plot (and vice versa).
15
Additional evidence for widespread plasticity comes from the REML variance par- titioning of Fig. 4 in which the combined effects of Region/Plot are shown to have contributed to about the same proportion of the overall variation in the data set as did Family/Genus/Species. This result differs significantly from those forDw (Baker et al., 2004b).
20
Nevertheless, when our species level means forDx are examined as a function of species mean Dw using an expanded database from that presented in (Baker et al., 2004b) then there is reasonably good relationship (Fig. 7a). And the averageDx for this study, 620 kg m−3is also very similar to previous values reported forDwfor Ama- zonia. For example (Brown and Lugo, 1984) estimated 620 kg m−3 as the average
25
wood density of tropical America, (Chave et al., 2006) reported 650 kg m−3for Central and South America together and (Baker et al., 2004b) estimated 620 kg m−3 as the
BGD
5, 2003–2047, 2008
Amazonian xylem density variation
S. Pati ˜no et al.
Title Page Abstract Introduction Conclusions References
Tables Figures
◭ ◮
◭ ◮
Back Close
Full Screen / Esc
Printer-friendly Version Interactive Discussion
overall species-level mean for Amazonia.
As reflected in Fig. 7b, our results do, however, differ from the above authors in that much of the variation inDwis attributed to genotype while in our case, variations inDx does include site and genetic variations. This difference is understandable, as there is a strong tendency of many species, genera and even families to be geographically
5
confined to certain areas of the Basin (ter Steege et al., 2006). Thus, if there is equiva- lence betweenDxandDwwhat appears to be a genetic effect for the latter, may in fact be mostly a geographic (site and regional) effect attribute to variations in soils, climate and/or geological origin. In that respect it is only by studying replicated species grow- ing across a wide range of environments that we have been able to show the strong
10
environmental influence onDx (and by implicationDw). In essence the REML species effect in Fig. 7b represents the inferred value that each species would have were it to be found on some sort of “overall average site”.
Also worth noting is that, in contrast to the general trend, pioneer species (Whitmore 1989) -either short and long-lived such as within the generaPourouma, (Urticaceae)
15
andMiconia(Melastomataceae) and some species belongingBrossimum(Moraceae), Trichillia(Meliaceae) andMyrcia (Myrtaceae) among others, often associated to sec- ondary vegetation and/or late stages of forest succession (Banana and Tweheyo, 2001;
Pe ˜na-Claros, 2003; Vieira et al., 2003; Poorter et al., 2006; Viera and Proctor, 2007;
Selaya and Anten, 2008)., showed little tendency to exhibit variation inDx across the
20
sites where they were found. This brings the question whether species showing little phenotypic plasticity and intermediateDxvalues even when present in sites with rela- tive low or high xylem density are more restricted to specific edaphic and microclimatic conditions that sustain colonisation and fast growth i.e. gaps with enough water sup- ply from the soil, light, and nutrients. Also, it is worth noticing that species such as
25
Pourouma minor and P. guianensis, which are generally considered low density-fast- growing species; were by far the species with the lowest densities in our study; xylem density varied from 410 to 690 kg m−3, being comparable to any slow-growth old forest species in our data set.
2019
BGD
5, 2003–2047, 2008
Amazonian xylem density variation
S. Pati ˜no et al.
Title Page Abstract Introduction Conclusions References
Tables Figures
◭ ◮
◭ ◮
Back Close
Full Screen / Esc
Printer-friendly Version Interactive Discussion
But why should such plasticity inDxgenerally occurs? Most likely it is related to vari- ation in resource availability and/or different site dependent soil physical characteristics and hydrological constraints to plant function. There is already abundant evidence of this from across a range of species, environments and controlled experiments (Sabatier et al., 1997; Laurance et al., 1999; Hacke et al., 2000; Vormisto et al., 2000; Pelissier
5
et al., 2002; Baraloto and Goldberg, 2004; Kursar et al., 2005; Baraloto et al., 2007;
Madelaine et al., 2007). Further evidence of the influence of site conditions on Dx of trees comes from our own data. For example, in a Mangrove forest in East Par ´a, Brazil (EP-Brazil, BRA-01, Appendix A). There, only two species were sampled (10 individuals per species)Avicennia germinansandRhizophora manglewhich meanDx
10
were 722±87 kg m−3and 723±99 kg m−3 respectively. The two species are not phylo- genetically related since they belong to two different families (Scrophulariaceae and Rhizophoraceae) and two different orders (Lamiales andMalpighiales). Nevertheless they converge to an almost identicalDx. An analysis of the most variable species in our data set Protium paniculatum (IPP=0.66), collected in two different plots in Caxi-
15
uana (Par ´a, Brazil): CAX-02 (Dx=280 kg m−3) and CAX-04 (Dx=800 kg m−3), andPere- bea tessmannii (IPP=0.58) two samples collected in the same plot but 900 m apart in BOG-01 with 320 and 760 kg m−3, in both cases low pH, high proportion of sand and low minerals concentrations were be associated with the trees exhibiting highDx(Que- sada et al., 20083; Pati ˜no et al., 2008a4). Hacke et al. (2000) have shown remarkable
20
3Quesada, C. A, Lloyd, J., Schwarz, M., Baker, T. R., Pati ˜no, S., Czimczik, C., Schmerler, J., Hodnett, M., Arneth, A., Lloyd, G., Dezzeo, N., Gasior, R., Herrera, R., Hilke, I., Kuhlmann, I., Phillips, O., Raessler, M., Chaves, E., Cruz, O., Filho, J. M., Luiz ˜ao, F. J., Pimentel, T., Santos, A. J. B., Almeida, S., Alvarez, E., Arroyo, L., Higuchi, N., Jimenez, E. M., Lezama, A. T., Neill, D. A., Paiva, R., Priante Filho, N., Silva, N., Silveira, M., Prieto, A., Rudas, A., and Vieira, I.: Chemical and physical properties of Amazonian forest soils in relation to their genesis, Biogeosciences Discuss., in preparation, 2008.
4Pati ˜no, S., Lloyd, J., Quesada, C. A., Paiva, R. Q., et al.: Factors influencing observed vari- ation of branch xylem density across the Amazon basin, Biogeosciences Discuss., in prepara-
BGD
5, 2003–2047, 2008
Amazonian xylem density variation
S. Pati ˜no et al.
Title Page Abstract Introduction Conclusions References
Tables Figures
◭ ◮
◭ ◮
Back Close
Full Screen / Esc
Printer-friendly Version Interactive Discussion
influence of soil texture and porosity on the hydraulic properties ofPinus taeda.
In conjunction with concurrent measurements of associated foliar physiological char- acteristics undertaken on leaves from the branches with which Dx was determined in this study (Lloyd et al., 2008c5) as well as associated soil physical and chemical characteristics (Quesada et al., 20086), further papers in this series consider the un-
5
derlying factors contributing to the strong site effects in Fig. 6 (Pati ˜no et al., 2008a4), along with the extent to which these site dependent variations in xylem density reflect a co-ordinated physiological response of different Amazonian tree species to variations in their growth environment (Pati ˜no and Lloyd, 2008b7).
Appendix A
10
More precise coordinates will be available (Anderson and Malhi, 20088). Abbrevia- tions in regions are: AC=Acre, AM=Amazonas, MT=Mato Grosso, CP=Central Par ´a, EP=East Par ´a, WP=West Par ´a, N=North, S=South, NE=North East, SW=South tion, 2008a.
5 Lloyd, J., Pati ˜no, S., Paiva, R. Q., Quesada, C. A., Baker, T. R., and Mercado, L. M.:
Basin-wide variations in foliar properties of Amazon forest trees, Biogeosciences Discuss., in preparation, 2008c.
6Quesada, C. A., Lloyd, J., Schwarz, M., Baker, T. R., Pati ˜no, S., Czimczik, C., Schmerler, J., Hodnett, M., Arneth, A., Lloyd, G., Dezzeo, N., Gasior, R., Herrera, R., Hilke, I., Kuhlmann, I., Phillips, O., Raessler, M., Chaves, E., Cruz, O., Filho, J. M., Luiz ˜ao, F. J., Pimentel, T., Santos, A. J. B., Almeida, S., Alvarez, E., Arroyo, L., Higuchi, N., Jimenez, E. M., Lezama, A. T., Neill, D. A., Paiva, R., Priante Filho, N., Silva, N., Silveira, M., Prieto, A., Rudas, A., and Vieira I.: Chemical and physical properties of Amazonian forest soils in relation to their genesis, Biogeosciences Discuss., in preparation, 2008.
7Pati ˜no, S. and Lloyd, J.: Integration of branch xylem density variations into the tropical tree physiological spectrum, Biogeosciences Discuss., in preparation, 2008b.
8Anderson, L. O. and Malhi, Y.: Landscape patterns of forest biophysical measurements in eastern and western Amazonia, Biogeosciences Discuss., in preparation, 2008.
2021
BGD
5, 2003–2047, 2008
Amazonian xylem density variation
S. Pati ˜no et al.
Title Page Abstract Introduction Conclusions References
Tables Figures
◭ ◮
◭ ◮
Back Close
Full Screen / Esc
Printer-friendly Version Interactive Discussion
West,. ** not a permanent plot, samples were taken from trees around the Eddy covari- ance tower. Additional information of plots may be found in: (Malhi et al., 2002, 2003;
Baker et al., 2004; Vinceti, 2003).
Appendix B
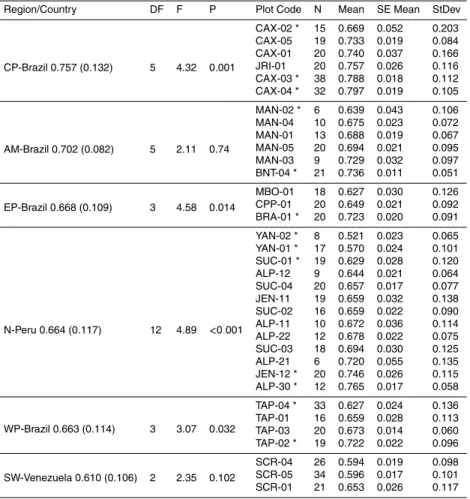
Variation ofDx within regions. In the first column the number below the name of the
5
country is the mean followed by the standard deviation in parenthesis. DF=degrees of freedom;F=statistical values,P=probability, N=number of samples,SE=standard error of mean. * means “significantly different”.
Appendix C
Regression analysis outputs for family (D1) genera (D2) and species (D3). See
10
Figs. (5A), (5B) and (5C). Notice that for this Appendix units forDxare given in g cm−3. Acknowledgements. We wish to thank M. Wagner for his help “cleaning up” our data set and for his useful comments that improved the quality of the present manuscript and N. Fyllas for advice on statistical analysis. We also thanks the students from the FTH module in UMR- ECOFOG 2007: E. Alberny, S. Dutrey, J. Fournier, H. Richard for help in sampling the French
15
Guiana plots and the VPN Corporation for making available Genstat Discovery Edition for SP when she was working in Colombia. We thank J. Stropp for help with the elaboration of the map shown in Fig. 1 and N. Rowe for comments that improved the last version of the present manuscript. Finally, we dedicate this work to the memory of our friend and colleague A. Santos.
References
20
Asner, G. P. and Goldstein, G.: Correlating Stem Biomechanical Properties of Hawaiian Canopy Trees with Hurricane Wind Damagein, Biotropica, 29, 145–150, 1997.
BGD
5, 2003–2047, 2008
Amazonian xylem density variation
S. Pati ˜no et al.
Title Page Abstract Introduction Conclusions References
Tables Figures
◭ ◮
◭ ◮
Back Close
Full Screen / Esc
Printer-friendly Version Interactive Discussion
Baker, T. R., Phillips, O. L., Malhi, Y., Almeida, S., Arroyo, L., Di Fiore, A., Erwin, T., Higuchi, H., Killeen, T. J., Laurance, S. G., Laurance, W. F., Lewis, S. L., Monteagudo, A., Neill, D. A., Nu ˜nez Vargas, P., Pitman, N. C. A., Silva, J. N. M., and V ´asquez Martines, R.: Increasing biomass in Amazonian forest plots, Philos. Trans. R. Soc. London, Ser. B, 359, 353–365, 2004a.
5
Baker, T. R., Phillips, O. L., Malhi, Y., Almeida, S., Arroyo, L., Di Fiore, A., Erwin, T., Killeen, T. J., Laurance, S. G., Laurance, W. F., Lewis, S. L., Lloyd, J., Monteagudo, A., Neill, D. A., Pati ˜no, S., Pitman, N. C. A., Silva, J. N. M., and V ´asquez Martines, R.: Variation in wood density determines spatial patterns in Amazonian biomass, Global Change Biol., 10, 1–18, 2004b.
10
Baltzer, J. L., Davies, S. J., Bunyavejchewin, S., and Noor, N. S. M.: The role of desiccation tolerance in determining tree species distributions along the Malay–Thai Peninsula, Funct.
Ecol., 22, 221–231, 2008.
Banana, A. Y. and Tweheyo, M.: The ecological changes of Echuya afromontane bamboo forest, Uganda, Afr. J. Ecol., 39, 366–373, 2001.
15
Baraloto, C. and Goldberg, D. E.: Microhabitat associations and seedling bank dynamics in a neotropical forest, Oecologia, 141, 701–712, 2004.
Baraloto, C., Morneau, F., Bonal, D., Blanc, L., and Ferry, B.: Seasonal water stress tolerance and habitat associations within four neotropical tree genera, Ecology, 88, 478–489, 2007.
Bongers, F., L. Poorter, R. S. A. R. Van Rompaey, and M. P. E. Parren: Distribution of twelve
20
moist forest canopy tree species in Liberia and Cote d’Ivoire: response curves to a climatic gradient, J. Veg. Sci., 10, 371–382, 1999.
Borchert, R.: Responses of tropical trees to rainfall seasonality and its long-term changes, Climate Change, 39, 381–393, 1998.
Brown, S. and Lugo, A. E.: Biomass of tropical forests: a new estimate based on forest volumes,
25
Science, 223, 1290–1293, 1984.
Bucci, S. J., Goldstein, G., Meinzer, F. C., Scholz, F. G., and Franco, A. C.: Functional con- vergency in hydraulic architecture and water relations of tropical savanna trees: from leaf to whole plant, Tree Physiol., 24, 891—899, 2004.
Chave, J., Muller-Landau, H. C., Baker, T. R., Easdale, T. A., Ter Steege, H., and Webb, C. O.:
30
Regional and phylogenetic variation of wood density across 2456 neotropical tree species, Ecol. Appl., 16, 2356–2367, 2006.
Condit, R., Pitman, N., Leigh Jr., E. G., Chave, J., Terborgh, J., Foster, R. B., Nu ˜nez-V., P., 2023
BGD
5, 2003–2047, 2008
Amazonian xylem density variation
S. Pati ˜no et al.
Title Page Abstract Introduction Conclusions References
Tables Figures
◭ ◮
◭ ◮
Back Close
Full Screen / Esc
Printer-friendly Version Interactive Discussion
Aguilar, S., Valencia, R., Villa, G., Muller-Landau, H. C., Losos, E., and Hubbell, S. P.: Beta- Diversity in Tropical Forest Trees, Science, 295, 666–669, 2002.
Engelbrecht, B. M. J., Comita, L. S., Condit, R., Kursar, T. A., Tyree, M. T., Turner, B. L. and Hubbell, S. P.: Drought sensitivity shapes species distribution patterns in tropical forests, Nature, 447, 80–83, 2007.
5
Engelbrecht, B. M. J., Dalling, J. W., Pearson, T. R. H., Wolf, R. L., G ´alvez, D. A., Koehler, T., Tyree, M. T., and Kursar, T. A.: Short dry spells in the wet season increase mortality of tropical pioneer seedlings, Oecologia, 148, 258–269, 2006.
Engelbrecht, B. M. J., Kursar, T. A., and Tyree, M. T.: Drought effects on seedling survival in a tropical moist forest, Trees-Struct. Funct., 19, 312–321, 2005.
10
Engelbrecht, B. M. J., Wright, B. W., and De Steven, D.: Survival and ecophysiology of tree seedlingsc during El Ni ˜no drought in a tropical moist forest in Panama, J. Trop. Ecol., 18, 569–579, 2002.
Enquist, B. J., West, G. B., Charnov, E. L., and Brown, J. H.: Allometric scaling of production and life-history variation in vascular plants, Nature, 401, 907–911, 1999.
15
Erskine, P. D., Lamb, D., and Borschmann, G.: Growth performance and management of a mixed rainforest tree plantation, New Forest, 29, 117–134, 2005.
Gentry, A. H.: Tree species richness of upper Amazonian forests, P. Natl. Acad. Sci. USA, 85, 156–159, 1988.
Gilmour, A. R., Thompson, R., and Cullis, B. R.: Average information REML, an efficient al-
20
gorithm for variance parameterisation in linear mixed models, Biometrics, 51, 1440–1450, 1995.
Gonzalez, E. and Fisher, R. F.: Variation in selected wood Properties of Vochysia guatemalen- sis from four sites in Costa Rica, Forest Sci., 44, 185–191, 1998.
Hacke, U. G., Sperry, J. S., Ewers, B. E., Ellsworth, D. S., Schafer, K. V. R., and Oren, R.:
25
Influence of soil porosity on water use in Pinus taeda, Oecologia, 124, 495–505, 2000.
Hacke, U. G., Sperry, J. S., Pockman, W. T., Davis, S. D., and Mcculloch, K. A.: Trends in wood density and structure are linked to prevention of xylem implosion by negative pressure, Oecologia, 126, 457–461, 2001.
Harms, K. E., Condit, R., Hubbell, S. P., and Foster, R. B.: Habitat associations of trees and
30
shrubs in a 50-ha neotropical forest plot, J. Ecol., 89, 947–959, 2001.
Hubbell, S. P.: The Unified Neutral Theory of Biodiversity and Biogeography, Princeton, Prince- ton Univ. Press, 448 pp., 2001.