The results of our study on (i) the latest basaltic series in the Tadjoura Gulf and (ii) the oldest rift series in the Ali Sabieh and Danakil area provide new constraints on the recently active kinematic history of the Tadjoura Rift, and the earlier recorded by the marginal zones of the Afar Depression. The initial volcanoes of the Ali Sabieh mafic complex were placed in the time interval 26-19 Ma, i.e.
Introduction. Problématiques
Elles portent sur les analyses géochimiques de quelques roches basiques de la zone d'étude, ainsi que 27 plaques photographiques illustrant différentes structures (magmatiques et tectoniques) observées et mesurées lors de missions de terrain. La zone d'étude a ensuite été étendue, d'une part, à la zone symétrique du côté nord du golfe de Tadjoura (secteur Obock-Tadjoura), et d'autre part, aux reliefs qui limitent la plaine de Djibouti vers l'ouest. . (Zonat Ali Sabieh et Arta), afin de pouvoir répondre aux questions scientifiques énumérées ci-dessus concernant la dynamique du rift Afar au cours du 30 mai dernier.
Méthodologie et données
Approche structurale
- MNT SRTM
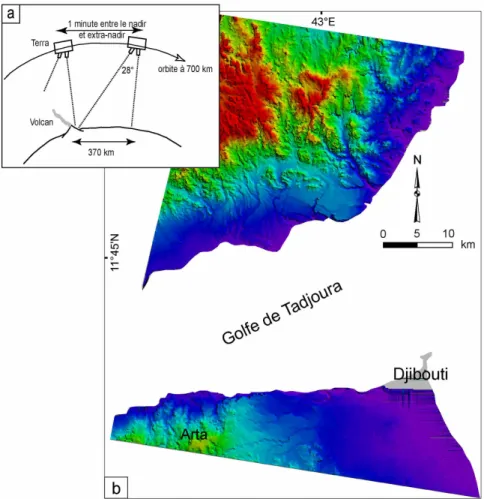
- MNT ASTER
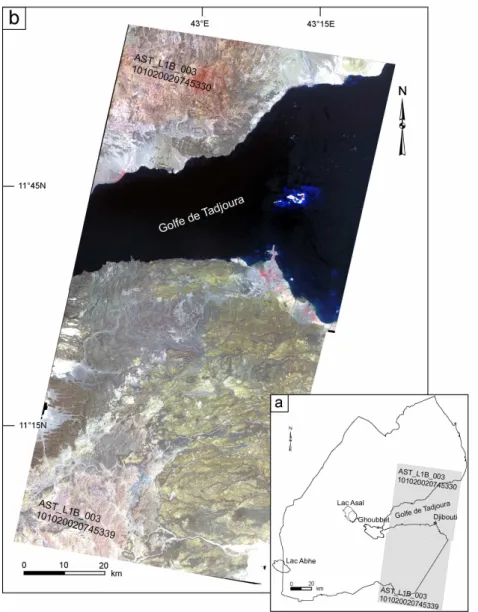
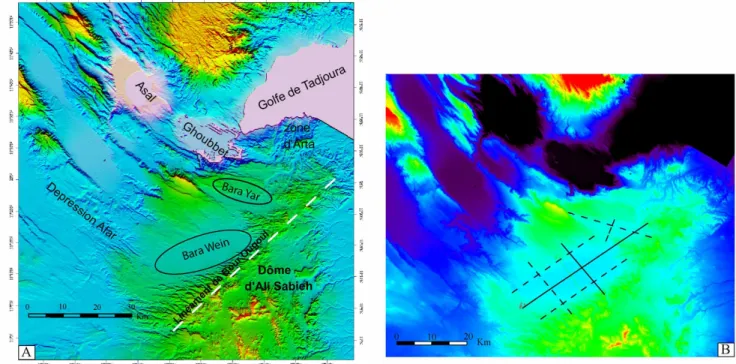
Une carte de failles a été élaborée à partir de l'interprétation d'images ASTER (dont la résolution spatiale de 15 m n'autorise que les structures présentant un dénivelé > 15 m) (Figure 4b). La plupart des paramètres géométriques des populations de fractures (azimut, longueur, portée, densité) peuvent être quantifiés à partir de l'interprétation des images ASTER.
Approche géochimique
La variabilité géographique de la densité peut fournir des informations sur les variations du taux de déformation. A noter seulement que les concentrations en éléments majeurs et traces (sauf Rb) mesurées avec un ICP-AES (Inductively Coupled Plasma-Atomic Emission Spectrometer) ISA Jobin-Yvon® JY70 sont basées sur une solution préalablement obtenue.
Approche géochronologique
L'observation de la fraction 0,125< Ø <0,250 à la loupe binoculaire permet de trier les éléments à dater parmi les phases restantes (phénocristaux, mésostasie, verre, opaque). La séparation magnétique permettra d'éliminer de la mésostasie tous les phénocristaux ne contenant pas de magnétite.
Introduction
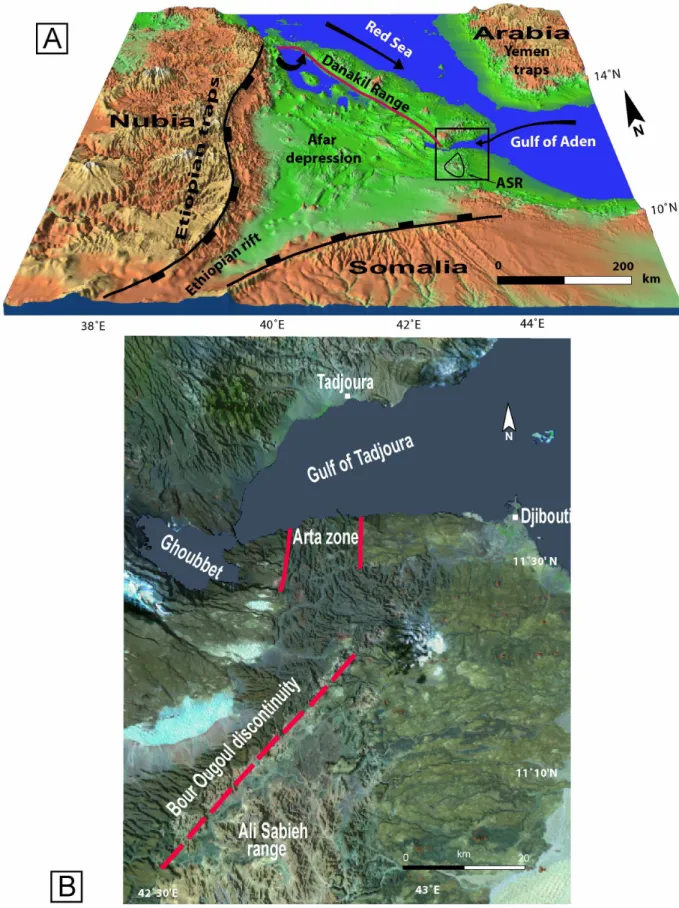
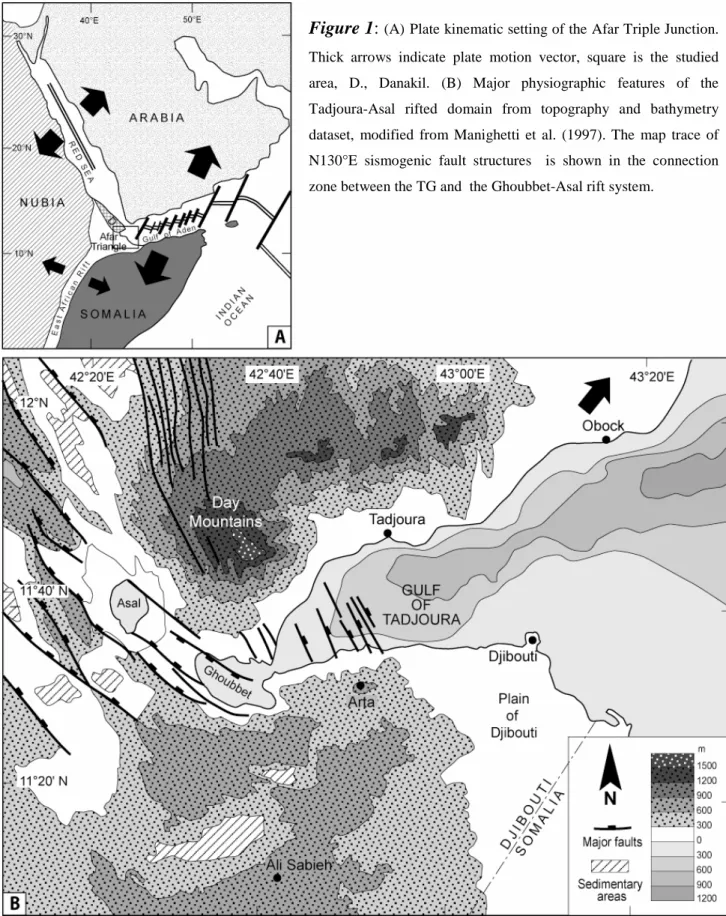
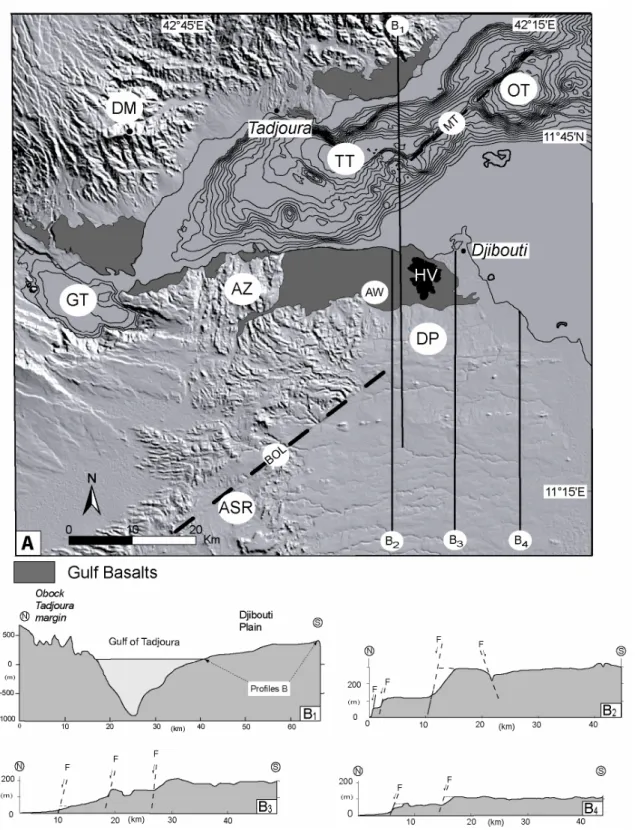
Its present-day tectonic activity is mostly confined to its submerged central part along seismogenic fault structures that lie to the W throughout the connection zone with the N130°E Ghoubbet-Asal rift ( Fig. 1B ) ( Lépine et al., 1980 ). Another possibility was the connection between the Tadjoura and Ghoubbet rifts assigned by Manighetti et al. 1997) to a soft link pattern involving an en échelon of fault structures at a later stage (ca. 1 Ma ago) of extension (Fig. 2A).
Methodology
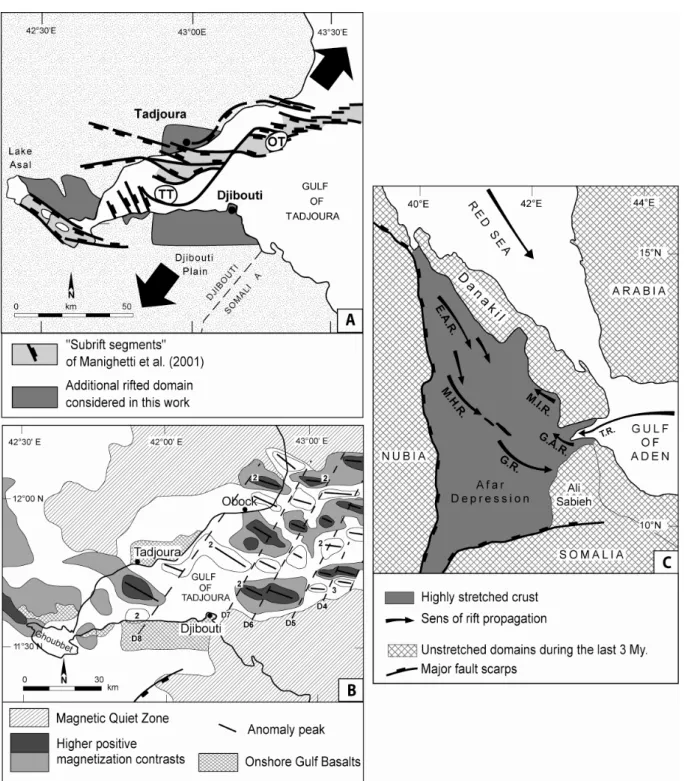
The dashed lines (D1 to D8) represent the transformation errors that offset the magnetic segments; D8 corresponds to the Maskali transformation. C) Sketch map of the Afar depression showing (i) the distribution of submarine Quaternary magmatic segments and (ii) the sense of rift propagation proposed by Tapponnier et al. Therefore, it was only used to show the general structural arrangement of TR (Figure 3).
Regional morphostructural pattern
The offshore part of the TR consists of two adjacent structural units with distinct morphological features. The morphostructural network of the TR and its surrounding domains is interpreted in terms of fault arrangement in Section 6.
Geological context
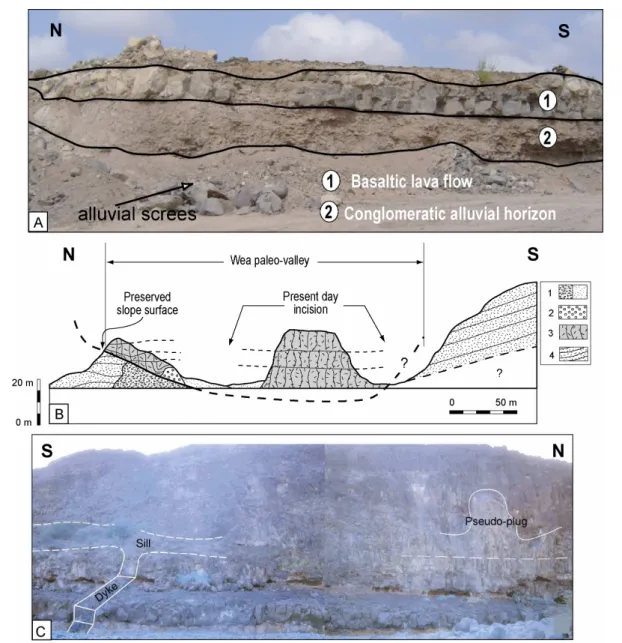
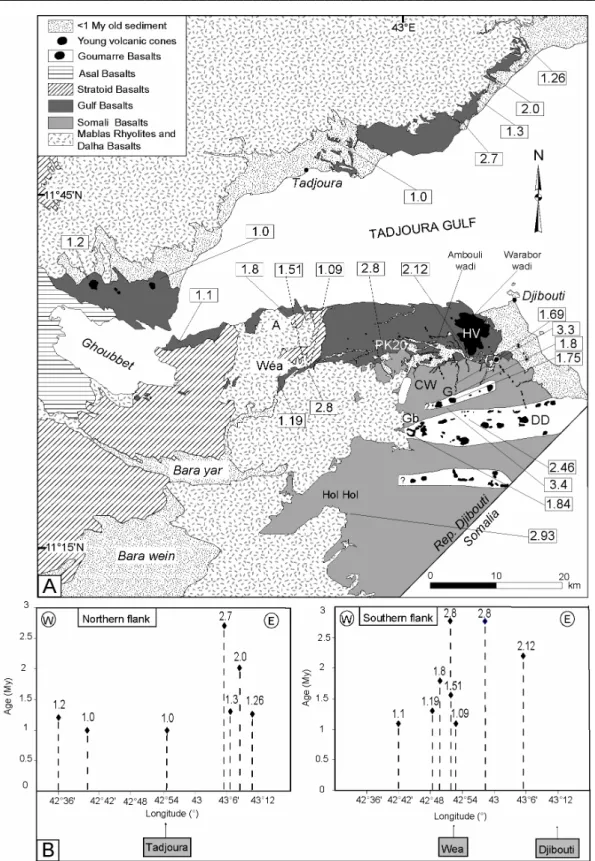
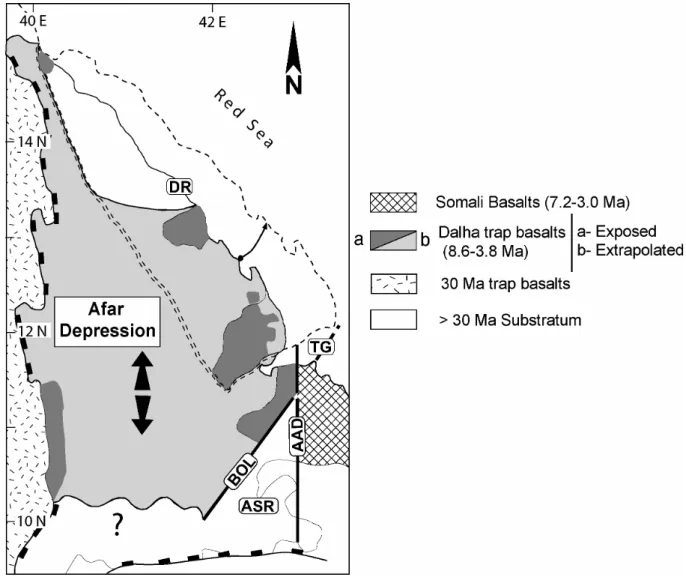
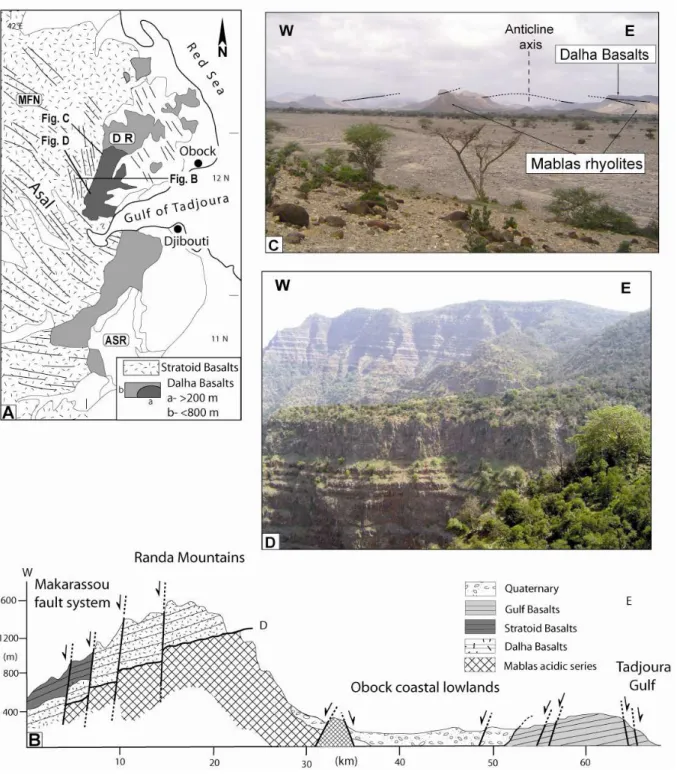
There, the Gulf basalts rest unconformably above highly weathered basalts of the 5.9-3.6 Ma-old Dalha series (Varet, 1975; Richard, 1979), along a SE-dip surface representing the initial slope of a NE -SW-oriented paleo-valley (Figure 5B). 7.2-3.0 million year old Somali basalts (Chessex et al., 1975) cover most of the Djibouti Plain beyond the regional-scale flexure to the S (Figure 4A).
Geochemical data
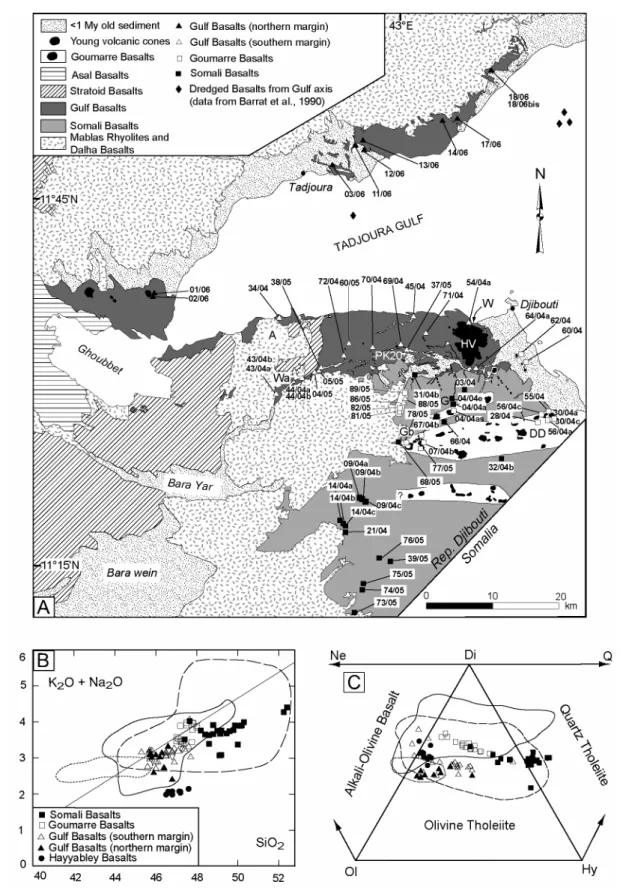
The Hayyabley Basalts show flat incompatible element patterns that are distinctly different from the other types. Tholeiitic basalts exhumed along the axis of Tadjoura Gulf (Barrat et al. are also relatively primitive (high Ni content and rather low FeO*/MgO ratios; Figure 8A) and depleted in the most incompatible elements Figure 8B).
Rift fault pattern
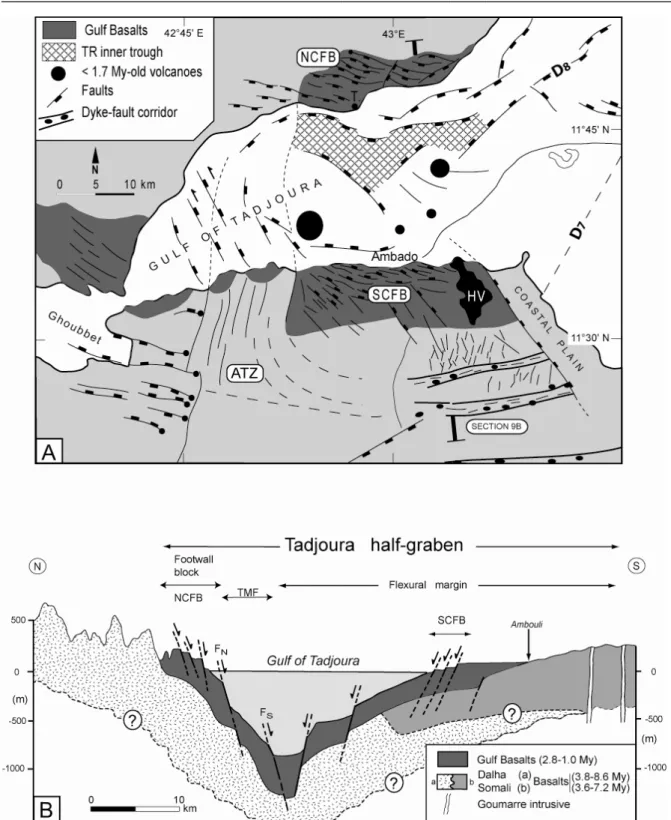
The latter, together with the almost contemporaneous Dalha basalt series to the N, form the substrate of the TR (Figure 9B). For each structural section, maximum fault displacement is recorded along the coastal (inner) structures, in a manner symmetrical with that observed on the opposite (northern) side of the TR. Map distribution and morphological expression of the extensional fault pattern in the southern coastal fault belt of the Tadjoura Rift.
Proposed kinematic model for the Tadjoura Rift
During this early stage, extension may have been transferred further SW from the Obock-Tadjoura trough into southern Afar along the so-called BOL which follows the NW flank of the Ali Sabieh dome (Acton et al., 1991; Audin, 1999). . The key role of the AAD is emphasized as causing (1) the lateral closure of axial fault propagation, and (2) the jump of rift axis in the Ghoubbet Trough. However, recent gravimetry modeling shows conversely that the crust is much thinner in the heart of the Afar Depression (Seber et al., 2001).
Geological context
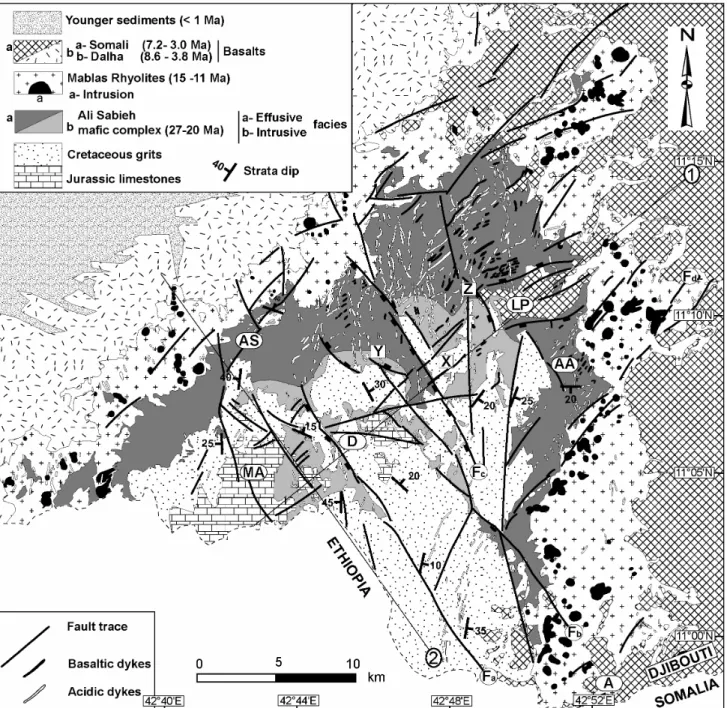
The flanks of the DR are overlain by (i) 2.3–1.0 Ma stratoid basalts, which underlie most of the Afar Depression to the W, and (ii) the Ribta Series and the Gulf basalts, which occupy the lowlands along the Red Sea coast, to the E. It is composed of a mafic intrusive core overlain by an outward envelope, including a Jurassic–Cretaceous sedimentary cover, overlain by (i) initial mafic effusive sequences and (ii) younger acidic series of 15–11 Ma-old Mablas Fm (Zumbo et al., 1995). The curved series of the Ali Sabieh antiform is dissected by a network of fault-like structures with a dominant N150°E trend.
Methodology
There they are cut by a dense network of NW and NE-SW basaltic acid dykes, which at one time could have fed younger extruded deposits, later removed by erosion in the core of the antiform. The youngest intrusions in the ASR are probably the dense swarm of rhyolitic plugs of km-scale radius, typically arranged in an echelon magmatic lineaments throughout the Mabla acid series on the eastern flank of the ASR.
The Ali Sabieh mafic complex
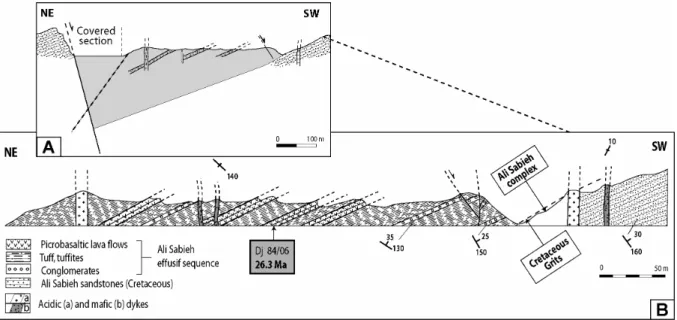
Location on the cross section C. C) Generally NE-SW oriented cross ion supporting the origin of the Ali Sabieh antiform as a laccolith induced domal structure. From its map extent, and assuming a general strata dip <20°, the total thickness of the Ali Sabieh effusive sequence may approach 1-2 km. The east-sloping limestone strata at the back of the photo represent the structurally highest country rock units in the axial part of the Ali Sabieh antiform. see location on the cross section in figure 3C).
Fault pattern and domal structure
Inherited faults with a similar trend, probably of Cretaceous age, are inferred to have been partially rejuvenated in Miocene times, during the onset of the Ali Sabieh mafic event. These inherited or newly formed predominantly extensional structures probably recorded a significant component of dextral shear beneath the VZ-directed extension, which is thought to have dominated during the onset of Ali Sabieh magmatic activity (see Appendix A). This general distribution of faults reflects the stable behavior of the ASR over the past 3 million years relative to the strongly stretched Afar Depression towards the NW.
Tectono-magmatic model
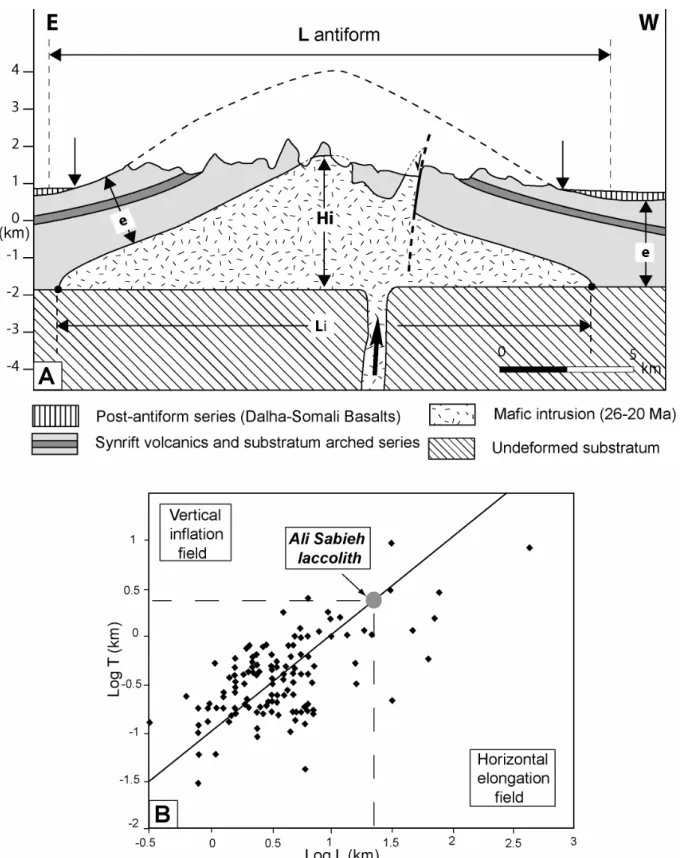
Schematic cross-section illustrating the recovered geometry of the antiform and its coring laccolith (Hi, height and Li, length). 2 km of sedimentary overburden has been partially removed since the Upper Miocene (post-Mablas) by erosion in the axial part of the antiform. Plotting the estimated length of 20 km on the log-log diagram of Figure 11B (in Galland, 2004) indicates a depth of 2.5 km for the base of the laccolith, i.e.
The Danakil range
Note also the almost smooth character of DR and ASR with respect to the Asal-type extensional fault pattern. A thick (>800 m) sequence of Dalha flood basalts, slightly inclined to the W, forms the highest reliefs in the Randa Mountains.
Kinematical model. Implications
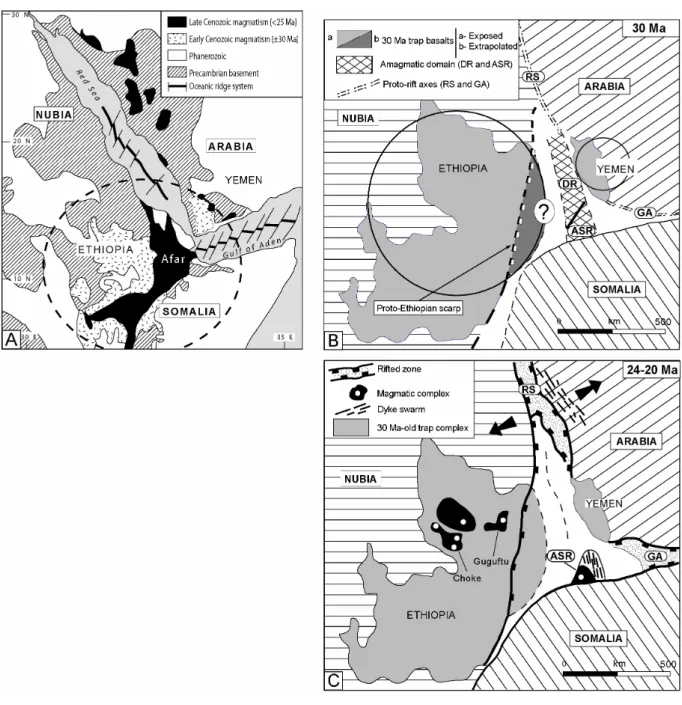
The circle in dashed lines is the generally accepted surface track of the Afar cloud. The inset of the map shows the trace of the section in the widest part of the western Afar. The supposed separation zone could coincide with the eastern edge of present-day Danakil.
Analytical procedures
Conventional ion exchange techniques were used for the separation of Sr and Nd and isotope ratio measurements were performed by thermal ionization mass spectrometry using a Thermo Triton spectrometer. Isotopic compositions of Pb were determined at the Southampton Oceanic Center using the SBL 74 double peak. Potassium and argon were measured on the microcrystalline groundmass, after removal of phenocrystals using heavy liquids of appropriate densities and magnetic separations.
Geological setting and K-Ar ages
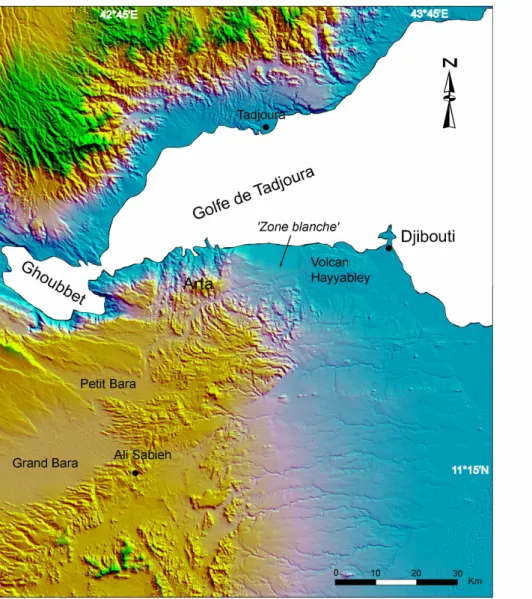
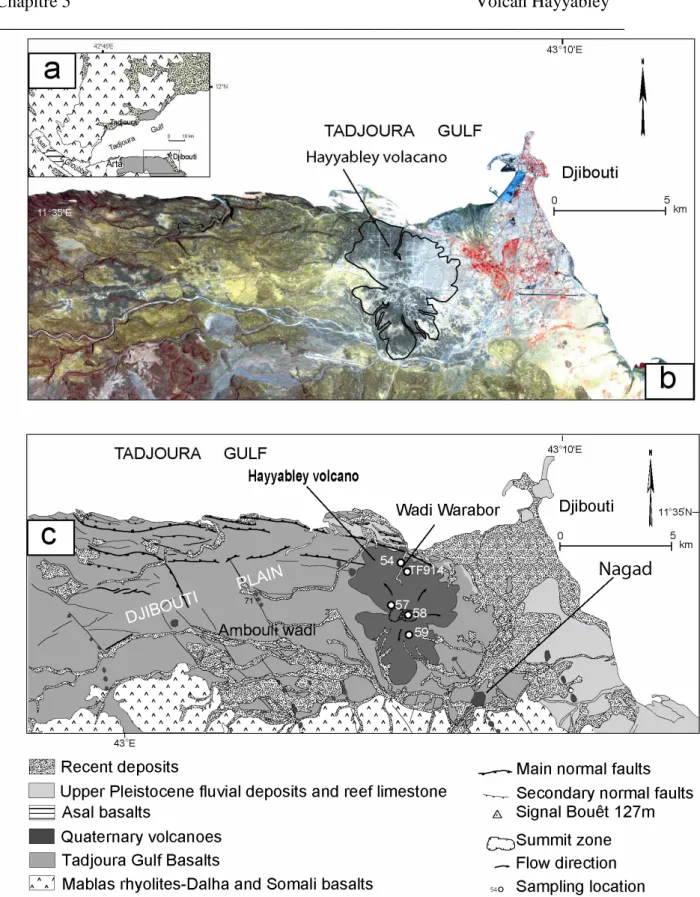
The latest volcanic units of the Djibouti Plain are a set of generally small ash and cinder strombolic cones with associated basaltic flows (e.g. the Nagâd volcano, Figure 1), aligned with NNW-SSE trends (Fournier et al., 1982) which correspond. to a very young fracture network. The largest of these post-TGB volcanic centers is the Hayyabley volcano (Figure 1), to the E. Its vents are no longer identifiable, possibly due to the strong anthropic imprint and constructions of the Djibouti suburbs: they become presumably located in its summit zone, and aerial photo data indicate radial emplacement of the lava flow away from this summit (Fournier et al., 1982).
Petrologic and geochemical results
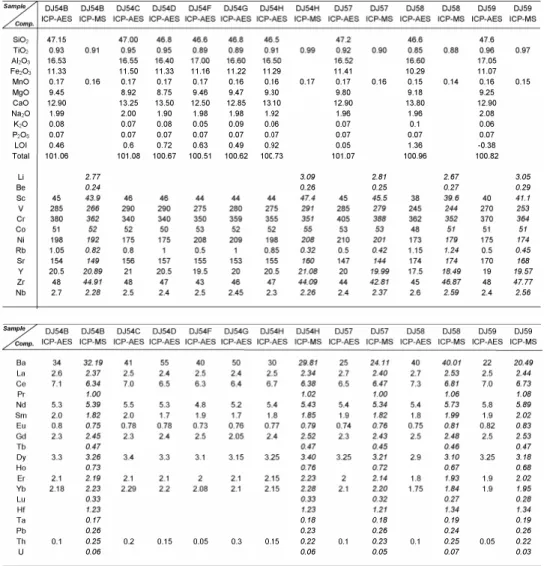
Major and trace element abundances of the Hayyabley basalts (oxides in wt.%, trace elements in µg/g). The isotopic compositions of the Hayyabley basalts and other volcanoes of NE Africa are compared in figures 4 to 6. 87Sr/86Sr plot (Figure 4) shows that the Hayyabley basalts and light REE depleted basalts of Manda Hararo are isotopically very close.
Discussion
Al2O3 abundances of LREE-depleted basalts are not anomalously high, which immediately rules out this explanation. In the case of the Manda Hararo basalts, this conclusion is strengthened by their δ18O values close to 5.5. Previous geochemical studies have emphasized the participation of a depleted component during the genesis of northeast African basalts.
Conclusions
We suggest that a depleted, internal plume component contributed to these young and old lavas associated with the Afar hotspot.
CONCLUSIONS ET PERSPECTIVES
Conclusions générales et perspectives
- Conclusions générales
- Prospectives
Il s'agit du linéament NE-SW de Bour Ougoul (BOL), qui met en évidence le flanc ouest de l'antiforme Ali Sabieh, dans le prolongement terrestre de la transformée Maskali (Figure 1) (voir Chapitre 4). Le complexe veineux (base acide) qui traverse de façon spectaculaire la pointe nord de l'antiforme Ali Sabieh (Figure 1) est, à notre connaissance, le plus important de tout le rift Afar. L'étude structurale de l'ensemble du complexe sera dans un premier temps réalisée sur la base d'images (ASTER) afin de (i) préciser la répartition spatiale des deux familles d'intrusions (acide et basique), et (ii) la nature de leur géométrie. . (et donc chronologiques).
Evolution of the volcanic region of Ali-Sabieh (T.F.A.I) in the light of K/Ar age determinations. Evolution of volcanism in the junction area of the Red Sea, Gulf of Aden and Ethiopian rifts. Structure and development of the midocean ridge-plate boundary in the Gulf of Aden: Evidence from GLORIA side-scan sonar.
ANNEXES
Analytical results
M - Les basaltes somaliens chevauchent les rhyolites de Mablas sur le flanc E de l'antéforme Ali Sabieh (Ali Est Addé). N - Contact érosif entre les basaltes de Dalha et les rhyolites de Mablas (Flanc NE de l'antiforme Ali Sabieh, Daasbiyo Nord). O - Contact stratigraphique concordant entre calcaires du Jurassique et grès du Crétacé au cœur de l'antiforme d'Ali Sabieh.