HAL Id: hal-00863850
https://hal.archives-ouvertes.fr/hal-00863850
Submitted on 20 Sep 2013
HAL is a multi-disciplinary open access archive for the deposit and dissemination of sci- entific research documents, whether they are pub- lished or not. The documents may come from teaching and research institutions in France or abroad, or from public or private research centers.
L’archive ouverte pluridisciplinaire HAL, est destinée au dépôt et à la diffusion de documents scientifiques de niveau recherche, publiés ou non, émanant des établissements d’enseignement et de recherche français ou étrangers, des laboratoires publics ou privés.
High nonlinear urban ground motion in
Manila(Philippines) from 1993 to 2010 observed by DInSAR: implications for sea-level measurement
Daniel Raucoules, Gonéri Le Cozannet, Guy Wöppelmann, Marcello de Michele, Médéric Gravelle, Arturo Daag, Marta Marcos
To cite this version:
Daniel Raucoules, Gonéri Le Cozannet, Guy Wöppelmann, Marcello de Michele, Médéric Gravelle, et al.. High nonlinear urban ground motion in Manila(Philippines) from 1993 to 2010 observed by DInSAR: implications for sea-level measurement. Remote Sensing of Environment, Elsevier, 2013, 139, pp.386-397. �10.1016/j.rse.2013.08.021�. �hal-00863850�
1
High nonlinear urban ground motion in Manila (Philippines) from 1993 to 2010 1
observed by DInSAR: implications for sea-level measurement 2
3 4
Raucoules, Daniela*; Le Cozannet, Gonéria; Wöppelmann, Guyb; de Michele, Marcelloa; Gravelle,
5
Médéricb; Daag, Arturoc; Marcos, Martab
6
7
aBRGM, 3 av. Claude Guillemin, 45060 Orléans, France
8
bLIENSs, Université de La Rochelle - CNRS, 2 rue Olympe de Gouges, 17000 La Rochelle, France
9
c Philippine Institute of Volcanology (Phivolcs), PHIVOLCS Building, CP Garcia Avenue, U.P. Campus Diliman,
10
Quezon City 1101, Philippines
11
*corresponding author: d.raucoules@brgm.fr; phone: 33-2 38 64 30 86
12 13 14
Keywords: DInSAR; subsidence; sea level rise estimation; Manila
15 16
Highlights:
17 18
- Differential SAR interferometry has been applied in Manila (Philippines)
19
- High nonlinear ground motion was observed during 1993–1998 and 2003–2010.
20
- A comparison with independent ground-level measurements (GPS, DORIS, and Tide Gauge) was
21
carried out.
22
- The consequences for sea-level estimation were analyzed using a local tide gauge and GPS
23
station.
24 25 26
ABSTRACT:
27
In coastal low-lying urban areas, vertical ground motions can significantly exacerbate the hazards related to
28
sea-level rise. However, their spatial extent, their temporal evolution, and even sometimes their existence
29
are often poorly known. This study aims to monitor variable urban ground motion (uplift and subsidence)
30
from 1993 to 2010 in the metropolitan area of Manila, Philippines. Because high subsidence rates have
31
been reported in this city in previous studies, conventional differential SAR interferometry (DInSAR) was
32
applied with an adapted stacking procedure to the archive of ERS and Envisat satellite images to produce
33
surface deformation-velocity maps for different periods. The results showed that the city is locally affected
34
2
by vertical ground motions on the order of 15 cm/yr. Moreover, the spatio-temporal evolution of the ground-
35
motion phenomena is highly nonlinear. These results are in good agreement with previous studies focused
36
on groundwater use in Manila and in the Marikina Fault Valley, suggesting a plausible interpretation of the
37
processes causing surface motion. Incidentally, the ground motions are affecting the locations of several
38
geodetic instruments, including a tide gauge with sea-level records starting in 1902, two permanent GPS
39
(Global Positioning System) stations, and a DORIS (Doppler Orbitography and Radiopositioning Integrated
40
by Satellite) station. A major implication of those large and locally variable ground motions is that they
41
impede the use of the nearby GPS and DORIS data to correct the tide-gauge records and to derive robust
42
sea-level trends associated with climate change.
43 44
1. Introduction
45
As sea level rises, there is increased concern about the growing urbanization of the world’s coastal zones
46
and the related coastal hazards, particularly in Southeast Asia (McGranahan et al., 2007; Nicholls &
47
Cazenave, 2010). However, climate-induced sea-level rise is not the only process leading to changes in
48
mean relative sea levels in coastal cities: the local relative sea-level rise (i.e., as experienced on the coast)
49
can be significantly affected by vertical ground motions, subsidence or uplift, either due to natural
50
processes (e.g., global isostatic adjustment, tectonics, sediment compaction) or to human activities (e.g.,
51
groundwater pumping, hydrocarbon extraction).
52 53
In a recent assessment of the exposure of the world’s coastal cities to coastal submersion hazard, Hanson
54
et al. (2011) have highlighted that subsidence or uplift (1) affects many important coastal cities worldwide
55
and (2) can be in the same order of magnitude or greater than climate-induced sea-level rise. It is therefore
56
important to take into account these processes for evaluating how changes in sea level may affect coastal
57
cities in the future. However, while coastal ground motions are recognized important, they are in practice
58
often poorly known. In many cases, little information is available about the processes that generate ground
59
motion (e.g., location and rates of groundwater pumping) and on ground-motion patterns. In addition,
60
vertical ground motions often reveal strong spatial and temporal variability, so that their mapping is a
61
complex task.
62
63
3
As a complement to in-situ monitoring (e.g., using GPS or leveling), space-borne Differential Synthetic
64
Aperture Radar Interferometry (DInSAR) provides a means to deliver a comprehensive mapping of surface
65
deformation (e.g., Brooks et al., 2007; Lagios et al., 2006; Raucoules et al., 2008; Bock et al., 2012;
66
Chaussard et al., 2013). The principle of DInSAR is to infer ground-motion displacements from the
67
evolution of the phase of space-borne Synthetic Aperture Radar between two or more satellite passes.
68
Although the technique encounters limitations in vegetated areas, it can be applied efficiently in urban
69
environments. In addition, provided that the displacements are not too rapid given the geometric and
70
temporal characteristics of the available SAR scenes time series, the method has been shown to be
71
efficient for monitoring slightly nonlinear ground motions (e.g., Kim et al., 2010).
72 73
Using SAR data acquired by the ERS and Envisat satellites from 1993 to 2010, this study uses DInSAR to
74
monitor ground motions affecting Manila, on Luzon Island in the Philippines. Located on a coastal
75
floodplain between the eastern part of Manila Bay and Laguna de Bay, the Manila metropolitan area is
76
considered to be highly vulnerable to the adverse effects of flooding and of sea-level rise (World Bank,
77
2010). The 2010 population census reported that Manila has a population of 11.8 million inhabitants
78
(National Statistics Office, Republic of the Philippines, 2010). In addition, previous studies have reported
79
that the city is subject to ground motions: as the population has grown, water demand and groundwater
80
extraction have drastically increased (Clemente et al., 2001), causing ground surface motions in the city of
81
Manila, as well as in other locations around Manila Bay (Siringan & Ringor, 1998; Rodolfo & Siringan,
82
2006; Daag et al., 2011, Clemente et al., 2001). Finally, the eastern part of the city is crossed by a seismic
83
fault, the Marikina Fault Valley (Rimando & Knuepfer, 2001).
84 85
Interestingly, the city hosts several important geodetic instruments which are potentially useful for
86
estimating contemporary sea-level rise. Tide-gauge measurements have been recorded in Manila since
87
1902, which makes this the longest time series in Southeast Asia. Therefore, this gauge belongs to the
88
“Global Core Network” of the Global Sea Level Observing System (GLOSS). However, the tide gauge is
89
suspected of being affected by ground motions, presumably due to groundwater withdrawal, at least since
90
the 1950s (Santamaría Gómez et al., 2012). To correct sea-level time series from these ground motions
91
(as proposed by Wöppelmann et al., 2007), several geodetic instruments located in metropolitan Manila
92
might be used: two GPS stations and a DORIS (Doppler Orbitography and Radiopositioning Integrated by
93
4
Satellite) station (Willis et al., 2010). However, these instruments are located several kilometers away from
94
the tide gauge (Fig. 1). Because no repeated leveling surveys are presently available in the GLOSS data
95
repositories (www.sonel.org; www.psmsl.org), it is unknown whether the location of these instruments has
96
been affected by the ground-motion processes.
97 98
In this study, DInSAR is applied to the Manila urban area with the objective of providing preliminary
99
answers to the following questions:
100
(1) What was the spatial and temporal variability of ground-surface deformations in Manila from 1993
101
to 2010?
102
(2) To which extent do these deformations affect the locations of the tide gauge and of the GPS and
103
DORIS stations?
104
(3) What are the possibilities for using sea-level time series before 1993 in Manila?
105 106
The paper proceeds as follows: Part 2 describes the data and the DInSAR processing. Part 3 reports on
107
the observations of surface deformations and provides preliminary interpretations in relation to previous
108
studies focused on groundwater extraction and on the Marikina Valley Fault. Finally, in Part 4, the paper
109
discusses to which extent the combination of permanent GPS measurements and DInSAR is able to
110
provide correction for long-term tide-gauge time series for this particular site, considering the high observed
111
deformation rates and their irregular temporal evolution.
112 113 114 115
2. Processing procedures and data 116
2.1 Choice of an adapted DInSAR processing procedure
117
118
Several DInSAR algorithms can be used for processing SAR data, from conventional DInSAR (e.g.,
119
Massonnet and Feigl, 1998), possibly with an adapted stacking procedure (e.g., Usai et al., 2003) to
120
advanced techniques such as Persistent Scatterers Interferometry (PSI, e.g., Ferretti et al., 2000;
121
Wegmuller et al., 2004) or Small Baseline Subsets (SBAS, e.g., Pepe et al., 2005). The quality of the
122
5
results obtained by each method can vary widely depending on the area of interest and on the available
123
SAR images. In places such as the densely urbanized Manila metropolitan area, conventional DInSAR
124
often provides interferograms with good coherence even over large time spans (a few years), provided that
125
the perpendicular baselines are not too high. However, these interferograms are affected by atmospheric
126
effects, typically leading at the spatial wavelength of this study (~20 km) to errors of the order of one
127
centimeter, but in certain cases to errors larger than a fringe (e.g., Hanssen, 2001). When a sufficient
128
number of SAR scenes have been acquired, stacking procedures can average and reduce atmospheric
129
effects, which are supposed to be spatially correlated and temporally uncorrelated. With this assumption,
130
uncertainty due to atmosphere is reduced as the inverse of √N , where N is the number of independent
131
interferograms (Zebker et al.,1997; Peltzer et al., 2001). For the presented results, that corresponds to
132
approximately 4 mm/yr for the ERS data set (with only thirteen images) and better than 1 mm/yr for the
133
EnviSat/ASAR data set.
134
Stacking procedures are relatively easy to use and can often provide information about potentially
135
nonlinear ground motions in the order of a few centimeters per year (e.g., Le Mouelic et al., 2005). Finally,
136
advanced techniques such as PSI can be efficient if PS density is sufficient and can reach high precision.
137
However, in the case of spatially and temporally variable rapid ground deformations, PSI techniques (in the
138
standard procedure based on the use of linear or slightly nonlinear displacement evolution models) can be
139
affected by spatial and temporal unwrapping errors that result in underestimation of the velocity and
140
incorrect atmospheric phase screen estimation (Raucoules et al., 2009). When no prior information on
141
patterns of urban ground deformations is available, stacking procedures are easily applicable and can
142
provide maps of vertical ground motions. This approach was selected for the case study in Manila.
143
Combinations of ascending and descending modes can in certain cases (e.g., Wright et al., 2004) be used
144
for separating vertical motions other than horizontal (in fact, mostly East-West because of the orbital
145
orientation). However, in the study area, the data archive in ascending mode is insufficient (in fact only one
146
ASAR pair is archived) to derive deformation maps for the period of interest. Assumptions on the direction
147
of motion are therefore needed for interpretation.
148 149
2.2 Description of data and processing
150
151
6
Using a series of ERS 1-2 images between 1993 and 2000 (Table 1) and ASAR/EnviSAT data between
152
2003 and 2010 (Table 2), differential interferograms having perpendicular baselines shorter than 300 m
153
were processed. Then, as suggested, e.g., by Le Mouelic et al., (2005), a subset of trustworthy
154
interferograms was selected visually by rejecting noisy phases and data obviously affected by atmospheric
155
effects. In addition to rejecting low-coherence interferograms, the interferograms were compared by pairs
156
to identify obvious atmospheric effects. Figures 2a and 2b show the selected interferograms and related
157
acquisition times and perpendicular baselines. Deformation is assumed (even for nonlinear deformation) to
158
have a certain temporal correlation, whereas atmosphere turbulence is assumed uncorrelated. By
159
identifying similarities and dissimilarities on the interferograms, it was possible to detect acquisitions
160
affected by strong atmospheric effects that could severely impair a stacking result. Finally, interferograms
161
were stacked for the entire observation periods [1993–1998 (ERS) and 2003–2010 (Envisat)] and for sub-
162
periods of three years. We focused on time spans shorter than 400 days to avoid unwrapping errors in
163
interferograms with more than five or six fringes and to limit temporal decorrelation. Note that the ERS
164
acquisition for 2000 does not allow production of interferograms meeting the requirements in terms of time
165
span.
166
This processing was carried out using the GAMMA interferometric software (Wegmuller at al., 1998).
167 168
2.3 Specific procedures for analyzing temporally variable ground motions and fault-related
169
deformations
170 171
In addition, a principal components analysis (PCA) was performed on the deformation maps to discriminate
172
the areas affected by constant deformation (first component) from those affected by time-varying
173
deformation. Finally, a directional filter was computed for the 2003–2010 deformation maps of the Marikina
174
Valley Fault area (east of Manila) to locate sections of the fault affected by surface motion.
175 176
Table 1: ERS 1–2 acquisitions (track 418)
177
Year Acquisition dates
1993 25 July, 29 Aug, 3 Oct
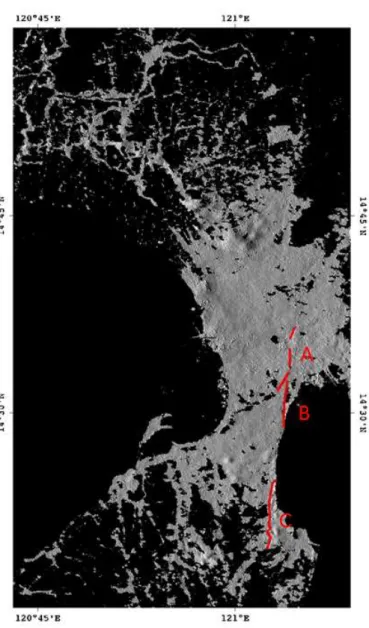
1995 4 April, 13 June, 31 Oct, 5 Dec 1996 9 Jan, 19 March, 11 Sept
7
1997 1 Oct, 5 Nov
1998 14 Jan
2000 23 Feb
Mean incidence angle: approximately 23°
178
179
180
8 181
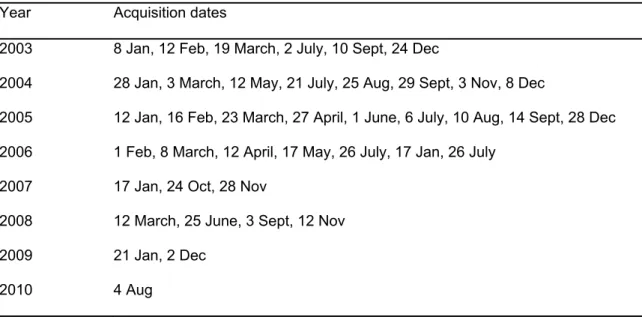
Table 2: EnviSat/ASAR acquisitions (track 418)
182
Year Acquisition dates
2003 8 Jan, 12 Feb, 19 March, 2 July, 10 Sept, 24 Dec
2004 28 Jan, 3 March, 12 May, 21 July, 25 Aug, 29 Sept, 3 Nov, 8 Dec
2005 12 Jan, 16 Feb, 23 March, 27 April, 1 June, 6 July, 10 Aug, 14 Sept, 28 Dec 2006 1 Feb, 8 March, 12 April, 17 May, 26 July, 17 Jan, 26 July
2007 2008
17 Jan, 24 Oct, 28 Nov
12 March, 25 June, 3 Sept, 12 Nov 2009
2010
21 Jan, 2 Dec 4 Aug
Mean incidence angle: approximately 23°
183
184
185
9
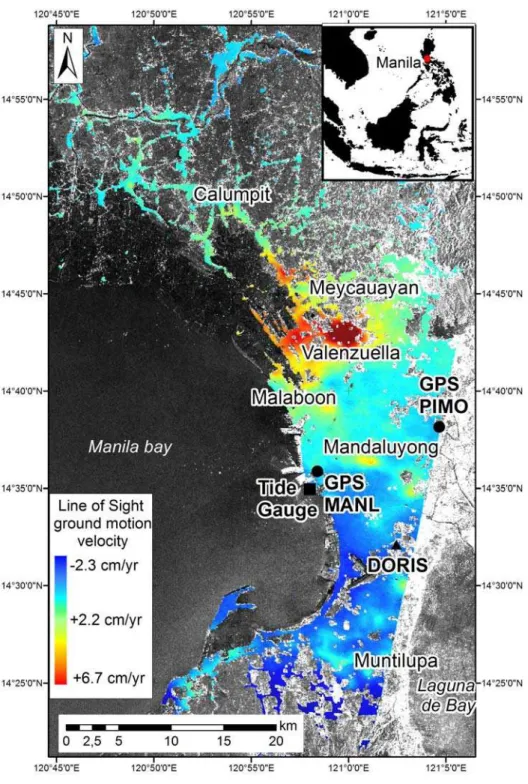
Figure 1: Location of the Manila metropolitan area. This map shows (1) the area covered by the SAR data
186
acquisition frames on Manila Bay, with solid lines corresponding to the ASAR/ENVISAT acquisitions and
187
dashed lines to ERS 1 and 2 data; (2) the position of the Marikina Valley Fault System (MVFS), based on
188
Rimando & Knuepfer, (2006); the ASAR data cover part the Marikina Valley Fault, whereas the ERS data
189
do not due to a slight westward shift of ERS; (3) the location of the tide gauge, GPS (PIMO), and DORIS
190
stations; the MANL GPS station is located close to the tide gauge (see Fig. 3a), but no reliable vertical
191
velocity could be computed for the study period using the SONEL data repository (www.sonel.org).
192
193
10 194
Figure 2a: Baseline/time diagram for the ERS 1/2 data. The interferograms used for the study (those that
195
met the requirements in terms of baseline and time span) are represented by vectors with coordinates
196
corresponding to their baselines and time spans. The zero perpendicular baseline refers to the scene
197
acquired on July 25, 1993.
198 199
200
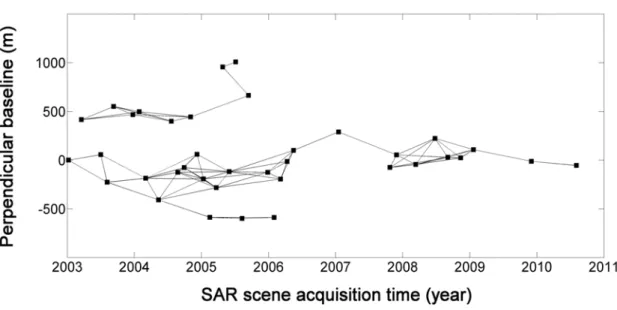
Figure 2b: Same as Figure 2a for the EnviSAT/ASAR data. The zero perpendicular baseline refers to the
201
scene acquired on January 8, 2003..
202 203 204
3. Results: observations and preliminary interpretations 205
206
11
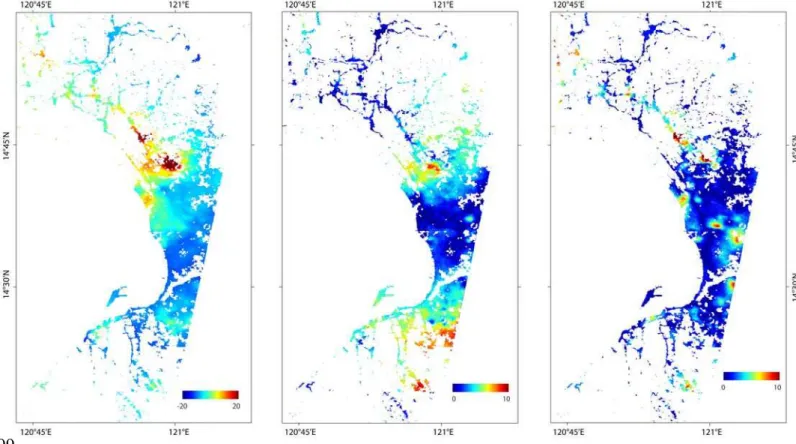
3.1 Velocity maps207
Deformation maps were produced as shown in Figs. 3 and 4. The scale corresponds to Line of Sight (LOS)
208
in cm/yr. Because of the 23° view angle of the acquisition geometry, the LOS measurement is 2.3 more
209
sensitive to the vertical component of the displacement than to the horizontal. The horizontal component of
210
the subsidence displacement is generally much smaller than the vertical, but in certain cases could be non-
211
negligible with respect to the vertical, although smaller (e.g., for coal-mining subsidence, the ratio between
212
the maximum horizontal and the maximum vertical components is approximately 0.4; Tandanand & Powell,
213
1991). On the basis of these two observations, it can be assumed that for subsidence, the measured LOS
214
component is related mostly to the vertical component of the displacement. Under this assumption, 10
215
rad/yr would correspond to approximately 4.9 cm/yr of vertical motion. However, horizontal displacements
216
probably occur in the Marikina Valley Fault because it is mainly a strike-slip fault. In fact, if the observed
217
motion were mainly due to fault activity and not related to pumping-induced subsidence, the measured LOS
218
displacement would be the projection of an along-fault motion (except on sections of the fault having a
219
more complex motion).
220
Pixels with an interferometric coherence less than 0.3 were considered unreliable and were used to define
221
a mask. Morphological operations (opening and closing) were applied to the mask to remove irregularities
222
before the mask was applied to the interferograms.
223
Because of the generalized surface motion in the area, it is difficult to find a reliable and stable reference
224
point. However, the DORIS instrument provides a local estimate of vertical velocity. The deformation maps
225
were corrected by a value (constant for a given map) to be compatible with the displacement observed by
226
DORIS for the corresponding period (and therefore to convert relative measurements from DInSAR in
227
absolute motion estimates). Values of the DORIS motion rates and a description of the data are given in
228
Section 4.1.
229
230
12 231
Figure 3a: Line of Sight ground motion velocity in cm/yr for the whole 1993–1998 period (ERS 1-2 data).
232
Negative values correspond to displacements towards the sensor (i.e., uplift). For figure readability, the
233
color palette in this figure and in the following velocity maps is saturated at its extreme values.
234
235
13 236
Figure 3b: Line of Sight ground motion velocity maps for 1993–1995 and 1995–1998. An increase in
237
subsidence rate in the northern part of the city appears between 1995 and 1998.
238
14 239
240
Figure 4a: Line of Sight ground motion velocity in cm/yr for the whole 2003–2010 period (EnviSat/ASAR
241
data).
242
243
15 244
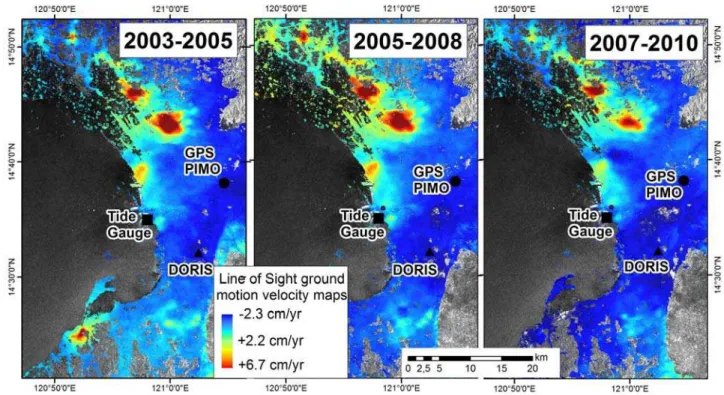
Figure 4b: Line of Sight ground motion velocity maps in cm/yr for 2003–2005, 2005–2008, and 2007–2010
245
(EnviSat/ASAR data).
246 247
The velocity maps reveal non-linear deformation rates. For example, Fig 3b indicates that the subsidence
248
from 1995 to 1998 was quicker in the north-western part of Metro-Manila than from 1993 to 1995. How
249
reliable is this result ? Due to the limited number of SAR images available from the ERS satellite, these
250
velocities maps might be partly affected by atmospheric noise or by slights errors in orbit calculation and
251
very large atmospheric effects at the scale of the imaged area might have resulted in tilts. In our approach,
252
these tilts are corrected by removing tilts on each signle interferogram (estimated using Fast Fourier
253
Transforms) and then the possible residual tilts are minimized over the whole data set during the stacking
254
procedure. While such errors are more difficult to correct when fewer SAR images are available, an
255
analysis of individual interferograms confirms that the acceleration of subsidence is affecting the same area
256
for several individual interferograms. This temporal correlation of interferograms as well as their velocity
257
indicates that these non-linear velocities cannot only result from atmospheric noise, and confirm the
258
acceleration of subsidence from 1995 to 1998 compared to 1993 to 1995. Nevertheless, for the ERS data
259
set, we can consider the 1993-1998 map as more reliable than the two sub-sets (1993-1995 and 1995-
260
1998), because more interferograms were stacked and because the DORIS velocity estimation better
261
represents the average motion over the whole period. More SAR images are available from EnviSAT, thus
262
16
making the results in figure 4a and 4b more reliable. Several non-linear patterns can be observed in these
263
maps, such as the extension of a coastal subsidence southward in the direction of the tide gauge, or the
264
disappearance of a subsidence pattern on the southern shore of Manila Bay. These results therefore also
265
highlight the non-linearity of the urban subsidence process in Manila.
266
Velocity maps not only display non-linear patterns, but also high rates of deformations. For example,
267
deformation rates up to 13 cm/yr were observed in Valenzuela and Meycauayan and rates of approximately
268
9 cm/yr northwest of Guiguinto (note that for visual reason, we saturated the color palette to 6.7cm/yr). In
269
these sectors, deformation was much slower and spatially reduced between 1993 and 1995. The highest
270
deformation rates observed in Valenzuela and Meycauayan are visible on the 1995–1998 and 2003–2005
271
maps (a decrease of the phenomenon in this sector is visible on this last map with respect to the first one),
272
whereas a maximum was obtained after 2005 near Guiguinto.
273 274
Changes in the location and rates of groundwater extraction are a plausible explanation for this migration of
275
the deformation maxima. As reported by Clemente et al. (2001), groundwater pumping in Manila has been
276
multiplied by a factor of five since the 1970s because of population growth. This has resulted in a lowering
277
of the groundwater table by several tens of meters. The authors also suggest land subsidence as a
278
possible consequence of pumping. Clemente et al. (2001) provide piezometric maps which show that the
279
deformation maps generated in this study are consistent with the locations of very low water table levels in
280
the 1990s. For instance, they reported that groundwater was intensively extracted in Muntilupa and
281
Valenzuela, where high ground-motion velocities in the 90’s were observed in this research. This suggests
282
that many ground deformations observed using DInSAR in this research are direct consequences of
283
groundwater pumping in the Manila metropolitan area.
284 285
3.2 Monitoring of Temporal Evolution of Ground Deformations through Principal 286
Components Analysis 287
288
Because the results showed strong temporal variability, a principal components analysis was carried out to
289
highlight areas subject to deformation-rate changes. The idea was to separate areas with constant
290
deformation rates from areas affected by nonlinear deformation components. Principal components
291
analysis (PCA) was therefore applied to the five deformation-rate maps corresponding to the different
292
17
periods studied. It was assumed that the first principal component (PC) was related to the common linear
293
deformation (the first component being highly correlated with all the initial deformation maps) and the
294
second and third components to nonlinear deformations which differ among the five maps (upper-order
295
components were neglected because the fourth eigenvalue was approximately one-twentieth of the first
296
one). The three first eigenvalues were λ1=43, λ2=11 and λ3=4.3.
297 298
299 300
Figure 5: Maps showing the three first principal components. For the second and third components, the
301
absolute values of the components are shown. Locations of the displacements are therefore identified by
302
this information rather than their evolution (acceleration, deceleration).
303 304
Figure 5 highlights the observation that in addition to strong spatial variability, deformation patterns in
305
Manila show a complex temporal evolution. In particular, this figure indicates that in addition to the northern
306
part of the city (e.g., the area between Valenzuela and Meycauayan), the cities of Malaboon, Mandaluyong,
307
and Muntinlupa were affected by nonlinear deformations. Small areas spotted on the third component
308
deserve deeper investigation because temporal changes at short spatial wavelengths could have
309
18
implications such as damage to buildings. Actual links with pumping locations in these areas should be
310
investigated, for example by identifying whether localized velocity changes can be correlated with the
311
installation of new pumping facilities during the study period.
312 313
3.3 D
eformation in the Marikina Valley Fault area314
315
To investigate displacement along the Marikina Valley Fault, an east-west directional filter was used to
316
highlight differential motion between each side of the fault (Fig. 6). Basically, the filtered image consists of
317
an along-column (approximately across-fault) deformation first derivative for which the histogram has been
318
adjusted and the result rescaled to obtain arbitrary values distributed between zero and one. This
319
procedure aims to provide better identification of linear features (similarly to a shaded map) that could be
320
associated with fault motion. Sections of the fault that possibly moved between 2007 and 2010 were then
321
located. Note that the ERS frames did not cover the fault, and therefore this observation is based only on
322
the ASAR data. The 2007–2010 maps clearly show differential displacement along the fault (Fig. 4b).
323
The observed fault section was divided into three sections based on their motion characteristics: A and C:
324
west side moves towards the sensor faster than east side; B has the opposite behavior to A and C. On the
325
three sections, the differential LOS displacement (identified on the deformation map) corresponds to
326
approximately 5-15 mm/yr. Because the fault strike is oriented north-south, it can be assumed that pure
327
strike-slip motions have little influence on the deformation maps produced. Therefore, vertical motion must
328
dominate the signal. Based on this assumption, the observed motion corresponds to up to 8 mm/yr of
329
vertical displacement between the two sides of the fault. The source of this kind of motion is difficult to infer
330
based only on the DInSAR measures, which provide only one component of the deformation in three-
331
dimensional space. Deformation could be related either to tectonic strain (e.g., surface creep) or to
332
subsidence related to water extraction (as observed by Cigna et al., 2011). In this case, the fault would act
333
as a natural barrier.
334
335
19 336
Figure 6: West-east directional filtering of the 2005–2010 deformation in arbitrary units. Bright areas
337
correspond to the highest values of W-E derivatives.The red line corresponds to possible sections of the
338
fault affected by differential displacement between the sides of the fault (located on linear features of the
339
filtered map). The three sections are identified using their different displacement behaviors.
340 341
A deeper analysis can be proposed. Based on both terrains offset measurements and magnitudes and
342
recurrences of earthquakes, Rimando & Knuepfer (2006) have suggested that on the Rodriguez-Taguig
343
segment (corresponding to sections A and B in this paper), the slip rate should be approximately 7–10
344
mm/yr and should be mostly horizontal. They observed that the ratio between vertical and horizontal
345
components of offsets is approximately 0.1. Considering the orientation of the fault with respect to the
346
satellite-orbit path angle (between 0° and 12°) and the SAR incidence angle (approximately 23°), 10 mm/yr
347
20
of horizontal motion would result in approximately 0.8 mm/yr change in the LOS direction. This value is too
348
small to be measured by DInSAR. Therefore, non-tectonic subsidence seems more likely to be the cause
349
of the SAR signal for these sections. Section C of the fault (the Sucat-Binan segment) is characterized by
350
en-echelon elements. According to the authors, this segment is creeping, but they do not provide rate
351
estimations. This complicated behavior is not incompatible with vertical motion; the hypothesis that the
352
DInSAR observation shows creeping phenomena for this section cannot be rejected, but further dedicated
353
analysis would have to be performed to assess fault motion in this area.
354 355 356
Figures 7 and 8 show profiles and estimations of the relative displacements between each side of the fault
357
using a 200-pixel length and stacked on 100 pixels width based on the COSI-Corr tools (for details on
358
these tools and a discussion of their reliability and precision, refer to Ayoub et al., 2009). These figures
359
show that on sections A and B, the recorded LOS displacements are variable with time (including an
360
inversion of the motion for section B). On the other hand, on section C, the LOS motion is fairly stable at
361
approximately 6 mm/yr velocity (with a dispersion of approximately 2 mm/yr). These observations are
362
compatible with the fact that the fault mechanism is mainly N-S oriented strike-slip on A and B (blind to
363
DInSAR), and therefore the recorded vertical component of the motion must be due mainly to (variable)
364
non-tectonic causes. Section C, with its en-echelon structure, is known to creep (Rimando & Knuepfer,
365
2006). Therefore, this research might have measured the vertical component of fault creep in this area.
366
367
368
21
369
Figure 7: Relevant deformation across-fault profiles for each section: LOS velocities are given in cm/yr and
370
the position in km (positive from west to east). These profiles are along fault stacks of 100 profiles 200
371
pixels in length (profile length: approximately 3.6 km) according to the procedure implemented in the COSI-
372
Corr tool (Leprince et al., 2007; Ayoub et al., 2009). The fault is approximately located, based on the
373
directional filtering results, by the vertical dashed lines. In blue: profile derived from the 2003 2005 stack; in
374
red, 2007 2010; in green, 2003-2010 The insets show the location of the profile stacks with respect to the
375
fault.
376
377
22
378
Figure 8: Differential LOS velocity for the sides of the fault (west side with respect to east side) versus
379
position on the fault (latitude). Velocities were obtained using the COSI-Corr tool. The 2003 2005 estimate
380
(in blue) is compared to that for 2007 2010 (in red) and 2003-2010 (green). Section C shows a
381
homogeneous behavior (vertical displacement of approximately 4 8 mm/yr), but the other sections show a
382
more temporally variable evolution (sign change) not compatible with creeping phenomena. The inset
383
shows the location of the profile stacks with respect to the fault.
384 385 386
4. Discussion 387
388
4.1
Comparison with in-situ observations389
390
23
While no leveling surveys are presently available in global data repositories (Santamaría-Gómez et al.,
391
2012), a few geodetic instruments enable comparing our InSAR results with in-situ observations. These
392
geodetic instruments in Manila can be located on Fig. 2a. However, one permanent GPS station (GPS
393
MANL) provided a time series too short to be analyzed at the time of this study. As can be seen in Fig. 9
394
(blue), the DORIS instrument was nearly stable in average in the 1990s, but was affected by uplift in the
395
2000s (Fig. 9, green).
396
The GPS PIMO station was also subject to a slight uplift in the 2000s (Fig. 9, yellow). The differential
397
movement between PIMO and DORIS was consistently too small to be observed with DInSAR. During
398
2003–2010, the differential displacement between PIMO and the tide gauge (TG) as estimated from
399
DInSAR was approximately 10.7 mm/yr +/- 2.1 mm/yr, based on the sum of the variances of the DInSAR
400
deformation-rate measurements obtained on 200 m windows around the PIMO and TG locations. Once
401
corrected using the GPS absolute vertical motion, the resulting TG motion with respect to the reference
402
ellipsoid was approximately 8 mm/yr of subsidence (+/- 2.2mm/yr). To validate this result, the difference
403
between the sea-level variation recorded by AVISO data (Archiving, Validation and Interpretation of
404
Satellite Oceanographic data) and the TG data (Fig. 10) was calculated. The altimetric monthly sea-level
405
anomalies were obtained from the AVISO data server (http://www.aviso.oceanobs.com/en/altimetry.html).
406
These data are a multimission product (Jason 1-2, Envisat, Cryosat) with a spatial resolution of
407
0.25ºx0.25º, starting in 1992. They include all geophysical corrections, in particular the dynamic
408
atmospheric correction that accounts for the effects of atmospheric pressure and wind (Volkov et al., 2007).
409
To compare the tide-gauge data with the altimetry observations, this correction was added back in. The
410
most highly correlated grid point of the altimetry observations was chosen for comparison with in-situ
411
observations (the correlation was computed using de-seasoned and de-trended time series). Alternatives
412
such as the closest grid point or an average among nearby grid points around 1° did not change the
413
results. The combination of the altimetric observations with the tide-gauge data highlights subsidence of up
414
to 10.1 mm/yr +/- 0.6 mm/yr.
415 416
Finally, in addition to the multi-annual ground motion variability observed by DInSAR, the GPS time series
417
also revealed seasonal vertical deformations with an amplitude of approximately 5.5 mm.
418
419
420
24 421
Figure 9: Observed DORIS (MANA/MANB) and GPS (PIMO) geocentric vertical displacements with respect
422
to the international reference frame. DORIS (blue before 2003, green after) and GPS (orange) position time
423
series are shown. Both stations were affected by uplift phenomena with similar rates. MANA and MANB
424
refer to successive DORIS instruments located at the same location (details on the instruments at http://ids-
425
doris.org/network/sitelogs.html /).
426 427
428
25
Figure 10: Tide-gauge subsidence in the geocentric international terrestrial reference frame based on the
429
difference between sea level derived from altimetry (AVISO data) and that from tide-gauge measurements.
430 431
432
Figure 11: Close-up images showing Line of Sight ground motion velocity maps (cm/yr) close to the tide
433
gauge. The deformation reference was chosen according to the DORIS measurements. Although ground
434
motions affecting the location of geodetic instruments are much smaller than in other parts of Manila, they
435
are still sufficient to alter the measurements of the tide gauge significantly, thus calling into question its use
436
before 1993 for sea-level estimation studies.
437 438
4.2 Implications for estimation of sea-level variation from TG measurements
439
Because sea-level rise exhibits significant regional variability (e.g., Meyssignac & Cazenave, 2012), one
440
critical issue for better estimation of past sea level before the altimetry era (1993) is the analysis of long-
441
26
term tide-gauge records. This question is particularly significant because there is a disagreement between
442
sea-level budgets as estimated (1) from tide gauges and (2) through independent evaluations of
443
thermosteric and continental ice-melting contributions (Munk, 2002).
444
Tide gauges measure sea level with respect to the land upon which they are grounded (local datum), while
445
global sea level refers to a geocentric reference frame. In other words, both the land and the sea can move
446
with respect to a geocentric reference frame. In practice, vertical ground motions can be removed from
447
tide-gauge measurements using a nearby GPS permanent station (e.g., Wöppelmann et al., 2007),
448
assuming that (1) the tide gauge and the GPS station follow the same vertical motion and (2) that the
449
deformation is linear. Under such conditions, extrapolation of the linear trend of ~10-years GPS time series
450
is valuable to estimate past land motion for at least 50 years. If the differential movements affecting the
451
instruments remained linear, advanced techniques such as PSI could be used as supplemental data to
452
reach the accuracy required of (~ 0.5 mm/yr) and subsequently to assess estimates of global sea-level rise
453
(approximately 1.7 mm/yr between 1950 and 2010, Wöppelmann et al., 2013)
454 455
However, the results reported here show that none of the requirements necessary to estimate geocentric
456
sea-level rise from GPS-corrected tide-gauge data is fulfilled in the case study of Manila. Therefore, this
457
method cannot be used here because of highly variable ground motion. Moreover, the spatial and temporal
458
variability of the surface motion, affecting both the tide gauge and the reference GPS, prevents any
459
extrapolation from corrected gauge time series over the past 50 years. If the differential motion between the
460
GPS and the tide gauge can be estimated for the period monitored by the space-borne radar sensor, the
461
current motion is not representative of past motion (previous to the satellite era). In addition, if the area of
462
maximum subsidence, initially located in Malaboon city, migrates southward, the tide-gauge area could be
463
affected by increased subsidence in the future.
464 465 466
This study encourages DInSAR monitoring at locations where long-term tide-gauge time series are
467
corrected using a distant permanent GPS to verify whether the typical assumptions used to combine the
468
datasets and to estimate geocentric sea-level variation are applicable.
469 470
5. Conclusions
471
27 472
Subsidence in coastal cities has many effects, potentially ranging from increased frequency of flooding to
473
damage to buildings. In the specific context of Manila, this study has provided the following responses to
474
the questions raised in the introduction:
475 476
(1) What was the spatial and temporal variability of ground-surface deformations in Manila from 1993
477
to 2010? This study has presented evidence for high rates of spatially and temporally variable
478
ground deformation in the Manila urban area (Philippines) based on space-borne SAR
479
interferometry during the last two decades. Displacements up to 15 cm/yr with temporal and spatial
480
variability have been observed. These ground motions are very likely related to groundwater
481
pumping because the Manila urban area is known to be affected by subsidence due to intensive
482
groundwater extraction (Clemente et al., 2001) and due to ground motion along the fault. Although
483
the origin of this latter motion could be tectonic, it is suggested here that the observed ground
484
motion along the fault is actually likely to be related to groundwater pumping as well (except on the
485
Sucat-Binan segment).
486
(2) To which extent do these deformations affect the locations of the tide gauge, the GPS stations, and
487
the DORIS stations? Observed ground motions affect the locations of several geodetic instruments
488
and therefore alter the potential of using their time series to understand past sea levels.
489
(3) What are the possibilities for using sea-level time series before 1993 in Manila? The Manila tide-
490
gauge time series cannot be corrected from its own motion for long-term sea-level estimation on
491
the basis of existing GPS data because the GPS station also experiences variable subsidence and
492
cannot therefore provide an estimate of the deformation occurring during the entire duration of the
493
TG record (the last century).
494 495
From a methodological point of view, this study provides an example of a site where InSAR is helpful in
496
assessing city-scale subsidence or uplift as well as the related consequences for measurements obtained
497
from geodetic instruments located in the city. Because of its deformation characteristics (location, extent,
498
and variable temporal evolution), the Manila metropolitan area has been revealed to be a challenging test
499
site both for application of deformation-monitoring techniques and for surface deformation-related risk
500
management. The approach proposed in this study could enable assessment of the usability of a number
501
28
of tide gauges suspected of having been affected by local ground motions and finally could provide help in
502
estimating sea-level evolution over the past century.
503 504 505
ACKNOWLEDGEMENTS 506
The work presented in this article was supported by the French National Research Agency (ANR) through
507
the CEP-2009 program (“Coastal environmental changes: impact of sea level rise” (CECILE) project under
508
grant number ANR-09-CEP-001-01). The SONEL data assembly center supported by INSU/CNRS is also
509
acknowledged for providing comprehensive access to GPS data and metadata. We also thank the
510
European Space Agency for providing data and four anonymous reviewers for their constructive comments.
511 512
REFERENCES 513
Ayoub, F., Leprince S., & Keene, L. (2009). User s Guide to COSI-CORR Co-registration of Optically
514
Sensed Images and Correlation, Pasadena: California Institute of Technology
515
(http://www.tectonics.caltech.edu/slip_history/spot_coseis/pdf_files/cosi-corr_guide.pdf)
516
Bock, Y., Wdowinski, S., Ferretti, A., Novali, F., & Fumagalli, A. (2012). Recent subsidence of the Venice
517
Lagoon from continuous GPS and interferometric synthetic aperture radar. Geochemistry Geophysics
518
Geosystems, in press, doi:10.1029/2011GC003976.
519
Brooks, B.A., Merrifield, M.A., Foster, J., Werner, C.L., Gomez, F., Bevis, M., & Gill, S. (2007). Space
520
geodetic determination of spatial variability in relative sea level change, Los Angeles basin. Geophysical
521
Research Letters, 34, L01611.
522
Clemente, R., Tabios, G., Abracosa, R., David, C., & Inocencio, A. (2001). Groundwater supply in Metro
523
Manila: distribution, environmental and economic assessment. Discussion Paper Series, 2001–2006,
524
Makati: Philippine Institute for Development Studies.
525
Chaussard, E., Amelung, F., Abidin, H., & Hong, S.H. (2013). Sinking cities in Indonesia: ALOS PALSAR
526
detects rapid subsidence due to groundwater and gas extraction. Remote Sensing of the Environment 128,
527
150-161.
528
29
Cigna, F., Osmanoğlu, C., Cabral-Cano, E., Dixon, T., Ávila-Olivera, J., Garduño-Monroy, V., DeMets, C.,
529
& Wdowinski, S. (2012). Monitoring land subsidence and its induced geological hazard with Synthetic
530
Aperture Radar Interferometry: a case study in Morelia, Mexico, Remote Sensing of Environment, 117,
531
146–161.
532
Daag, A., Bacolcol, T., Monstes, A., Kawai, M., & Tsutsui, K. (2011). Use of differential interferometry to
533
monitor ground deformation of Mayon Volcano and land subsidence north of Metro Manila and Bulacan.
534
Proceedings, 24th Annual Geological Convention of the Geological Society of the Philippines, Quezon City,
535
December 8–9, 2011.
536
Ferretti, A., Prati, C., & Rocca, F. (2001). Permanent scatterers in SAR interferometry. IEEE Transactions
537
on Geoscience and Remote Sensing 39(1), 8–20.
538
Hanson, S., Nicholls, R., Ranger, N., Hallegatte, S., Corfee-Morlot, J., Herweijer, C., & Chateau, J. (2011).
539
A global ranking of port cities with high exposure to climate extremes. Climatic Change 104, 89–111.
540
Hanssen, R. (ed.) (2001). Radar Interferometry: Data Interpretation and Error Analysis, Dordrecht: Kluwer
541
Academic.
542
IOC (2012). The Global Sea Level Observing System Implementation Plan 2012. Intergovernmental
543
Oceanographic Commission, Technical Series No. 100.
544
Jacinto, G., Azanza, R., Velasquez, I., & Siringan, F. (2006). Manila Bay: environmental challenges and
545
opportunities. In: Environment in Asia Pacific Harbors, 309-328, Dordrecht: Springer.
546
Kim, S., Wdowinski, S., Dixon, T., Amelung, F., Kim, J., & Won, J. (2010). Measurements and predictions
547
of subsidence induced by soil consolidation using persistent scatterer InSAR and a hyperbolic model.
548
Geophysical Research Letters 37, L05304 .
549
550
Lagios, E., Parcharidis, I., Sakkas, V., Raucoules, D., Feurer, D., Le Mouelic, S., King, C., Carnec, C.,
551
Novali, F., Ferretti, A., Capes, R., & Cooksley, G., (2006). Subsidence monitoring within the Athens basin
552
using advanced space radar interferometric techniques. Earth, Planets, and Space 58, 505–513.
553
30
Le Mouelic, S., Raucoules, D., Carnec, C., & King, C. (2005). A least-squares adjustment of multi-temporal
554
InSAR data: application to the ground deformation of Paris. Photogrammetric Engineering and Remote
555
Sensing 71, 197–204.
556
Leprince, S., Ayoub, F., Klinger, Y., & Avouac, J. (2007). Co-registration of optically sensed images and
557
correlation (COSI-Corr): an operational methodology for ground-deformation measurements. Proceedings,
558
IEEE International Geoscience and Remote Sensing Symposium (IGARSS 2007), Barcelona, July 2007.
559
Massonnet, D. , & Feigl, K. (1998). Radar interferometry and its application to changes in the Earth's
560
surface. Reviews of Geophysics 36(4), 441–500.
561
Meyssignac, B., & Cazenave, A. ( 2012). Sea level: A review of present-day and recent past changes and
562
variability. Journal of Geodynamics 58, 96–109.
563
Munk, W. (2002). Twentieth-century sea level: an enigma. Proceedings of the National Academy of
564
Sciences of the United States of America 99, 6550–6555.
565
National Statistics Office of the Republic of the Philippines (2010). 2010 Census of Population and
566
Housing, National Capital Region. Available at :
567
http://www.census.gov.ph/sites/default/files/attachments/hsd/pressrelease/National Capital Region.pdf.
568
Pepe, A., Sansosti, E., Berardino, P., & Lanari, R. (2005). On the generation of ERS/ENVISAT DInSAR
569
time series via the SBAS technique. IEEE Geoscience and Remote Sensing Letters 2(3), 265–269.
570
Peltzer G., Crampé F., Henley, S., & Rosen P.(2001). Transient strain accumulation and fault interaction in
571
the Eastern California shear zone, Geology, 29: 975-978
572
Raucoules, D., Bourgine, B., De Michele, M., Le Cozannet, G., Closset, L., Bremmer, C., Veldkamp, H.,
573
Tragheim, D., Bateson, L., Crosetto, M., Agudo, M., & Engdahl, M. (2009). Validation and intercomparison
574
of Persistent Scatterers Interferometry: PSIC4 project results. Journal of Applied Geophysics 68, 335–347.
575
Raucoules, D., Parcharidis, I., Feurer, D., Novalli, F., Ferretti, A., Carnec, C., Lagios, E., Sakkas, V., Le
576
Mouelic, S., Cooksley, G., & Hosford, S. (2008). Ground deformation detection of the greater area of
577
31
Thessaloniki (Northern Greece) using radar interferometry techniques. Natural Hazards and Earth System
578
Sciences 8, 779–788.
579
Rimando, R., & Knuepfer, P. (2006). Neotectonics of the Marikina Valley Fault system (MVFS) and tectonic
580
framework of the structures in northern and central Luzon, Philippines. Tectonophysics 415, 17–38.
581
Rodolfo, K.S., & Siringan, F.P. (2006). Global sea-level rise is recognized, but flooding from anthropogenic
582
land subsidence is ignored around northern Manila Bay, Philippines. Disasters 30, 118–139.
583
Santamaría-Gómez, A., Gravelle, M., Collilieux, X., Guichard, M., Miguez, B.M., Tiphaneau, P., &
584
Wöppelmann, G. (2012). Mitigating the effects of vertical land motion in tide gauge records using a state-of-
585
the-art GPS velocity field. Global and Planetary Change 98–99, 6–17.
586
Siringan, F.P., & Ringor, C.L. (1998). Changes in bathymetry and their implications for sediment, dispersal
587
and rates of sedimentation in Manila Bay. Science Diliman 10(2), 12–26.
588 589
Tandanand, S., & Powell, R. (1991). Determining horizontal displacement and strain due to subsidence.
590
Washington D.C.: U.S. Dept. of the Interior, Bureau of Mines.
591 592
Usai, S. (2003). A least-squares database approach for SAR interferometric data. IEEE Transactions on
593
Geoscience and Remote Sensing 41(4), 753–760.
594 595
Volkov, D.L., Larnicol, G., & Dorandeu, J. (2007). Improving the quality of satellite altimetry data over
596
continental shelves. Journal of Geophysical Research 112, C06020.
597
Williams, S.D.P. (2008). CATS: GPS coordinate time series analysis software. GPS Solutions 12(2), 147–
598
153.
599
Willis, P., Fagard, H., Ferrage, P., Lemoine, F.G., Noll, C.E., Noomen, R., Otten, M., Ries, J.C., Rothacher,
600
M., Soudarin, L., Tavernier, G., & Valette, J.J. (2010). The International DORIS Service: toward maturity.
601
In: DORIS: Scientific Applications in Geodesy and Geodynamics, Advances in Space Research
602
45(12):1408–1420.
603
32
World Bank (2010). Climate risk and adaptation in Asian Coastal Megacities: a synthesis report. 97p.,
604
available at : http://siteresources.worldbank.org/EASTASIAPACIFICEXT/Resources/226300-
605
1287600424406/coastal_megacities_fullreport.pdf.
606
Wöppelmann, G., Miguez, B.M., Bouin, M.N., & Altamimi, Z. (2007). Geocentric sea-level trend estimates
607
from GPS analyses at relevant tide gauges world-wide. Global and Planetary Change 57, 396–406.
608
Wöppelmann,G., Le Cozannet,G., de Michele,M., Raucoules,D., Cazenave,A., Garcin,M., Hanson, S.,
609
Marcos, M., & Santamaría-Gómez A. (2013). Is subsidence increasing the exposure to sea level rise
610
impacts in Alexandria, Egypt? Geophysical Research Letters 40, 1-5.
611
Wegmuller, U., Werner, C., & Strozzi, T., (1998). SAR interferometric and differential interferometric
612
processing chain. Proceedings, International Geoscience and Remote Sensing Symposium (IGARSS), 2,
613
1106–1108, July 1998, Seattle.
614 615
Wright, T., Parsons, B., & Lu, Z. (2004). Towards mapping surface deformation in three dimensions using
616
InSAR. Geophysical Research Letters 31(1), L01607.
617 618
Zebker, H., Rosen, P., & Hensley, S. (1997). Atmospheric effects in interferometric synthetic aperture radar
619
surface deformation and topographic maps, Journal of Geophysical Research: Solid Earth – B2 102, 2156-
620
2202