HAL Id: jpa-00248380
https://hal.archives-ouvertes.fr/jpa-00248380
Submitted on 1 Jan 1996
HAL is a multi-disciplinary open access archive for the deposit and dissemination of sci- entific research documents, whether they are pub- lished or not. The documents may come from teaching and research institutions in France or abroad, or from public or private research centers.
L’archive ouverte pluridisciplinaire HAL, est destinée au dépôt et à la diffusion de documents scientifiques de niveau recherche, publiés ou non, émanant des établissements d’enseignement et de recherche français ou étrangers, des laboratoires publics ou privés.
Surfactant Solutions
R. Larson
To cite this version:
R. Larson. Monte Carlo Simulations of the Phase Behavior of Surfactant Solutions. Journal de
Physique II, EDP Sciences, 1996, 6 (10), pp.1441-1463. �10.1051/jp2:1996141�. �jpa-00248380�
Monte Carlo Simulations of the Phase Behavior of Surfactant Solutions
R-G- Larson
(*)
Bell
Laboratories,
LucentTechnologies,
700 Mountain Avenue,Murray
Hill, NJ 07974, USA(Received
19 March 1996, revised 10 June 1996,accepted
2July1996)
PACS.61.20.Gy Theory
and models ofliquid
structure PACS.61.20.JaComputer
simulation ofliquid
structure PACS.64.70.Md Transitions inliquid crystals
Abstract. Phase
diagrams
are determined by Monte Carlo lattice simulations for ideal-ized symmetric and asymmetric surfactant molecules mixed with
single-site
"oil" and "water"molecules. At
high
concentrations(above 20%)
ofsurfactant,
the simulations show the selfassembly
ofliquid crystalline phases, including
smectic,hexagonal,
BCCsphere packings,
and Ia3dgyroid
cubic phases. The locations of thephases
on thediagram
forasymmetric
surfac-tants in "water" are shifted relative to those for a
symmetric
one ina way that favors
phases
whose surfactant-laden interfaces curve so that the bulkier group is on the convex side of the interface. When the system composition isgradually changed, cylinders
of ahexagonal phase
are oriented
along
the 111 direction of the micellar BCC or Ia3dphase
into which thecylinders epitaxially transform,
with thed-spacing
ratios of 1.22 and 2.12,respectively.
These and many other aspects of thepredicted phase behavior, including
thecompositions
at which transitionsamong ordered
phases
occur, comparefavorably
withexperimental
observations for nonionic,cationic,
anionic,
and zwitterionicsingle-tail
surfactants.1. Introduction
The
phase diagrams
of surfactants orlipids
mixed with waterand/or
oil show both universal andparticular
features.Many
of the samephases
are recurrent inwidely disparate systems, including lamellar, hexagonal cylindrical,
disorderedmicellar,
and intermediate[1-6].
How-ever, other aspects of the
phase
behavior are sensitive toamphiphile type, temperature,
andthe presence and amounts of
solvents, co-surfactants,
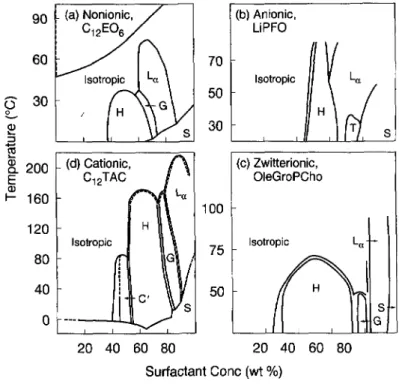
and salts.Figure
I illustrates some "uni-versal",
as well as"non-universal", aspects
of thephase
behavior in water of fourdisparate single-tailed
surfactants: anonionic,
an anionic, acationic,
and a zwitterionic surfactant. Ineach case, there are, with
increasing
surfactantconcentration,
transitions from a disorderedsolution of
spherical
micelles to ahexagonal packing
ofcylinders (Hi,
then to an intermediatephase (G; except
in(b);
seebelow),
andfinally
to a lamellarphase (L~).
Similar behavior isobserved in aqueous solutions of other
single-tailed
surfactants[7-9].
In each case inFigure I,
the order-disorder transition onheating
orcooling
occurs at thehighest temperature
for the lamellarphase,
the nexthighest temperature
for thehexagonal phase,
and at lowertemperal
tures for the other
phases.
Note also that the order-order transitions in each case arelargely
(* e-mail:
rglfilikewise.att.com
90 (a) Nonionic, 16) Anionic, LiPFO
60 70
isotropic ~« Isotropic L«
]
30 ~~, / H H
E 3°
(
s[
~~~ (d) Cationic, (C) Zwitterionic,E Ci ~TAC OleGroPcho
g
~~~~
l00
120 H
Isotropic Isotropic
80 ~~
40 so H
o
20 40 60 80 20 40 60 80
Sudactant Conc (w1
%)
Fig.
1. Phasediagrams
of four surfactants in water. "H" and "L~", stand forhexagonal
and lamellarphases,
"G" and "T"are
gyroid
cubic andtetragonal
mesh intermediate phases, "C"' is a cubicpacking
ofspherical
micelles, and "S" stands forcrystalline
solid.(a) hexa-ethyleneglycol
monon-dodecyl
ether, C12E06(from
Clerc et al. [4]), 16) lithiumperfluorooctanoate.
LiPFO(from
Kekicheff andTiddy,1989), (c) 1-oleoyl-sn-glycero-3-phosphocholine.
OleGroPcho(from
Arvidson et al. [2]), and(d) dodecyltrimethylammonium
chloride CI2TAC(from
Balmbra et al.[ii
).tyotropic
thatis, they
are drivenmainly by changes
in concentration, not temperature.These similarities among the
phase diagrams
for different surfactant moleculessuggest
that thephase
transitions are drivenmainly by
"'universal" features of surfactantmixtures,
such asvolume-filling constraints, entropies
andenergies
ofmixing,
andentropies
of surfactant chain conformation.However,
there are also some differences among thephase diagrams
ofFigure
1. For one surfactant(the cationic),
there is a cubicphase wedged
between thehexagonal cylinder~
and the disorderedspheres;
this is almostcertainly
a cubicpacking
ofspheres.
Inaddition,
theparticular
intermediatephase
that forms varies from one surfactant to the next. Forexample,
a"mesh"
phase
"T"phase), consisting
oftetragonally
ordered holesperforating
lamellarsheets,
forms at lowtemperatures
in thesystem containing
the anionicperfluorooctanoate surfactant,
while cubic Ia3d intermediatephases,
called"gyroid" (G) phases,
are formedby
the other threesurfactants in
Figure
I.Also,
the order-order transitioncompositions
vary from one surfactant to the next. InFigure
I, forexample,
the lamellarcompositional
window shifts to theright
aso,ne moves in the clockwise
progression
froma)
tod).
A similar ~hift occurs in thehexagonal
window of
compositions, except
that this window isenlarged
for the zwitterionicsurfactant, Figure
lc.Divergences
from thephase
behaviortypified by Figure
I can be found in aqueous solutions of one- or two-tailedlipids
[5,6],
for which the tail groups areespecially bulky. Example phase
1-monoolein
J-D-glucopyranosyl-rac-glycerol
100
~°°
la)
-/ 16)
~©~~~fi
H~~+ H~0
% %
80Ha
fi
p
8° L2 / /(
~/-~+
~~ ~- ~/
~°
~II
i
G D~+ H~0E Ii
#
=-_i 40 La
40
L~ =
L~
Lj
+ H~0= ~_ 20
~j~p~~~;~~
20 40 100 0 10 20 30 40 100of
Crystals weight
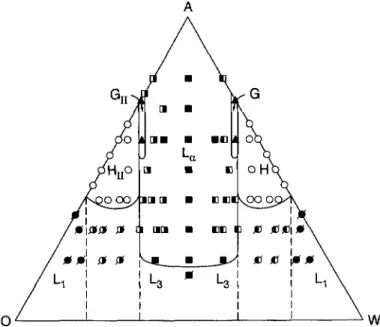
WaterFig.
2. Phasediagrams
for(a)
1-monoolein in water(from
Larsson[5]),
and(b) di-dodecyl
alkyl-p-D-glucopyranosyl-rac-glycerol (from
Turner et al. [6]) in water. "HIT" is the inversehexagonal phase,
GII is the inversegyroid Ia3d,
and "DII" is the inverse double-diamond Pn3m phase. In the inversephases,
the aqueousphase
is inside the channels.diagrams
for I-monoolein [5] and fordi-dodecyl alkyl-p-D-glucopyranosyl-rac-glycerol
[6] areshown in
Figure
2. These are dominatedby
inversephases, naInely
an inverse Ia3d(GII),
aninverse Pn3m "double-diamond"
(DII)
cubicphase,
and an inversehexagonal phase (HII).
A
pattern
ofuniversality
andparticularity
alsoprevails
in thephase
behavior of dibtockcopolymers.
Diblockcopolymers
arepolymeric amphiphiles consisting
of twochemically
dis- tinct linearpolymer chains,
with one end of one chaincovalently
bonded to one end of the other. These also show aprogression
from disorderedspheres
tocubically
orderedspheres
tohexagonal cylinders
to lamellarphases
when acomposition variable,
such as the ratio of the blocklengths,
or the concentration of addedhomopolymer,
is varied[10,11].
Diblockcopoly-
mer
phase diagrams
also have "nonuniversal"features;
inparticular,
the intermediatephase
betweenhexagonal
and laInellar can be either a "mesh"phase
with rhombohedralsymmetry,
or a cubic
phase,
with Ia3dsymmetry [12-15].
As withsuifactants,
the locations on thephase diagram
of the orderedphases
can varysomewhat, depending
on the molecular structure.In this paper, we seek to understand some of the sources of
universality
andnon-universality
in the
phase diagrams
of such surfactant and blockcopolymer systems by using
asimple
Monte Carlo lattice
model,
one which containsonly
the most basic features ofamphiphilic systems [16-18].
These basic features are thenear-neighbor
relativerepulsion
between unlike chemicalmoieties,
theconfigurational entropy
of the chain-like surfactant(or block-copolymer molecules,
theentropies
ofmixing,
and the excluded-volume orspace-filling requirements
ofcondensed states of matter. Since these
physical
features areuniversal,
we believe that thephase
behaviorpredicted by
thissimple
model can beregarded
as aprototype against
which the behavior of real systems can becompared.
Suchcomparisons
willhelp distinguish
the characteristics of the realsystems
that are due to the basic features of surfactants described above from those that have theirorigins
in theparticularities
of these realsystems,
such as the details of molecularshapes,
molecularstiffness,
ioniceffects, hydrogen bonding,
etc.Although
the model we introduce has one
peculiarity
of its own,namely
itsunderlying lattice,
we haveshown elsewhere
[18]
that the lattice introducesremarkably
fewartifacts,
and cansupport essentially
all thephases
observed in thesesystems: disordered, lamellar, hexagonal,
cubic and"mesh" intermediate
phases,
as well as cubicpackings
ofspheres.
2. Lattice Model and Simulation
Technique
The details of the Monte Carlo lattice model have been discussed elsewhere
[16,17].
The simulated surfactantmoleculej designated HzTj,
is a sequence ofI "head" units connected toj
"tail"
units,
each unitoccupying
one site on thesimple
cubiclattice,
withperiodic boundary
conditions. A site on the
amphiphilic
chain can be connected to any of its z = 26niarest
or
diagonally-nearest neighbors.
Theamphiphile
is thus a sequence of N= I +
j
units that remain attachedtogether
vianearest-neighbor
ordiagonally-nearest-neighbor bonds;
Monte Carlo moves that sever anamphiphile
arerejected.
The "solvent" molecules in the simulation are of two
types,
which we call "water" and "oil".These are taken to be
chemically identical, respectively,
to the "head" and "tail" units on theamphiphile
chain. Each unit interactsequally strongly
with all 26 nearest anddiagonally-
nearest
neighbors.
There is asingle
dimensionless interaction energy parameter w, which is the interaction energy per head/tail contact,
dividedby kBT.
Forconvenience,
we shall refer to I/w
as
simply
the"temperature"
of the system. The scale of theenergetic
interactions betweenoil and water solvent molecules is controlled
by
theproduct
zw; forexample
w= 0.1538
corresponds
to zw=
4,
which is a factor of twohigher
at the mean-field criticalpoint
zw= 2
for an
oil/water
mixture.Thus,
at w=
0.1538,
the oil and water have astrong tendency
to demix. A second relevant energy scale controls the
tendency
of the head and tail units of theamphiphile
tomicro-separate
from eachother;
this energy scale is Nwz. For N= 8 and
W =
0.1538,
we obtain Nwz=
32,
a valuelarge enough
that theamphiphile
tends to formmicroseparated
domains orliquid crystalline phases,
such as smectic andhexagonal phases.
The
amphiphilic
molecules rearrange themselves on the latticeby "reptation"
and "kink"- likemotions,
as discussed elsewhere[16,17].
Areptation
move consists in the movement of one of the two end units of chain(say
unit "I" into asolvent-occupied
site. Unit "2" of the chain is then moved into the siteformerly occupied by
unit"I",
unit "3" into the unit "2"site,
etc.The site vacated
by
the last unit of the chain is taken upby
the solvent unitdisplaced
from its siteby
unit "I". A "kink" motion is the movement of asingle
chain unit into aneighboring site,
with thedisplaced
theoccupant
of that sitemoving
into the site vacatedby
the chain unit. Moves areaccepted
orrejected using
the usualMetropolis
scheme. As in earlierwork,
weobtain
equilibrium
ordered or disorderedphases
on L x L x Llattices,
where L is aninteger, by starting
at infinite temperature(w
=0),
and"cooling"
thesystem by increasing
w in smallincrements until the desired value of w is reached.
In
previous work,
the volume fractions of oil and water were both held fixedduring
thesimulation;
thus theMetropolis sampling
was carried out within a closed ensemble. For sim- ulations in the closedensemble,
one chooses the desired volume fractions ofoil,
water, andarnphiphile.
Then oneequilibrates
the system at "infinitetemperature," I-e-,
at w =0;
low-ers the
temperature by raising
w; andre-equilibrates
at thishigher
value ofw. Further
step
increases in w followedby re-equilibration
are thenmade,
with increments in wusually kept
below Aw <0.01,
until thedejired
valueof
w is reached. Theequilibrated
structure is thenidentified, by inspection,
as a disordered one, or as one of theregular
structures:lamellar, hexagonal, body-centered
cubic micelles(BCC),
orgyroid,
and the size of the unit cell is iden- tified. If the structure islamellar,
it is examined for the presence ofperforations
in either thewater-continuous
layer
or the oil-continuous one.We also find it convenient to use in some simulations a
partially
open ensemble in which oilunits can be
replaced by
water, and vice versa,during
a run. These runs are carried out at a fixed chemicalpotential
difference A~J e (~Jo /£w)/kBT,
between oil and water. Toimplement
thisscheme,
theMetropolis algorithm
is modified in an obvious way: the dimensionless energychange AE/kBT resulting
from anexchange
of a water for an oil unit isevaluated,
and added to the chemicalpotential
differenceA~J.
If the result isnegative,
the move isaccepted;
if it ispositive,
it isaccepted
withprobability exp(-(AE/kBT+A~t) ).
In these"partially open"
runs, theamphiphile
concentration remainsfixed,
as it does in runs in the closed ensemble.Using
the systemconfiguration generated
at agiven
value of A~J as astarting
state for a new run with anincrementally
different value ofA~J,
theoil/water
ratio and structure can then evolve away from that establishedduring
theprevious
run. If there is aphase transition,
the newphase
isidentified,
the chemicalpotential
ischanged again,
and a new run initiated. Because thecomposition
can be varied at fixed w in simulations withpartially
open systems, morerapid exploration
of thephase diagram
at agiven
w ispossible
than in the closed ensemble.In
addition,
with thepartially
openensemble,
we find order-orderphase
transitionsreadily
occur, and the
epitazial relationship
between the two ordered structures can be determined.Furthermore,
in apartially
openensemble,
the presence ofmulti-phase regions
can sometimes berecognized by
the occurrence of anabrupt change
incomposition resulting
from a smallchange
inA~J.
As discussed
below,
we find somehysteresis
in thecomposition
at whichphase
transitions occur; I-e-, thecomposition
at which a transition occurs candepend
on the direction in whichA~J
ischanged.
Thehysteresis
can becomelarge
at low concentrations of surfactant(20%
by
volume orless).
In such cases, simulations on the closed ensemblehelp
determine moreaccurately
the locations ofphase
boundaries. Run durations arearound 105 attempted
Monte Carlo moves per lattice site at lowtemperatures (w / 0.I). Systematic
drifts in thesystem
energyaveraged
over the run prove to be tell-talesigns
of aprogressing phase
transition.Whenever such drifts are
detected,
the runs are extended aslong
as necessary at fixed w to achieve anearly
constant average energy; see[17]
for more details.As shown in
[18],
lamellar andhexagonal phases
can form within almost any simulation box(with periodic boundary conditions)
that islarger
than the minimumrequired
to form asingle
unit cell. Thesephases
possess at least one infinitewavelength,
and can therefore orient themselves within in the simulation box so that the finitewavelengths
of the patternnearly
match those of
infinite, bulk, samples.
Forphases
with cubicsymmetry, however,
the box size must benearly
amultiple
of the unit cell for the cubicphase
to form.Fortunately,
the proper unit cell size can be estimated from thespacings
ofhexagonal
and lamellarphases
inneighboring regions
of thephase diagram.
We find that the unit-cell size of abody-centered-
cubic micellar
phase
is 1.22 times thespacing
betweenhexagonal cylinders
in aneighboring region
of thephase diagram.
The unit-cell size of thegyroid phase
is about 2.45 times the lamellarrepeat period
of aneighboring
lamellarphase,
or about 2.12 times that of aneighboring hexagonal phase.
With theserules,
aregion
of thediagram
that issuspected
ofbeing
able to support a cubicphase
can be examinedby running
a simulation in a box whose size matchesa
multiple
of theexpected
unit cell. For these reasons andothers,
boxes of various sizes andshapes
areused, ranging
from 20 x 20 x 20 to 84 x 84 x 84.3. Results
3.I.
LIQUID
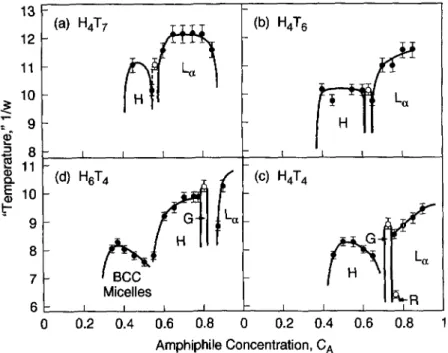
CRYSTALLINE PHASES IN WATER.Figures
3a-d show(in
clockwise direc-tion)
thetemperature-composition phase diagram
forH4T7, H4T6, H4T4,
andH6T4,
in wateronly.
Thesephase diagrams
are determined in the closed ensembleby fixing
theamphiphile
concentration and
slowly "cooling" by increasing
w in smallincrements,
Aw=
0.0038,
until an13
~~
(a) H4T7
16)H4T6
11
,
(
lo H L
d
~
"
T
9 Hf ~j
~
'
lo
~~~
~~~~
~~~~~~~
~
~
9 G
"
H
~
~
(
7
~
H Micelles
6
0 0.2 0.4 0.6 0.8 0 0.2 0.4 0.6 0.8
Amphiphile Concentration,
CAFig.
3. Phasediagrams
ofla) H4T7, (b)
H4T6,(c)
H4T4, andid)
H6T4 in "water". "H" and"L~" stand for
hexagonal
andlamellar,
"G" and "R" are cubicgyroid
and rhombohedral-like mesh intermediatephases,
and "BCC micelles" is abody-centered
cubicpacking
ofspherical
micelles. The closed circles arephase
boundaries determined on 30 x 30 x 30 lattices, while the open circles weredetermined on lattices of others sizes,
namely
24 x 24 x 24 for thegyroid phases
for H4T4 and H6T4, 26 x 26 x 26 for thegyroid pbase
for H4T6, 29 x 29 x 29 for thegyroid phase
for H4T7, and 34 x 34 x 34 for the rhombohedral-like meshphase
for H4T4. Thegyroid phase
for H4T7 is marked by dashed lines,because it does not appear in every run, and may be metastable.
ordered
phase
appears. Runs are carried out on 30 x 30 x 30boxes,
except for thoseproduc- ing
thegyroid
and rhombohedral-likephases (see below).
Thephases
are identifiedby
directinspection.
The transition from a disordered to an orderphase
istypically signaled by
adrop
in
system
energycorresponding
to the loss of up to o-I water-tail contacts per lattice site.Images
oflamellar, cylindrical,
and BCC micellarphases
are shown later(see
also[17,18]).
A
phase
notreported
in earlier simulations is the"gyroid",
with Ia3dsymmetry.
Forsymmet-
ricsurfactants, including
notonly H4T4,
but alsoH3T3
andH6T6,
thisphase
appears at aconcentration of
CA
= 0.73 in water.
Probably
thisphase
forms for anysymmetric amphiphile
in the
homologous
seriesHzTz,
aslong
as N = 21equals
or exceeds 6. Forsymmetric
surfac- tants, thegyroid phase
appearsonly
over a very narrow rangeRCA
of surfactantcompositions, RCA
G- 0.02-0.03. ForH6T6,
forexample,
agyroid phase
forms atCA
" 0.73 and
0.74,
but notat 0.725 or 0.745. The
gyroid only
appears in boxes thatclosely
match thegyroid's preferred d-spacing;
forH6T6,
it appears for 27 x 27 x27,
but not on 25 x 25 x 25 nor on 29 x 29 x 29 lattices. ForH3T3
andH4T4,
thegyroid
appears for 21 x 21 x 21 and 23 x 23 x 23lattices, respectively.
The unit cell dimensions forH3T3, H4T4,
andH6T6 correspond,
for each surfac-tant,
to a dspacing
that is about 2.45 times therepeat spacing
of the lamellarphase
that forms at concentrationsslightly higher
than that for thegyroid phase.
In each of these cases asingle
unit cell of the
gyroid
forms in thegiven
box size. Runs with boxeslarge enough
to contain23
= 8
gyroid
unit cells are slow toequilibrate,
and have notyet produced
self-assembledgyroid phases.
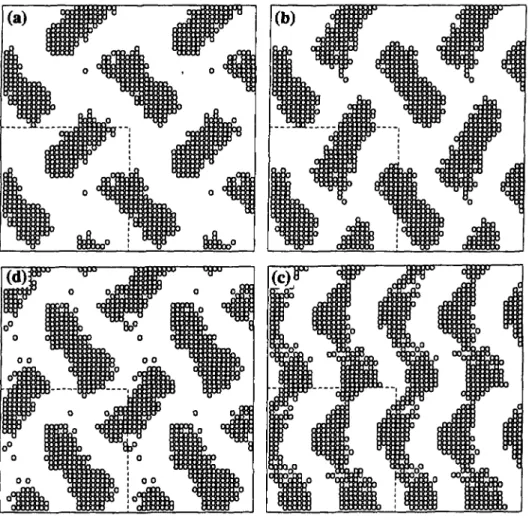
The structure of the
gyroid phase
for73% H6T6
on the 27 x 27 x 27 lattice isdepicted
inFigures
4 and 5.Figures
4a-d show slices1, 3, 5,
and 7 from thisphase,
whileFigures
5a-d show slices 8, 10,12,
and 14. The dashed lines are theboindaries
of the simulationbox;
the rest of theimage
is formedby periodic replication
of theimage
inside the dashed lines. On slice I(Fig. 4a),
there is a"herring-bone"
pattern with two distincttail-containing
domains per unitcell;
anexperimental
pattern similar to this can be found in an electrondensity
map for thegyroid phase
ofdodecyl-trimethyl
ammonium chloride(DTAC) [9].
In slice3, (Fig. 4b),
the domains are rotated
slightly
relative to sliceI,
and in slice 5(Fig. 4c)
each domain is connectedvertically
with its twoimage
domains in the twoneighboring
unit cells to form twoseparate zig-zag stripes
per unit cell. Thesestripes
breakapart
in slice 7(Fig. 4d), leaving
domains that are of similar
shape
and size as those in slice Iexcept
shiftedhorizontally
with respect to slice Iby
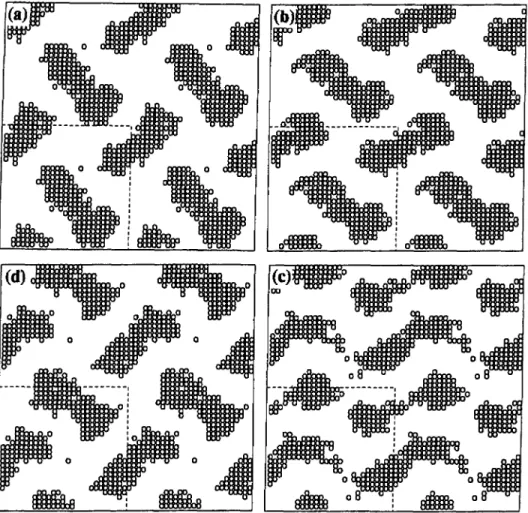
half a unit cell.Figures 5a-d, representing
slices 8through 14,
show aprogression analogous
to that ofFigures
4a-d.except
that inFigure
5 the domains connect(or nearly connect)
in the horizontaldirection;
compareFigure
5c withFigure
4c. The lack of acomplete
connection in the horizontal direction inFigure
5cmight represent
an artifact of thelattice,
ormight
be due to thermal fluctuations that are alsopresent
in real systems.Figure
5d, whichrepresents
slice14,
is similar toFigure 4a,
which represents sliceI;
except that in slice 14 the domains are shiftedhorizontally
andvertically by
half a unit cell. Slices 15through
27(not shown) just repeat
theprogression
shown in slices Ithrough 14, except
witha half-unit-cell offset in both horizontal and vertical directions.
Thus,
theprogression
in slices 15through
27 shifts the domains another half unit cellhorizontally
andvertically, bringing
them back to the
positions they
occupy in slice I.Tracing
the domains from slice to slice inFigures
4 and 5, one finds that there are twointerpenetrating,
butnon-intersecting,
strut networks oftail-containing
units. The existence of these networks within the Ia3dsymmetry
group was inferred 30 years agoby
Luzzati et al.[19,20]
inlipid/water systems;
the structurethey proposed
for thisphase
is shown inFigure
6. Thetopology
of thepair
ofinterpenetrating
networks sketched inFigure
6 is identical to that obtained in the simulations: seeFigures
4 and 5. Thegyroid phase
has also beenobserved in diblock
copolymer [13-15],
andrecently their,existence
in a narrow range of block-copolymer compositions
between lamellar andhexagonal phases
has beenpredicted by
a self- consistent fieldtheory [21].
Transmission electronmicrograph images
of thegyroid phase
when viewedalong
the lll'axis of the Ia3d unit cell have the"wagon
wheel"morphology
shown inFigure
7b. Thisimage
was obtainedby
Thomas et al.[12j
on apolystyrene-polyisoprene
blockcopolymer,
and the observedphase
was at that time(probably incorrectly) thought
to bea "double diamond"
phase.
which is a cubicphase closely
related to thegyroid.
Electron-micrograph images,
such as that inFigure 7b,
are obtained onsamples
that are Inany unit cellsthick,
and so theimages
areprojections
of thecompositional pattern along
theviewing direction,
in this case the ill direction.By generating
such aprojection along
the 111 direction for the simulatedgyroid phase
for73% H6T6,
andusing high
contrastprinting,
one obtains theimage
shown inFigure 7a,
which is similar to theexperimental image
inFigure
7b.Projections
such as
Figure
7 do not allow thegyroid phase
to beclearly distinguished
from the double- diamondphase.
The distinction can be made in thesimulations, however, by viewing
thesingle-layer slices,
such as those ofFigures
4 and 5; theseclearly
show thetopology
of the strut network to be that of thegyroid phase.
Forexperimental systems, high-order X-ray
diffractionspots
allow thegyroid phase
to bedistinguished
from the double diamond[13-15].
Iii
Figure 3,
the values of w at which disorder-order transitions occur are someq.hatdependent
on the size of the box used in the simulations. The
largest
box-size effects are observed for theO~,
O~
~
i i
i i
' i
~
O O
o o
o
o o
oo oo
~o
o o
o o
oo ' oo
Fig.
4. Successiveparallel
slices(a)
I,(b)
3,(c)
5, and(d)
7 of agyroid
structure of 73% H6T6 inwater at w = 0.1385
on a 27 x 27 x 27 lattice. The circles are the tail groups.
cubic micellar
phases.
For50% H6T4,
anespecially large
lattice-size effect occurs; anordering
transition to a micellar BCC
phase
is observed at w= 0.1347 on a 30 x 30 x 30
lattice,
and at w = 0.ll19 on a 28 x 28 x 28 lattice. On bothlattices, eight
BCC unit cellsspontaneously
form at theordering transition;
thatis,
the unit cell size is 15 on the 30 x 30 x 30 lattice and 14 on the 28 x 28 x 28 lattice. Boxes whose dimensions differ too much from thepreferred spacing
cannot support a micellar BCCphase,
however. Forhexagonal
and lamellarphases,
the effect of lattice size is much
smaller;
forexample,
for60% H4T4,
ahexagonal phase
first forms oncooling
at w = 0.1270 on a 30 x 30 x 30lattice,
and at w= 0.1308 on a 40 x 40 x 40 lattice. There is also
hysteresis;
onheating (raising w)
the transition occurs at a smaller value of w than oncooling.
Themagnitudes
of thehysteresis
effects are discussed in[17].
Thegyroid phase
isespecially
sensitive to box size andonly
forms on boxes very close(+1
latticeunit)
to thepreferred
size.Because of
hysteresis
and box-sizeeffects,
thephase diagrams reported
inFigure
3 aresemi-quantitative. Nevertheless,
there are remarkable similarities between thecomputed phase
i
I I
, ,
, ,
, ,
, ,
, i
, i
i
~~
~
o o
o
off
,
o
o
o
Fig.
5. Slices(a)
8,(b)
10,(cj
12, and(d)
14 ofthegyroid phase
ofFigure
4.diagrams
inFigure
3 andexperimental
ones inFigure
1. Theexperimentally
observedphases:
lamellar, gyroid, mesh, hexagonal,
and micellarBCC,
all occur in thesimulations,
and the ranges ofcompositions
at whichthey
appearcorrespond
well with theexperimental
ranges.For a discussion and
images
of the simulated "mesh" tetrahedral and rhombohedralphases,
see
[17,18].
Note inFigure
3 that theordering "temperature" 1/w
ishighest
for the lamellarphase,
and lowest for the BCC and meshphases,
in accord with theexperiments. Although
forH4T4
andH6T4,
the transition to thegyroid phase
occurs at ahigher "temperature" 1/w
thandoes the transition to
cylinders,
indisagreement
with theexperiments (see Fig. 1),
the box size used to obtain thesegyroid phases,
24 x 24 x 24 for bothH4T4
andH6T4,
issignificantly
smaller than that used to obtain thecylinder phase.
The smallerbox,
which containsonly
asingle
Ia3d unit
cell, probably artificially
enhances thestability
of thegyroid phase,
and increases theordering
transitiontemperature.
ForH4T6
andH4T7,
the box sizes used to obtain thegyroid phase
arelarger,
26 x 26 x 26 and 29 x 29 x29, respectively,
and the transitions to thegyroid phase
occur at lowertemperatures
relative to those for thehexagonal phase;
seeFigures 3a,
b.Figure
3 also shows that eachliquid crystalline region
shifts towards ahigher
range of1/8 7/8
~~h~ ~ ~
5/8
/
7/85/8
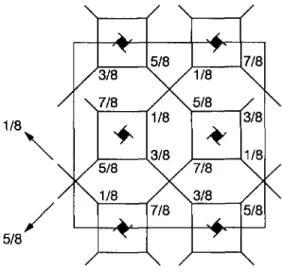
Fig.
6. Schematic representation of thegyroid
structure, which is abody-centered
with space group Ia3d. The structure consists of identicalfinite-length
rods three ofwhich join at each junction,forming
two
interpenetrating
three dimensional networks. The axes of the rods arerepresented by
solidlines;
the thin lines shows the unit-cell boundaries. Th~ fractions are the z coordinates
(into
thepage)
of the structure, with the dimension of the unit cell normalized to unity(from
Luzzati et al.[20]).
(a)
'
(b)
Fig.
7.a) "Wagon
wheel"image
ofgyroid phase
formedby
73% H6T6 in water on a 27 x 27 x 27 lattice which wasperiodically
extended. Theimage
was formedby
projectionalong
the 111 axis of the unit cube,using
ahigh
contrast of the tail units against the head and water units.b)
Trans-mission electron
micrograph
obtained by Thomas et al. [12] of a cubic intermediate phase formedby
apolystyrene-polyisoprene
blockcopolymer.
Thephase
wasoriginally thought
to be a "double diamond"'phase,
whose appearance in thisprojection
is similar to that of thegyroid.
amphiphile
concentrations when the ratio of the head to the taillength
of the surfactant is increased from 4:7 to6:4,
in the clockwiseprogression
froma)
tod). Thus,
the range ofconcentrations over which the
hexagonal phase
forms is shifted from 0.45-0.55 forH4T7
to 0.55- 0.75 forH6T4.
Note that forH4T7
thehexagonal
window ofcompositions
is rather narrow,indicating
that thestability
of thisphase
is reduced forH4T7.
Thecomposition
range for thegyroid phase
for this surfactant is marked with dashed lines(Fig. 3a),
because itmight
be metastable. For one run on the 29 x 29 x 29 lattice the
gyroid phase formed,
but in arepeat
run at the samecomposition (CA
=0.57),
the lamellarphase
formed instead. Fora more
asymmetric surfactant, H4Tio,
both thegyroid
and thehexagonal phase disappear altogether,
as is discussed below. Note also that the BCCphase
appears forH6T4
in the concentration range0.375-0.50,
but does not occur at all for the otheramphiphiles. Finally,
at the
composition CA
" 0.50 for both
H4T7
andH4T6,
theexpected hexagonal phase
did notform on the 30 x 30 x 30
box, possibly
because of anincompatibility
with the box size.The
changes
inphase
behaviorproduced by
thelengthening
of the surfactant head group relative to the tail can be rationalizedby
interfacial curvaturearguments [22-25].
Because of itslonger
head group,H6T4 prefers
to reside on a curved surface with the head group on theconvex
side,
where there is more room[22].
This favors domains with curvedinterfaces,
suchas
spheres
andcylinders,
with tail groupspacked
on the inside(concave side)
of the curved surfaces.Therefore,
when the head group islarger, higher
concentrations of surfactant arerequired
to induce transitions to the domains with less curvature, such as transitions fromspheres
tocylinders
orcylinders
to lamellae. Since forH6T4
thespherical
domainspersist
atrelatively high
surfactantconcentrations,
these domains become crowdedenough
toundergo
an
ordering
transition to a cubic BCCphase.
ForH4T4, spherical
domainsbegin
toundergo
transitions to
elongated cigar
and worm-like domains atconcentrations
ofonly
around 0.35-0.40,
and tohexagonal cylinders
atCA
"
0.45,
and so thespherical geometry
does notpersist
atconcentrations
high enough
toproduce enough crowding
to induceordering
of thespheres [18j.
The same
argument,
withgreater force, applies
tospherical
micelles ofH4T6
andH4T7i
theseundergo
transitions tooblong
orcylindrical shapes
at even lower surfactant concentrations.For
H4T7,
the tail group is solong
that evencylinders
are somewhatdisfavored,
and the size of thehexagonal region
of thephase diagram
shrinks. With stilllonger
tail groups, as inH4Tio, only
lamellarphases
and inversephases
canform;
see below.Comparing
in Inore detail thephase diagraIns
from the simulations inFigures
3a-d to theexperiInental
ones inFigures 1a-d,
we findagreement
in thegeneral trends,
but soIne differ-ences in details.
Generally,
thecompositional
ranges for thehexagonal
and lamellarphases,
and the
shifting
of these ranges as one moves in the clockwiseprogression
froma)
tod)
in therespective figures,
have been matchedreasonably
well.Thus,
wemight
infer that in theexperimental diagrams,
the "effective" head-to-tail size ratioincreases,
or,equivalently,
the"packing parameter"
of Israelachvili et al. [22]decreases,
as one moves in theprogression
froma)
tod).
The
experimental diagram
for an anionicsurfactant, Figure 1b,
shows a tetrahedral meshphase
at acomposition
of aroundCA
" 0.75. Elsewhere[17]
it was shown thatH4T4
forms anordered mesh
phase
at thiscomposition
at a lowtemperature
in a box of size commensurate with thepreferred spacings
of thisphase;
seeFigure
3c. It would beinteresting
to look for meshphase
in simulations of the surfactantsH4T7
andH4T6
on suitableboxes;
this was not done here.C12
TAC has a cubicphase
in thecompositional
window0.45-0.55,
with abiphasic
cubic
/disordered
zone that extends down toCA
" 0.40. The structure of this cubic
phase
hasapparently
not been identified withcertainty, although
NMR diffusion studies indicate that it is apacking
ofspherical aggregates [26].
This window ofcomposition
agreesfairly closely
withthe BCC
compositional
range ofH6T4, namely
0.37-0.50.Experimental phase diagrams
for surfactants related to those inFigure 1,
but withlarger
or smaller head or tail groups,
support
the trends inferred from the simulations. Forexample,
for a surfactant similar toOleGroPcho,
but with aslightly
shorter 16-carbon tail group, thehexagonal phase only persists
down to concentrations as low as around 0.40-0.45weight
fraction [2].
Thus,
a decrease in the taillength
shifts thehexagonal compositional
window up tohigher
surfactantconcentrations,
asexpected.
An extensivestudy by
Mitchell et al. [27] ofethyleneglycol
ethersCzEOj
with Iranging
from 8 to 16 and j from 3 to 12gives qualitatively
theexpected
shifts in thehexagonal
and other orderedphases
withchanges
in thelengths
ofhead or tail groups. Not
surprisingly,
the cubic micellarphase only
occurs when the surfactant head group isrelatively large compared
to thehydrocarbon
tail group.Note in
Figure
1a that thephase envelopes
forC12E06
are somewhat"tilted;"
this tilt is notpresent
in thephase diagrams
of the othersurfactants,
nor in those of the simulatedsurfactants
H4T4
andH6T4.
The tilt islikely
due to thetemperature dependence
of thedegree
ofhydration
of the head groups of this nonionic surfactant. As thetemperature
israised,
thehydration
number of the head groupE06
decreases[27-29], making
iteffectively
lessbulky,
and one would thereforeexpect
a shift of eachcompositional
window toward lower surfactantconcentration,
as observed. Notice also that this surfactant has a '"re-entrant"isotropic phase;
athigh
concentrations ofsurfactant,
the lamellarphase disappears
and isreplaced, surprisingly, by
a disorderedphase.
This isthought
to be due tospecial
interactions betweenE06
groups[27].
It ispossible
that rather modest extensions of the lattice modelmight
allow these interactions to be
mimicked,
thuspermitting
thecomputation
of more accuratephase diagrams.
Figure
8 shows thephase diagrams
of surfactants with more extreme ratios of head-to-taillengths
than those ofFigure 3, namely
those ofHioT4, H4Tio, H16T4,
andH4T16,
and compares them to that ofH4T4.
InFigures 8b, d,
andf,
thediagrams
forH4T4, H4Tio,
andH4T16
areplotted against
water concentration(1- CA ),
andpresented
as continuations of thediagrams, respectively,
forH4T4, HioT4,
andH16T4.
Because of thesymmetries
of the model usedhere,
the
phase diagram
forHzTj
in water isequivalent
to one for the"complementary"
surfactantHjTz
in oil.Hence,
if oneinterprets
thediagrams
on theright
side ofFigure
8 as those of thecomplementary
surfactants inoil,
then as one moves from left toright
inFigures 8a-b, c-d,
ore-f,
the volume ratio oflyophilic
tohydrophilic species
increasescontinuously,
andFigures
8a-b, 11c-d,
and 11e-f can each be considered asingle
"extended"phase diagram. Figures
8a-b isqualitatively
similar to ahypothetical phase diagram proposed by
Seddon[30].
Note inFigure 8,
that as one increases theasymmetry
of thesurfactant,
there is arightward shifting
of each extended
diagram,
and a loss ofphases
onright
side of thediagram.
For the mostasymmetric
surfactant/complement, H16T4 /H4T16, only sphere packings
are formedby H16T4,
while forH4T16,
lamellarphases,
and inversehexagonal
and inversegyroid phases form,
but the "normal"hexagonal phase
ismissing.
Thus,
when the surfactant tail is verylong
relative to thehead,
the surfactant eschews normaltype
Ispherical
andcylindrical
micelles andprefers
inverse(or type II)
structures, such astype
IIhexagonal (and gyroid) phases,
in which the heads and water units are inside of thecylinders,
andonly
tiils are outside. Note also that for the surfactant with thelongest
tailgroup,
H4T16,
the size of theregion
ofGII Phase
isenlarged somewhat;
it spans acompositional
range of 0.055 + 0.015 in
width, compared
to a width ofonly
0.025 + 0.01 for moresymmetric
surfactants. Consistent with thesefindings, long-tailed monoglycerides [5, 31-33]
and two-tailedlipids
such asphosphatidyl
choline ordi-dodecyl alkyl-fl-D-glucopyranosyl-rac-glycerol
[6] havelarge regions
of inversehexagonal
and inversegyroid phases;
seeFigure
2.However,
the sizes of thegyroid
IIregions
in theexperimental phase diagrams
inFigure
2 are muchlarger
than those of the theoreticaldiagrams
inFigures 8d,
f. Theexperimental diagrams
also possessregions
of~~~~ ~~~~
io 9
La
~ H H
6 R
~
~
(C)
Hi
0T4 (d) H4T10B 12
(
L~I
lo H~
BCC8 Micelles
16
Hi~T4
HAT14
j
~~ j
Gu
Hn
lo
M~~es
0 0.2 0.4 0.6 0.8 0 0.2 0.4 0.6 0.8
Amphiphile
Concentration, Water Concentration,CA I CA
Fig.
8. Phasediagrams
of(a) H4T4, (c)
HioT4, and(e)
H16T4plotted
against surfactant con-centration
CA,
and those of the"complementary"
surfactants(b)
H4T4,(d)
H4Tio, and(f)
H4T16,plotted
against water concentration, 1- CA- Thesymbols
mean the same as inFigure
3. Because of the symmetry of themodel,
thediagrams
forH4T4,
H4Tio and H4T16 in water areequivalent
tothose of the
complementary
surfactants H4T4, HioT4, and H16T4 in oil. The closed circles arephase
biundaries determined on 30 x 30 x 30 lattices, while the open circles were determined on lattices of others sizes,namely
24 x 24 x 24 for thegyroid phase
and 34 x 34 x 34 for the rhombohedral-like meshphase
ofH4T4;
28 x 28 x 28 for the inversegyroid phase
of H4Tioi 33 x 33 x 33 for the BCCphase (CA
"
0.60)
of H16T41 and 34 x 34 x 34 for the inversegyroid
and lamellarphases (CA
"0.80)
of H4T16.
"double diamond"
DII Phase
that have notyet
been found in the simulations. The conditions under which the double-diamondphase might
appear instead of thegyroid phase
have beendiscussed
by Hyde [25].
Inaddition,
theexperimental diagrams (Fig. 2)
are dominatedby thermotropic
order-order transitions not evident in the simulations. Larsson [5] argues thatincreasing temperature
orincreasing
water content tends to increase thehydrocarbon
chain disorder in theselipids,
whichbrings
about the observedthermotropic phase
transitions.These,
and other causes for thethermotropic
character ofthephase transition,
and thegreatly enlarged regions
of bicontinuous cubicphase
in one- and two-tailedlipids,
are notcaptured by
the modelsurfactants considered here.
A
m
m m
mm m
L~
m K O
m m K
WIWWW mm m KK ~
WW) W W m ~ ~
iW
Li
(L~
*L~(
LiO W
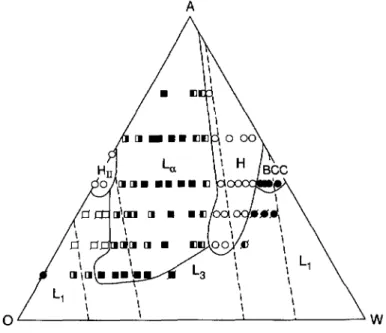
Fig.
9.Ternary phase diagram
for H4T4 in oil and water at w= 0.1538
(Nzw
=32).
"Li" isa disordered micellar
phase
with(#) representing spherical
micelles and (~K)oblong micelles;
"L3"#
is a disordered bicontinuousphase,
"H"(o)
a
hexagonal cylindrical phase,
"G"(A)
agyroid
cubic intermediate
phase,
and "L~" a lamellarphase,
with(.) representing
lamellae without holes, (Wrepresenting
lamellae with holes in the aqueouslayers,
and 16'lrepresenting
lamellae with holes in the oleiclayers.
The dashed lines represent, from left toright,
the fixedhydrophilic compositions,
CH" 0.20, 0.35, 0.65, and 0.80.
3.2.
LIQUID
CRYSTALLINE PHASES IN WATER AND OIL.Figure
9 shows the surfactant- oil-waterternary phase diagram
forH4T4
at w =0.1538,
whichcorresponds
to Nzw=
32;
the
symbols
are defined in thecaption.
Thisphase diagram
was obtainedby
a combination of simulations inpartially
open and in closed ensembles.Only
one half of thephase diagram
forH4T4
wassimulated;
the other half was obtainedby symmetry.
The box sizes used to obtainthese results are summarized in Table I.
In
Figure 9,
the lamellarphase occupies
the central part of thephase diagram,
flankedby regions
ofhezagonally packed cylinders.
Sandwiched between thecylindrical
and lamellar re-gions
are slender zonesoccupied by regular
and inverse thegyroid phases,
G andGII.
Since there aremultiple
chemicalcomponents,
there should bemulti-phase
coexistenceregions
be-tween the various
liquid crystalline phases
inFigure
9. But theseregions
cannot be determinedexcept
with simulations with verylarge boxes,
or with simulations withfully
openensembles,
in which the surfactant
concentration,
as well as the oil/water ratio,
can vary. We believe that the coexistenceregions
are small.The half-closed squares in
Figure
9 denote lamellae withholes,
orperforations.
Theseperfo-
rated lamellae occur at
asymmetric compositions
thatis,
lamellae whosecompositions
are near thephase
boundaries on either side of the lamellar zone. For lamellae on the water-rich side of thediagram,
the holes are in the lamellae that contain oil(and tails),
while on theoil-rich
side,
the holes are in the lamellae that contain waterland heads). Images
of theseperforated
lamellae have beenpresented
earlier[17].
Theperforations
allow the lamellae to accommodateunequal
amounts of oil and water withoutchanging
theirspacings much;
alarge
Table1. Lattice sizes in simulations
of ternary phase diagrams.
Surfactant Concentration Box Sizes
H4T4
0.80 20 x 20 x20,
40 x 40 x 40H7T4
0.75 30 x 30 x 30H4T4
0.70 30 x 30 x 30H4T4
0.60 30 x 30 x 30H7T4
0.60 30 x 30 x 30H4T4
0.50 30 x 30 x 30H7T4
0.45 30 x 30 x 30H4T4
0.40 30 x 30 x 30H7T4
0.35 35 x 35 x 35H4T4
0.30 40 x 40 x 40H7T4
0.25 40 x 40 x 40H4T4
0.20 40 x 40 x40,
35 x 35 x 35H7T4
0.15 45 x 45 x 45spacing change
would be disfavored because it would force the tail or head groups tochange significantly
theirconfigurations.
When lamellaecontaining
holes arecooled,
the holes can or-ganize
onto a lattice withhexagonal
ortetragonal
order[17,18].
ForH4T4, hexagonal ordering
occurs at w =
0.1614;
seeFigure
3. Since this value of w isgreater
than that at whichFigure
9was
determined,
lamellarphases
with ordered holes are notpresent
in thephase diagram
ofFigure
9.The dashed lines in
Figure
9correspond
to fixed concentrationsCII
ofhydrophilic
units(water
andheads).
The left-most dashed linecorres
![Fig. 2. Phase diagrams for (a) 1-monoolein in water (from Larsson [5]), and (b) di-dodecyl alkyl-p- alkyl-p-D-glucopyranosyl-rac-glycerol (from Turner et al](https://thumb-eu.123doks.com/thumbv2/1bibliocom/471849.75113/4.765.152.626.90.400/phase-diagrams-monoolein-larsson-dodecyl-glucopyranosyl-glycerol-turner.webp)