HAL Id: inria-00144496
https://hal.inria.fr/inria-00144496v1
Submitted on 4 May 2007 (v1), last revised 21 Jun 2007 (v3)
HAL
is a multi-disciplinary open access archive for the deposit and dissemination of sci- entific research documents, whether they are pub- lished or not. The documents may come from teaching and research institutions in France or abroad, or from public or private research centers.
L’archive ouverte pluridisciplinaire
HAL, estdestinée au dépôt et à la diffusion de documents scientifiques de niveau recherche, publiés ou non, émanant des établissements d’enseignement et de recherche français ou étrangers, des laboratoires publics ou privés.
NodeTrix: Hybrid Representation for Analyzing Social Networks
Nathalie Henry, Jean-Daniel Fekete, Michael Mcguffin
To cite this version:
Nathalie Henry, Jean-Daniel Fekete, Michael Mcguffin. NodeTrix: Hybrid Representation for Analyz-
ing Social Networks. [Research Report] 2007. �inria-00144496v1�
inria-00144496, version 1 - 4 May 2007
a p p o r t
d e r e c h e r c h e
399ISRNINRIA/RR--00144496--FR+ENG
Thème COG
NodeTrix: Hybrid Representation for Analyzing Social Networks
Nathalie Henry — Jean-Daniel Fekete — Michael J. McGuffin
N° 00144496
2007
Nathalie Henry
∗, Jean-Daniel Fekete , Michael J. McGuffin
†Th`eme COG — Syst`emes cognitifs Projet AVIZ
Rapport de recherche n° 00144496 — 2007 — 18 pages
Abstract: The need to visualize large social networks is growing as hardware capabilities make analyzing large networks feasible and many new data sets become available. Unfortunately, the visualizations in existing systems do not satisfactorily answer the basic dilemma of being readable both for the global structure of the network and also for detailed analysis of local communities.
To address this problem, we present NodeTrix, a hybrid representation for networks that combines the advantages of two traditional representations: node-link diagrams are used to show the global structure of a network, while arbitrary portions of the network can be shown as adjacency matrices to better support the analysis of communities. A key contribution is a set of interaction techniques.
These allow analysts to create a NodeTrix visualization by dragging selections from either a node- link or a matrix, flexibly manipulate the NodeTrix representation to explore the dataset, and create meaningful summary visualizations of their findings. Finally, we present a case study applying NodeTrix to the analysis of the InfoVis 2004 coauthorship dataset to illustrate the capabilities of NodeTrix as both an exploration tool and an effective means of communicating results.
Key-words: Graph visualization, Social networks, Matrix visualization, Hybrid visualization, Ag- gregation, Interaction.
∗INRIA/LRI Univ. Paris-Sud & Univ. Sydney
†Ontario Cancer Institute
NodeTrix: Reprsentation Hybride pour Analyser les Rseaux Sociaux
R´esum´e : Alors que les donnes issues des communications electroniques deviennent de plus en plus facilement accessible et comportent des informations toujours plus riches et nombreuses, le besoin de visualiser ces rseaux sociaux se fait plus pressant. Cependant, les systmes actuels ne permettent pas aux analystes de
Mots-cl´es : Visualisation de graph, Rseaux sociaux, visualisation matricielle, visualisation hybride, aggregation, interaction.
1 Introduction
Social network analysis is a growing area of the social sciences. Vast new datasets are becoming available as people conduct ever more of their social lives electronically. Online projects such as Wikipedia or open-source software development are creating new social networks on a global scale.
At the same time, the challenges of a more integrated world generate new demands for analysis such as monitoring terrorist networks or the spread of potentially pandemic diseases. Social network vi- sualization is becoming a popular topic in information visualization, generating more and more tools for the analysts. In 2006, 10 network-related articles have been presented at the InfoVis Symposium (30% or the articles) and 6 at the VAST symposium. The large majority of the network visualiza- tion systems use the node-link representation: 54 (out of 55) node-link based systems referenced in the Social Network Analysis Repository (http://www.insna.org/), and 49 (out of 52) on the Visual Complexity website(http://www.visualcomplexity.com/). This representation is well suited to show sparse networks, but social networks are known to be globally sparse and locally dense. Therefore, social network visualization faces a major challenge: obtaining a readable representation for both the overall sparse structure of a social network and its dense communities.
Figure 1: NodeTrix Representation of the largest component of the InfoVis Co-authorship Network In this article, we propose a novel visualization called NodeTrix to address this challenge. Node- Trix integrates the best of the two traditional graph representations by using node-link diagrams to visualize the overall structure of the network, within which adjacency matrices show communities.
The article is organized as follows: after the related work section, it describes the NodeTrix rep- resentation and the data structure it relies on. It then details the interaction techniques we designed for creating a NodeTrix hybrid, either by starting from a standard node-link diagram or from a stan- dard adjacency matrix. Finally, it describes a case study using NodeTrix to explore and present the results of a co-authorship social network.
2 Related Work
2.1 Social Network Analysis
Social networks are graphs, where the nodes are actors (people) and the edges are relationships.
They vary from very sparse (genealogical trees) to very dense (exports and imports between coun-
4 Henry et al.
tries). Small-world networks belong to an intermediate category that occur very frequently in social networks, including many acquaintanceship networks as well as the global Internet. They are the focus of many studies [22, 19] because of their interesting properties [30]. For social network visu- alization, the most relevant of these properties are a high clustering coefficient, corresponding to the presence of many locally dense clusters, and a small cross-section, caused by a small number of hub nodes connecting a graph that is globally sparse.
Social network analysis relies on three important tasks [28, 25]:
• identify communities, i.e. cohesive groups of actors that are strongly connected to each other;
• identify central actors, i.e. actors linked to many others or that bridge communities together;
• analyze roles and positions — these are higher level tasks relying on the interpretation of groups of actors (positions) and connection patterns (roles).
We now consider each of these three tasks in more detail, pointing out the corresponding graph- theoretic properties or graph analysis tasks using the taxonomy of tasks in [24].
To perform community analysis, an analyst should be able to group actors by attributes and to study the connection patterns within each group. The analysis of attributes such as actors’ names or interests is important to label the community in question and interpret why these actors are grouped.
Studying the connection patterns reveals how actors of the community are linked and the strength of their relationships. Analysts need to evaluate the density of a community in terms of connections and also to quickly identify cliques (a group where each actor is linked to every other actor) and miss- ing relationships. Thus, community analysis relies on attribute-based tasks, involving attributes of actors or relationships, and topology-based tasks, such as examining adjacency (direct connections) between nodes.
Identifying central actors is revealed by performing essentially topology-based tasks. Analysts need to identify the most connected actors, as well as articulation points (actors bridging communi- ties together). Such actors can be identified using measures of centrality, several of which are based on path-related tasks. For example, the betweeness centrality indicates the number of times a node is present in a shortest path between every pair of nodes in the network. Identifying central actors requires understanding the global structure of the network, i.e. finding communities, how they are linked and what actors link them.
Analyzing roles and positions is done by analyzing how actors are connected within a community and outside a community. This task requires more interpretation and relies also on attributes of actors and relationships.
Many systems exist to analyze social networks. We classify them into two categories: menu- based systems and exploration systems.
Menu-based systems provide a wide range of functionalities but users often needs expert help or a cookbook to analyze their datasets. Examples of these systems include Ucinet [7] — based on statistics and proposing a broad range of analysis functions — and Pajek [8] which provides a large set of algorithms to partition, permute, cluster, hierarchize and layout networks.
Mastering all the functionality of these menu-based systems to control the analysis process re- quires considerable effort from the user, hence recent systems are aimed at a more exploratory
INRIA
process. This process is based on starting with an overview of the whole network and then, us- ing interactions (MatrixExplorer [15]) or simple scripts (Guess [2]), to manipulate the dataset (e.g.
through filtering or clustering) and create a set of visuals for further analysis. A number of recent systems forgo the first step of this process because displaying a readable overview of a large graph is too difficult. PivotGraph [29] proposes to start the exploration from a top level aggregation of network attributes. The user visualizes categories and their relationships, and then interacts with the visualization to explore lower levels. NetLens [20] focuses on simple visualizations (histograms) of the network attributes and interaction to analyze the network. Semantic substrates [26] relies es- sentially on filtering and organizing actors according to their attributes. Finally, TreePlus [21] and Vizster [14] focus on a local representation of the network and use interaction to navigate within the whole dataset. These systems present interesting ideas and are very comfortable to use. However, identifying central actors and understanding the global structure of the network using these systems is difficult.
2.2 Graph Drawing
Graph drawing has a very rich history [9, 17], with early work on interactive computerized visual- izations extending back to the 1960s [4]. However, almost all visualizations of graphs amount to either node-link diagrams or adjacency matrix representations. There are a few examples of hybrid representations for graphs [13, 27] and for trees [32, 11] but they do not combine node-line diagrams with adjacency matrices.
Node-link diagram is the most familiar representation of graphs in general and social networks in particular. It is good at showing the overall structure of a sparse graph, but Ghoniem et al. [12]
showed that density has a strong impact on its readability. Focusing on basic readability tasks such as finding an actor or determining if two actors are linked, they conclude that node-link diagrams perform badly for dense graphs even with few (e.g. 20) nodes. Because node-link diagrams become unreadable in dense communities and around high-degree hub nodes, they do not lend themselves to community analysis.
(As an aside, in a community that is almost a clique and only missing a few edges, it might be suggested to use a “complementary” node-link diagram, where the links displayed indicate the missing edges; all the other edges being implicitly present. This would reduce clutter in some case, but in general is not a viable solution, because a community ofnnodes withinn2/4 =O(n2)edges is considered dense, but has an approximately equal number of direct and missing edges. Thus, clutter remains a significant problem even with such “complementary” node-link diagrams.)
The adjacency matrix representation, which is particularly effective for dense graphs, have been proposed to solve this problem [1, 15]. However, it is ill-suited to path-related tasks [12] that are very important in social network analysis. Analysts following paths between actors using a node- link network representation can exploit “Gestalt continuation” preattentive visual processing, but in a matrix representation the same task requires aligning and matching nodes back and forth between corresponding rows and columns, a tedious and error-prone high-level cognitive task. So, matrix representations ease community analysis, but hinder identification of global structure.
6 Henry et al.
Thus, at one extreme are sparse social networks, which have an almost tree structure and few communities, for which node-link diagrams are well suited. At the other end of the spectrum are very dense networks in which matrices are well suited. The problem boils down to deciding which visualization is more suitable for small-world networks that have an intermediate nature, being glob- ally sparse but locally dense. Choosing between these representations requires a trade-off between readability of global structure and ease of community analysis.
Henry and Fekete [15] chose to provide users with both representations synchronized by selec- tion. They argue that users can use the most appropriate visualization for each task. However, their system requires the use of two screens and the authors point out the potential cognitive load and divided attention from switching between representations.
Other recent work by Henry and Fekete [16] attempts to overcome the weaknesses of matrix rep- resentations by adding links on the sides of the traditional matrix. While the authors experimentally demonstrated that their visualization improves the traditional matrix, their results also show that the user fails to identify some important features (in particular, the articulation points) of networks.
Solutions have also been proposed to improve the readability of node-link diagrams for commu- nities. Auber et al. [3] introduce aggregated node-link diagrams where each community is aggre- gated in a single node within which a small overview is displayed. While communities are quickly identifiable and the global structure more readable, detailed analysis of communities is impossible because links between communities are missing.
Holten proposed the Hierarchical Edge Bundles technique [18] to improve the readability of hier- archical graphs; it can also be applied to clustered graphs. Although it can improve the readability of the global structure and inter-community relationships, it is still difficult to identify intra-community organization as nodes inside clusters are positioned along a circle, creating many edge crossings.
3 NodeTrix
NodeTrix is a hybrid representation of networks based on the node-link diagram where communities can be represented as matrices. Intra-community relationships use the adjacency matrix representa- tion while inter-community relationships use normal links.
3.1 Data Structure and Design Choices
Two graphs are involved in a NodeTrix representation: the raw underlying graph (composed of underlying nodes and edges) that serves as initial input, and an aggregated graph (composed of aggregated nodes and edges) that is derived from the underlying graph. Each aggregate node may correspond to either a unique underlying node or to a group of underlying nodes that typically form a community. Underlying nodes are never shared by aggregate nodes, i.e. there is a many-to-one mapping from underlying nodes to aggregate nodes (and also from underlying edges to aggregate edges.)
Because our goal with NodeTrix is to provide a readable representation for dense subgraphs, only a single level of aggregation is used: dense subgraphs are simply aggregated and displayed as matrices. Some aggregated nodes may correspond to only one underlying node rather than a
INRIA
group of underlying nodes and these are displayed as a simple node rather than a matrix. However, operations are designed to be uniform over all aggregated nodes. In particular, the user can add or merge aggregated nodes, whether each node involved corresponds to just one or many underlying nodes.
Attributes of the underlying nodes and underlying edges are combined and propagated up to the aggregated elements. For nominal and categorical attributes, values are combined through simple concatenation. Numerical attributes are aggregated either using the average or the min,max values.
An interesting benefit of using matrices in NodeTrix is that it can display the attributes of the underly- ing elements and of the aggregated elements and that for both the links and the nodes. Furthermore, because users can dynamically switch between the two representations, more visual variables are available to show attributes. For example, the background color of a matrix can correspond to an aggregated node attribute, while attributes of each underlying node can be shown along the axes of the matrix. Similarly, the axes can be used to display labels of individual underlying nodes, while a global aggregated node label is also shown.
3.2 NodeTrix Visualization
To render the NodeTrix representation, a standard node-link layout is used for the aggregated graph, and in addition aggregated nodes containing more than a single underlying node are overlayed with a matrix representation.
3.2.1 Drawing Matrices
NodeTrix is built on the InfoVis Toolkit [10] and uses its rendering mechanism to create the vi- sualization. The rendering mechanism involves a pipeline of renderers which makes it simple to draw a matrix over a standard node. For example, a simple rendering pipeline for a node-link dia- gram would be : compute position, compute size, set color, fill shape, draw border, draw label. To overlay matrices on standard nodes, we introduced a matrix renderer between the fill shape and the draw border renderers. This renderer displays the matrix after having rendered the background node (with a given position, size and color) and before drawing the border used for selection and the label.
Matrices have two advantages which make them more readable than node-link diagrams to rep- resent an aggregated node: first, as nodes are organized linearly, edges from the rest of the graph to the underlying nodes are readable and suffer from a limited number of crossings; secondly, as nodes are represented both in rows and columns, edges can be drawn from any of the four sides of the matrix, which also limits crossings and overlapping problems. Finally, rows and columns of matrices can be reordered (manually or automatically) to improve readability and further reduce the number of edge crossings.
To save memory and allow the user to control all the matrices’ properties with a single general control panel, the matrix renderer uses a single matrix visualization object, applying a different per- mutation for each aggregated node. Therefore, changing the color attribute for the matrix axes will affect all displayed matrices. We considered creating a separate matrix object for each aggregated node instead, allowing the user to display different attributes on different matrices. However, it would have been very confusing for the user to manage all the controls in a single huge panel (one
8 Henry et al.
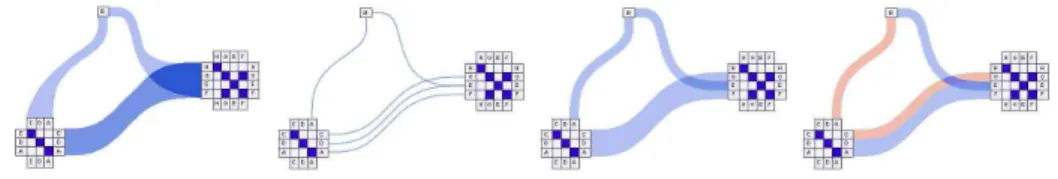
Figure 2: Drawing links (from left to right): (a)aggregated edges, (b)underlying edges, (c)underlying edges with full size, (d)underlying edges carrying attributes
set of controls for each matrix) or to force the user to select a matrix to see its controls. We decided that sharing the visual attributes for all the matrices was the best compromise.
3.2.2 Drawing Links
To display links in NodeTrix, we considered three options: displaying only aggregated links, dis- playing only the underlying links, or displaying both.
Displaying aggregated links (Figure ??) provides simple visual feedback on how communities interact. Moreover, an aggregated attribute can be mapped to a visual variable (e.g. color, thickness, opacity) of this edge. However, the details of which actors of the two communities are interacting are not visible. On the other hand, displaying each underlying edge (Figure 3.2.2b) provides connectivity details and enables visualization of the attributes of each edge independently, but at the cost of many more links and potential crossings. Because small-world networks are globally sparse, they are few inter-community relationships. However, displaying both aggregated and underlying edges at a same time could nevertheless be confusing, in part due to the possible interaction between visual variables and edge crossings or overlap.
For NodeTrix, we chose to visualize underlying edges, but with the added flexibility of allowing the user to control the thickness of links through a slider. Increasing the size of underlying links eventually causes them to merge, and the resulting visual feedback (Figure 3.2.2c) is similar to that with aggregated edges (Figure 3.2.2a), but with more precision. Moreover, when visualizing an underlying edge attribute as a color, the thickness of merged bands of color conveys the number of underlying edges (3.2.2d). The slider that controls links size updates the visualization with smooth, immediate feedback, similar in spirit to direct manipulation. Manipulating this slider allows the user to quickly switch from one kind of overview mode — how are communities linked? Which kinds of links? — to a detailed mode — who are linking the communities together?
3.2.3 Layout
Because the aggregated graph in NodeTrix is laid out as a traditional node-link diagram, any exist- ing graph layout could be used. However, because NodeTrix is intended to be used as an interactive exploration tool and we do not want to confuse the user with large, sudden changes to the layout, it seems appropriate to support incremental, interactively-driven changes to the layout, such as ag- gregating or splitting nodes. The initial layout given to the graph is the LinLog layout proposed
INRIA
by Noack [23]. It was chosen to give prominence to clusters so they can be quickly identified by the user. After this initial layout, the user may then make local changes such as dragging nodes to change their positions, grouping a set of nodes, or removing a node from a group.
To (re)order the nodes within an adjacency matrix, many different algorithms can be used. As these matrices are typically small, the running time is not an issue. Nevertheless, we chose not to reorder the matrices automatically as they are usually very dense and do not need any particular optimization. Instead, we preferred to allow the user to interactively move rows and columns.
3.3 Visual Variables and Control Panel
NodeTrix relies on the InfoVis Toolkit to generate controls to filter and affect visual variables. The user controls two sets of visual variables: one for the node-link diagram, and one for the matrices displayed in the aggregated nodes. Each set of variables contains the following, for nodes and edges:
color, transparency, shape size, filled area of the shape, border color, width, and labels.
The user filters and associates visual variables to aggregated and underlying graph attributes using simple controls such as combo boxes or sliders. The visualization is immediately updated, following the principles of direct manipulation.
4 Interaction
We designed a set of interaction techniques to create, edit and manipulate NodeTrix in a very simple and powerful way because we believe that manipulation is key to understanding a network and its potential multiple interpretations.
4.1 NodeTrix Editing
NodeTrix can be created starting with a pure, traditional node-link diagram. We propose a set of interactions based on drag-and-drop of nodes, matrix axis items, and matrix core elements. We feel these interactions are easy to understand as the user simply grabs one of these elements and drops it to another location (possibly over existing elements) to perform an action. When dragging an element, the user has immediate visual feedback and is able to read the element’s label.
Moving a node or a matrix to adjust its position and improve the readability of the representation can be done by grabbing the matrix or the node, dragging it and releasing it at a new position. As the element is dragged, its connecting links are updated.
To aggregate a group of nodes into a matrix, the user may lasso-select the desired nodes, which are then immediately converted into a matrix. To make the transition to a matrix smooth, the trans- formation from node-link diagram to matrix is animated. The animation speed is adjustable to suit both novice users (who may benefit from seeing a slow animation, to better understand how nodes and edges become organized into a matrix) and advanced users (who would presumably prefer a brief animation). Splitting a matrix back into a group of nodes is done by right-clicking on it, in which case nodes are positioned with a circular layout around the center of the previous matrix.
10 Henry et al.
To complete these basic aggregation features, we provide additional interactions for finer-grain editing of the aggregated elements. If users missed an element with the lasso selection or simply wants to add an additional node to a matrix, they can drag-and-drop a single node into the matrix.
The node will integrate with the matrix, appearing in the matrix axis items (in both the rows and columns). Its connections with the matrix elements will be displayed in the matrix core, whereas its connections with the external elements will be displayed as links starting from the matrix axis items and ending at the external elements. If a single node is dragged onto another single node, then the two will be aggregated into a2×2matrix. On the other hand, if users wish to extract a node from a matrix, they can grab the corresponding matrix axis item (either on the row or column axis) and drop it outside the matrix. The dropped item will then be displayed as a standard node with appropriate links between itself and the matrix, and the corresponding row and column in the matrix will be removed.
To increase readability or visualize different combinations, users may want to move an item from one matrix to another. This can done by grabbing a matrix axis item and dropping it on the other matrix. During the transfer, the user is able to read the node label and may cancel the interaction by dropping the element back into the original matrix. This may result in a change to the ordering of nodes in the matrix. The order of items in the matrix normally corresponds to the item addition order, with the last item added in the last position. However, when two matrices are merged, the item ordering follows the indices of nodes in the underlying graph. The ordering of nodes can be changed by grabbing nodes and dropping them back into the matrix, one at a time, in the desired order.
Finally, users can merge matrices together by dragging-and-dropping a matrix over another.
4.2 Geometric Zoom on Matrices and Axis Labels
An aggregated matrix may occupy more space than the original group of nodes in node-link repre- sentation. This is partly due to the labels displayed on each side of the resulting matrix. However, while reading labels on each side of the matrix is required to perform community analysis and local editing operations, the axis labels are not required on all matrices at all times, and the size of the ma- trix core can be reduced to fit the minimum level of readability. Moreover, as each matrix possesses a label (reflecting its composition), axis labels for individual underlying nodes may not be necessary at all in a final layout.
We tried displaying the axis labels on demand following the excentric label principles. For example, if the mouse pointers hovers over a matrix, its axis labels as well as its neighbors’ axis labels are displayed. In this case, axis labels need to remain visible after the mouse pointer moves (to avoid frustrating the user when loosing a landmark or pointing at an item to grab). However, during a case study, we observed that it was more comfortable to be able to read all axis labels when editing, and to remove all axis labels at once and reduce the size of the matrices to get an overview of a final layout.
For these reasons, we added two sliders in the control panel to control the size of the matrices and the axis labels.
INRIA
4.3 Supporting the Exploration of Matrices
One strong weakness of the matrix representation, when exploring a network, is the tedious work required to perform path-related tasks. For example, finding how two communities are connected is tedious as it requires going back and forth alternately reading rows and columns. Moreover, if communities are far apart in the matrix, this task requires a scan of the full length of matrix rows or columns, and connections in a large matrix may lie outside the viewport. Obviously, the task is worse when dealing with three matrices as the user needs to check for intersections of rows and columns in each of the three communities.
We noticed in a participatory-design session reported in [15] that social network analysts also use the matrix representation for some of their analyzes. To help perform community analysis and provide support for path-related tasks in general, we provide users with a couple of interaction techniques that work across separate matrix-NodeTrix windows, that might be arranged in a dual- viewport or split-screen fashion. These techniques are still based on drag-and-drop, however this time, the user drags a group of elements from one window to another one.
The interaction is made of two steps: first, the user selects a group of nodes in the window of the pure matrix visualization and then drags this group to the NodeTrix window. To select the group of nodes, we provide lasso selection directly on the pure matrix representation. Alternatively, the selection can be done on an axis (rows and columns). When a group of edges (matrix cells) is selected, the corresponding set of nodes transferred is the union of the edges’ source nodes and sink nodes. Dropping the selected group inside the NodeTrix window performs the addition of an aggregated node to the NodeTrix visualization. The group is then displayed as a matrix. Selecting and dropping a second group allows the user to see how these groups are connected to each other visualizing the result with links. The process can continue to visualize connections between several communities.
5 Animation
Proper use of animation has much potential to increase the effectiveness of user interfaces and visu- alizations [31, 5, 6]. To help users maintain their mental model of the network across interactions, we considered how to continuously animate the aggregation of nodes into an adjacency matrix. Typ- ically, animating over transitions involves some kind of interpolation of graphical elements from one state to another. In the case of transitioning from a node-link diagram to a matrix, however, the visual design of the animation is non-trivial, because node-link diagrams and adjacency matri- ces are composed of very different graphical elements. There is a sort of duality between the two forms: nodes correspond to points in node-link diagrams, but to line segments (rows and columns) in matrices, and, conversely, edges correspond to line segments in node-link diagrams, but to points (intersections of rows and columns) in matrices. The key problem is to find an intermediate graphical form or layout through which we can interpolate during an animation.
To find solutions, we conducted sessions of sketching, brainstorming, and analysis of how graphs can be depicted with node-link diagrams and matrices. We noticed that, although each node corre- sponds strictly to an entire row and column within a matrix, the node can also be identified with
12 Henry et al.
special points in the matrix, that occur where the diagonal and the axes (or sides) of the matrix inter- sect the node’s row and/or column. Furthermore, it is possible to draw a node-link diagram overlaid on a matrix grid, in such a way that the nodes fall on some of these special points, and such that the edges (drawn as polylines or curves) pass through their own corresponding locations in the matrix.
Figure 3, subfigures 3–7, show some possibilities.
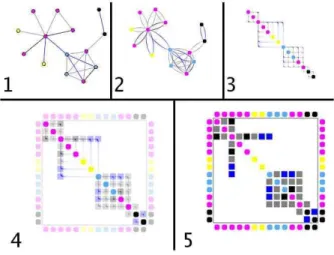
Figure 3: 1: A node-link diagram of a network. 2: The corresponding adjacency matrix. For simplicity, only the upper half is shown, since the matrix is symmetric. 3 through 5: different ways of depicting the edges in a node-link diagram laid out over the matrix, using polylines or curves. The
“corners” of the edges coincide with the filled-in cells of the matrix in 2. 3 and 4: inspired by circuit wiring diagrams. 5 through 7: different choices for the locations of nodes in the node-link diagram laid out over the matrix. 6 and 7: each node is duplicated and has two locations in the node-link diagram.
As can be seen, there are several possibilities for the intermediate state that an animation might interpolate through. We identify a few different design dimensions. First, the edges in the intermedi- ate state might be depicted using polylines or curves (Figure 3, subfigures 3–5). Second, the location of nodes might be along the diagonal or along the sides of the matrix (subfigures 5–7); in the latter case, each node must be duplicated at some point during the animation. Third, the intermediate state might show only the upper half of the matrix (after which the animation might fade in or unfold the other half of the matrix as a mirror image), or the intermediate state might show the whole matrix (before which the animation would have to duplicate the edges somehow, since they occur in each half of the matrix).
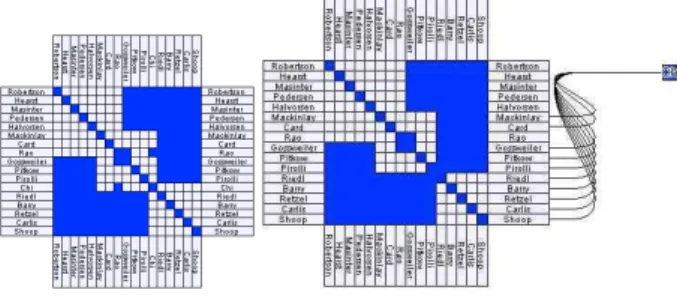
We made a first set of choices along each of these design dimensions and implemented an ani- mated transition from node-link diagrams to adjacency matrices, both in the NodeTrix software and in an additional piece of software. Figure 4 shows the latter implementation, where the network has colored nodes and edges. As can be seen, the intermediate state (subfigure 3) shows both halves of the matrix, hence the animation begins by duplicating edges (subfigure 2). The positions of the nodes, and of the control points for the edge curves, are gradually interpolated to reach their final locations (subfigure 3). Then, the edge curves are faded out as the normal depiction of the matrix is faded in (subfigure 4). Notice that the “corners” of the edge curves coincide with the appropriate cells of the matrix (subfigure 4), and the opacity of the curves is varied such that these corners are
INRIA
the last part of the curve to fade away, to reinforce their visual correspondence to the matrix cells that fade in.
Figure 4: The stages of an animation from a node-link diagram (1) to an adjacency matrix (5).
Compared with other animated transitions in visualization systems, this animation may seem rather complicated, and in practice an expert user may prefer that the animation be brief (e.g. lasting 0.5 seconds). However, novice users may appreciate having these animations last longer, at least initially. We expect that, in addition to helping the user maintain a mental model of the visualization across transitions, these animations may also have an educational benefit, to help users learn how adjacency matrices are constructed and how to interpret them. We expect it would be worthwhile to implement variations on the animation corresponding to the other design choices we identified, and to solicit feedback from users as to their preferences.
A fourth design dimension relevant for education involves deciding whether to animate all the nodes and edges at the same time, or to animate them in sequence. For example, edges might be animated one at a time, constructing the matrix cell-by-cell, or alternatively, each node (with all its edges) might be animated one at a time, constructing the matrix row-by-row. Such a sequential animation might be made to accelerate as more of the matrix is built-up, allowing the user to see the process in detail at first, and then to see it quickly complete the rest of the matrix.
6 Case Study: Exploring and Presenting Publications Data
In this case study, we present how NodeTrix can be used both for exploring and presenting publi- cations data. The InfoVis 2004 contest provided us with a clean dataset from which we extracted the co-authorship network of the Information Visualization field. This network is disconnected in 291 components and contains 1104 nodes (researchers) and 1787 edges (co-authorship). It has a low density and a high clustering coefficient, which categorizes this network as a small-world network.
14 Henry et al.
We only present here the analysis of the largest connected component, containing 137 nodes and 328 edges. This network can be considered as small sized but it already presents challenges for exploration and presentation using traditional matrix and node-link diagrams. Detailed commu- nities are not readable in node-links while connections between communities are tedious to find in matrices.
Moreover, presenting results on paper requires some filtering for matrices as well as node-link diagrams. The matrix representation requires space: it cannot fit in a printed article with readable la- bels for networks of more than a hundred nodes. Edge-crossings and node-overlapping is an issue for node-link diagrams. Filtering reduces the size and density of the network to make it more readable.
Using NodeTrix solves these presentation problems since dense subgraph are aggregated as matri- ces whereas edge-crossing and node-overlapping is limited. Furthermore, communities (aggregated nodes) remain readable.
6.1 Setup
To manipulate NodeTrix, we used an interactive pen display. Pen-based interactions on NodeTrix are intuitive and comfortable using this input device. The user can simply grab elements by pressing the pen over them, drag them moving the pen on the screen and finally release them by raising the pen. Lasso selection provides also a very intuitive feedback similar to the use of a real pen.
6.2 Aggregation and Exploration
NodeTrix is a flexible representation for which the level of aggregation as well as the level of details is controllable. For example, Figure ?? and Figure 1 show the exact same dataset: the largest com- ponent of the InfoVis co-authorship network. In the compact representation (Figure 1), the goal was to provide a brief overview of main communities in the field, whereas in the second representation, the goal was to be able to identify all nodes of the network while grouping them by communities.
A third representation could have been a more detailed representation with the axes of the matrices displayed.
While exploring the network, the interactions provided with NodeTrix ease the analysis. For example, moving an actor in and out of a community (matrix) helps understand his influence on this community. Figure 6.2 illustrates this operation, showing that if Ed Chi is extracted from the PARC community, then the community is disconnected. This operation also helps understand the matrix representation for novice users, as they can drag out of the matrix each actor, one at a time, visualizing his relations to the others and comparing it with its matrix representation.
6.3 Patterns of Collaboration
The main result of our case study is the identification of different collaboration patterns: cross patterns and block patterns.
Figure ?? reveals the collaboration pattern of Ben Shneiderman, main actor of the InfoVis field.
This aggregated matrix is very sparse and shows only a complete first row and first column. We named this pattern a cross pattern because if Ben is placed somewhere else in the matrix (as it is often
INRIA
Figure 5: Moving a node in and out of a matrix. The PARC community is shown on the left, the influcence of Ed Chi outlined on the right figure.
the case when the matrix is not reordered), the visible pattern is a large cross. This pattern reveals that Ben collaborates with all researchers in this matrix. However, the low density shows that Ben’s collaborators generally do not work together: they are probably students he is supervising. Figure 1 reveals several matrices with this pattern of collaboration: Plaisant et al., Bederson et al. and, Eick et al.
Figure ?? reveals the collaboration pattern of researchers from Berkeley. The aggregated matrix is almost a clique, it is a very dense community. Contrary to the previous pattern, this one reveals that researchers strongly collaborate with each other and not only a single one. Figure 1 shows that Parc has the same collaboration pattern.
Note that the community formed by Stephen Roth is to be placed in an intermediate category (Figure ??). Stephen is central in this community, but several blocks are visible, meaning that researchers also collaborate with each other.
Figure 6: Three collaboration patterns (from left to right): (a)Cross-Pattern: Shneiderman and his collaborators, (b) Block-Pattern: Researchers at Berkeley, (c) Mixed-Pattern: Roth and his collabo- rators
7 Conclusion and Future Work
We have introduced a novel visualization called NodeTrix. This representation integrates the best of two traditional network representations: node-link diagrams and adjacency matrix-based represen- tations. The strength of this representation for analyzing social networks is that it is combining the
16 Henry et al.
familiarity of node-link diagrams to understand the global structure of the network and the readabil- ity of matrices for detailed community analysis.
We described a set of interactions support the manipulation of NodeTrix and help analyzing networks. We also proposed an animation to smooth the transition between node-link diagrams and matrices. In a slower mode, this animation can be used to help novice users understand how matrices work. Finally, we have illustrated the effectiveness of NodeTrix with a case study of the InfoVis publications data.
We plan to extend our system in several directions and to perform evaluations on its use with real analysts. The interactive capabilities of NodeTrix are well suited to collaborative analyzes so an obvious extension include collaborative edition, either through the network or in a shared environment with large displays.
We have iterated on several alternative representations to visualize social networks and believe that NodeTrix is among the most effective and simplest to understand. We plan to release it soon as a component of the InfoVis Toolkit (ivtk.sourceforge.net).
References
[1] J. Abello and F. van Ham. Matrix zoom: A visual interface to semi-external graphs. In Proceed- ings of the 2004 IEEE Symposium on Information Visualization (INFOVIS’04), pages 183–190, Austin, Texas, 2004. IEEE Computer Society.
[2] E. Adar. Guess: a language and interface for graph exploration. In CHI ’06: Proceedings of the SIGCHI conference on Human Factors in computing systems, pages 791–800, New York, NY, USA, 2006. ACM Press.
[3] D. Auber, Y. Chiricota, F. Jourdan, and G. Melanc¸on. Multiscale visualization of small world networks. In Proceedings of the 2003 IEEE Symposium on Information Visualization, pages 75–81. IEEE Press, 2003.
[4] R. M. Baecker. Planar representations of complex graphs. Technical Report 1967-1, Lincoln Laboratory MIT, February 1967.
[5] R. M. Baecker and I. Small. Animation at the interface, 1990. A chapter (pp. 251–267) in Brenda Laurel, editor, The Art of Human-Computer Interface Design, Addison-Wesley.
[6] L. Bartram. Can motion increase user interface bandwidth? pages 1686–1692, 1997.
[7] S. Borgatti, M. Everett, and L. Freeman. UCINET V user’s guide. Analytic Technologies, Natick, MA, 1999.
[8] W. de Nooy, A. Mrvar, and V. Batagelj. Exploratory Social Network Analysis with Pajek.
Structural Analysis in the Social Sciences. Cambridge University Press, 2005.
[9] G. Di Battista, P. Eades, R. Tamassia, and I. G. Tollis. Graph Drawing: Algorithms for the Visualization of Graphs. Prentice-Hall, 1999.
INRIA
[10] J.-D. Fekete. The InfoVis Toolkit. In Proceedings of the 2004 IEEE Symposium on Information Visualization (INFOVIS’04), pages 167–174. IEEE Computer Society, 2004.
[11] J.-D. Fekete, D. Wang, N. Dang, and C. Plaisant. Overlaying graph links on treemaps.
IEEE Symposium on Information Visualization Conference Compendium (demonstration), Oct. 2003.
[12] M. Ghoniem, J.-D. Fekete, and P. Castagliola. On the readability of graphs using node-link and matrix-based representations: a controlled experiment and statistical analysis. Information Visualization, 4(2):114–135, 2005.
[13] D. Harel. On visual formalisms. Communications of the ACM (CACM), 31(5):514–530, May 1988.
[14] J. Heer and D. Boyd. Vizster: Visualizing Online Social Networks. In Proceedings of the 2005 IEEE Symposium on Information Visualization, page 5. IEEE Computer Society, 2005.
[15] N. Henry and J.-D. Fekete. MatrixExplorer: a Dual-Representation System to Explore Social Networks. IEEE Transactions on Visualization and Computer Graphics, 12(5):677–684, 2006.
[16] N. Henry and J.-D. Fekete. Matlink: Enhanced matrix visualization for analyzing social net- works. Proceedings of the International Conference Interact (to be published), 2007.
[17] I. Herman, G. Melanc¸on, and M. S. Marshall. Graph visualization and navigation in infor- mation visualization: A survey. IEEE Transactions on Visualization and Computer Graphics, 6(1):24–43, 2000.
[18] D. Holten. Hierarchical edge bundles: Visualizaiton of adjacency relations in hierarchical data.
IEEE Transactions on Visualization and Computer Graphics, 12(5):741–748, 2006.
[19] D. B. Horn, T. A. Finholt, J. P. Birnholtz, D. Motwani, and S. Jayaraman. Six degrees of Jonathan Grudin: a social network analysis of the evolution and impact of CSCW research.
In CSCW ’04: Proceedings of the 2004 ACM conference on Computer supported cooperative work, pages 582–591, New York, NY, USA, 2004. ACM Press.
[20] H. Kang, C. Plaisant, B. Lee, and B. B. Bederson. Netlens: Iterative exploration of content- actor network data. Proceeding of IEEE Symposium on Visual Analytics Science and Technol- ogy (VAST), pages 91–98, 2006.
[21] B. Lee, C. S. Parr, C. Plaisant, B. B. Bederson, V. D. Veksler, W. D. Gray, and C. Kotfila.
Treeplus: Interactive exploration of networks with enhanced tree layouts. IEEE Transactions on Visualization and Computer Graphics, 12(6):1414–1426, 2006.
[22] M. Newman. The structure and function of complex networks. SIAM Review, 45:167–256, 2003.
18 Henry et al.
[23] A. Noack. Energy-based clustering of graphs with nonuniform degrees. In P. Healy and N. S.
Nikolov, editors, Proceedings of the 13th International Symposium on Graph Drawing (GD 2005), pages 309–320, Limerick, Ireland, 2005. Springer-Verlag.
[24] C. Plaisant, B. Lee, C. S. Parr, J.-D. Fekete, and N. Henry. Task taxonomy for graph visual- ization. In BEyond time and errors: novel evaLuation methods for Information Visualization (BELIV’06), pages 82–86, Venice, Italy, 2006. ACM Press.
[25] J. P. Scott. Social Network Analysis: A Handbook. Sage Publications Ltd, Mar. 2000.
[26] B. Shneiderman and A. Aris. Network visualization by semantic substrates. IEEE Transactions on Visualization and Computer Graphics, 12(5), 2006.
[27] G. Sindre, B. Gulla, and H. G. Jokstad. Onion graphs: Aesthetics and layout. In Proceedings of IEEE Symposium on Visual Languages (VL), pages 287–291, 1993.
[28] S. Wasserman and K. Faust. Social Network Analysis. Cambridge University Press, 1994.
[29] M. Wattenberg. Visual exploration of multivariate graphs. In Proceedings of the SIGCHI conference on Human Factors in computing systems, pages 811–819, Montral, Qubec, Canada, 2006. ACM Press.
[30] D. J. Watts and S. H. Strogatz. Collective dynamics of ’small-world’ networks. Nature, 393:440 – 442, 1998.
[31] D. D. Woods. Visual momentum: a concept to improve the cognitive coupling of person and computer. International Journal of Man-Machine Studies, 21:229–244, 1984.
[32] S. Zhao, M. J. McGuffin, and M. H. Chignell. Elastic hierarchies: Combining treemaps and node-link diagrams. In Proceedings of IEEE Symposium on Information Visualization (Info- Vis), pages 57–64, October 2005.
INRIA
4, rue Jacques Monod - 91893 ORSAY Cedex (France)
Unité de recherche INRIA Lorraine : LORIA, Technopôle de Nancy-Brabois - Campus scientifique 615, rue du Jardin Botanique - BP 101 - 54602 Villers-lès-Nancy Cedex (France)
Unité de recherche INRIA Rennes : IRISA, Campus universitaire de Beaulieu - 35042 Rennes Cedex (France) Unité de recherche INRIA Rhône-Alpes : 655, avenue de l’Europe - 38334 Montbonnot Saint-Ismier (France) Unité de recherche INRIA Rocquencourt : Domaine de Voluceau - Rocquencourt - BP 105 - 78153 Le Chesnay Cedex (France)
Unité de recherche INRIA Sophia Antipolis : 2004, route des Lucioles - BP 93 - 06902 Sophia Antipolis Cedex (France)