This measurement makes it possible to estimate the strength of the reed indicated on the box for the clarinet or saxophonist. It concerns the mechanical or optical characterization of the reed and enables the estimation of reed intrinsic parameters. The reed response is estimated by measuring the displacement of the reed tip and the acoustic pressure inside the mouthpiece.
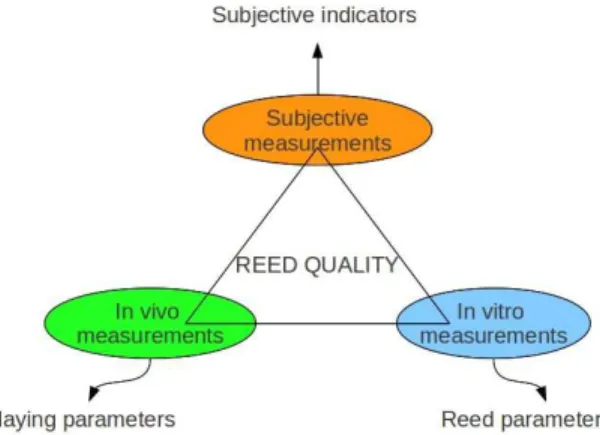
In vitro” indicators are estimated by analyzing the frequency response of the reed (resonance parameters). The purpose of this section is to present the method for the subjective characterization of the reed. The purpose of this experiment is to provide measurements of the reeds under playing conditions.
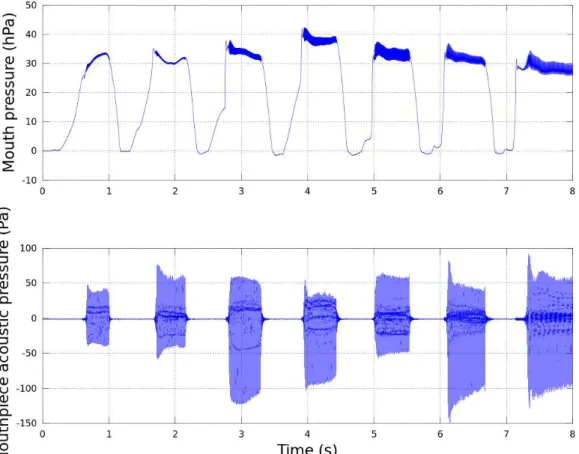
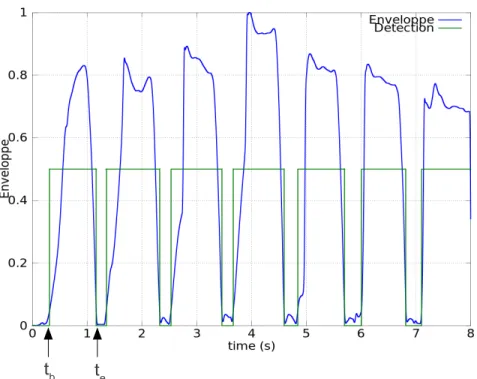
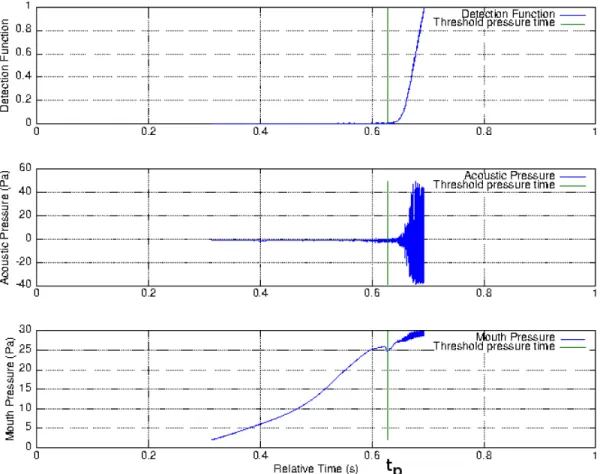
2 in the musician's mouth and the radiated acoustic pressure at the saxophone bell Par. For each note, the stationary part of the signal is estimated by calculating the energy of the signal 146 6436. Once the stationary part of the signal is detected, the following parameters are estimated.
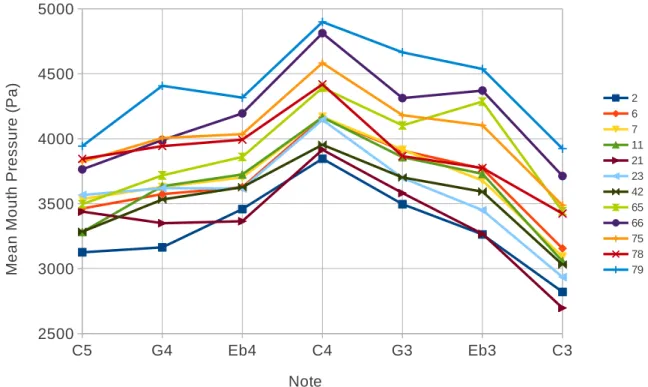
The mean oral pressure is estimated as the mean value of the pressure measured in the mouth during the stationary part of the signal.
2 #DBB8$5BC556B
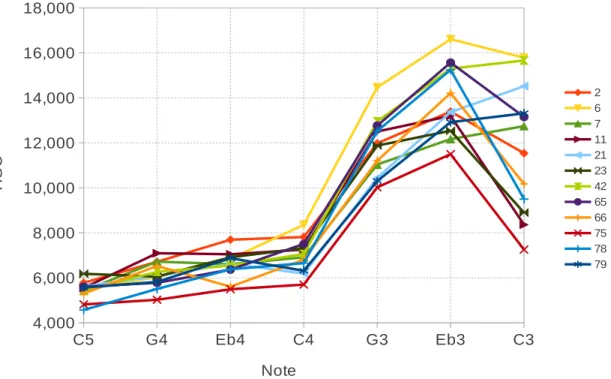
This result shows that the lowest note of the phrase C3 should not be taken into account during the analysis, due to the great uncertainty this note creates about indicators. This behavior tells us to use the average value of the parameter along the different notes to characterize the reeds. We present the principle of the bench (experimental system) and the method used to estimate the reed parameters.
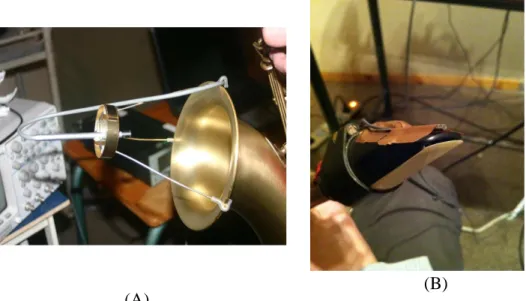
Then the repeatability of the measurement is presented for different configurations (with or without artificial lip, short-term and long-term measurements). For all experiments, the response of the reed is characterized by measuring the displacement of the frequency response function over the acoustic pressure at the center of the reed (in the transverse direction) and 2 mm from the tip. The displacement sensor was always placed two millimeters below the tip of the reed and at exactly the same distance from the reed each time.
It was attached to a thin horizontal bar that was supposed to model the effect of the musician's teeth. During the measurements with the artificial lip, the lip was always placed at the same vertical distance from the reed tip. Examples of tongue responses are shown in Figure 12 and Figure 13 without use of the artificial lip.
Display of the measured data (+) and the estimated data (-) using the least mean square method. It does not allow to easily perform a modal analysis of the reed, such as the system presented for example in [ 4 ] and [ 6 A total of nine measurements were taken for each reed without use of the artificial lip (five measurements on the first day, three measurements three days later, and another measurement three days later).
In Figure 17 and Figure 18, results of the measurements with the use of the artificial lip are presented. The lip is always placed at the same vertical distance from the tip of the reed. It is clear that compared to the measurements without the use of the artificial lip, short-term repeatability of the measurements with the use of the lip is worse (standard deviations are larger).
For comparison, the average values of the first set of five measurements (measured on the first day) were used. It is not clear whether it is the amount of water in the reed or some other factor, but it is clear that the dynamic parameters of the first resonance change greatly over time.
2% (B!CBB8
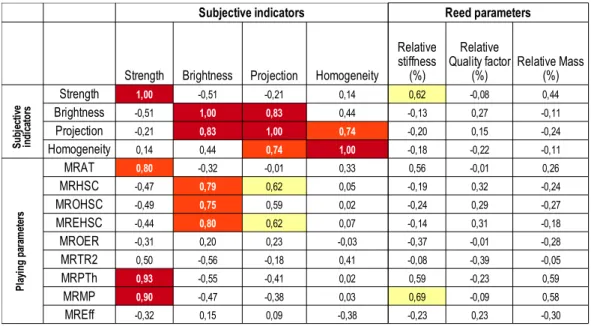
Correlation coefficients between Reed ("in vitro") indicators and other indicators show low correlation coefficients. This seems to indicate that an "in vitro" measuring device using low-amplitude excitation does not provide the appropriate stiffness represented in Eqs. Optimization of the model with respect to root mean square error (model with a single independent variable) was performed.
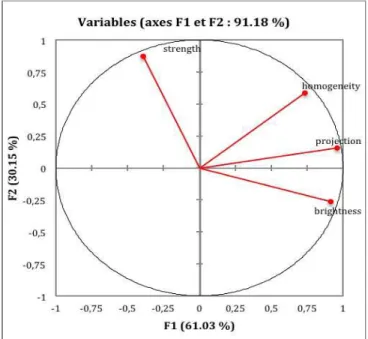
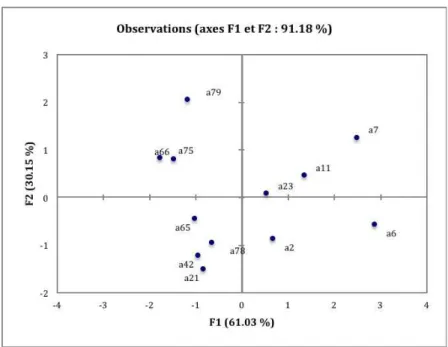
For strength, the selected variable of the best model was the relative mean pressure threshold MRPTh (Figure 22). The good fit of the model to the reed strength data gives us confidence to use this model to predict the observed reed strength. The ACP of “in vitro” parameters is shown in Figure 24 and shows that for this reed series the three “in vitro” indicators RQ RS RM form a 2d space.
To see how the playing parameters ("in vivo" variables) correlate with the cane parameters ("in vitro variables"), the "in vivo" variables are projected onto the factorial level as additional variables (Figure 24). These results show that there is not a strong correlation between the "in vitro" indicators and the playing parameters ("in vivo"). The correlation remains very low, showing that this "in vitro" measurement technique cannot be used to predict the playing parameters with a linear model.
To see if the "in vitro" indicators can better explain the subjective indicators, subjective variables are projected at the factorial level as additional variables (Figure 26). The indicator "strength" appears to be correlated with the relative stiffness (RS) and relative mass (RM). The comparison between the subjective dimensions and the "in vivo" parameters shows that the estimated threshold pressure is correlated with the subjective dimension "strength" with a coefficient of determination equal to 0.87.
This result gives us confidence to use in vivo measurements as a predictor of subjective reed quality. The Reed parameters obtained with series 1 do not show a strong correlation with either the “in vivo” parameters or the subjective descriptors. Various uncontrollable factors (humidity, position, etc.) can greatly affect the measurements of the frequency response of the reeds.
Furthermore, the lack of significant correlations between in vitro parameters and subjective descriptors indicates that the prediction of subjective quality with in vitro measurements made in the prescribed form is not possible with a linear model. Further studies are needed to improve the experimental method for measuring reed response.