The molecular weight also has a large influence on the structure of the complexes, as long chains tend to form larger spheres. This leads to another step, which also depends on the strength of the interactions: either liquid-liquid phase separation (coacervation), where one phase is enriched with soluble complexes, or liquid-solid phase separation (precipitation). The meaning of the stoichiometric ratio, which we introduce below as [-]/[+], has also been considered (as noted x = [+]/[-]) by analytical theories, , in a reductionist approach that considers mixtures of large macroions with smaller Z ions of opposite charge, both possibly either globules or chains[43, 44].
Regarding the influence of ionic strength, the comparison between simulation and experiments is still controversial. The net charge of the protein varies between +17 and +8 depending on the pH conditions given in Table 1 of the Supporting Information. The ionic strength of the co-ions is assumed to be equal to the molarity times the net charge.
The charge density of the polymer is proportional to the number of non-methylated monomers per 100 monomeric units, i. In the following, the influence on the interactions between lysozyme and pectin is studied of: (i) the pH, using three pHs.
SANS measurements
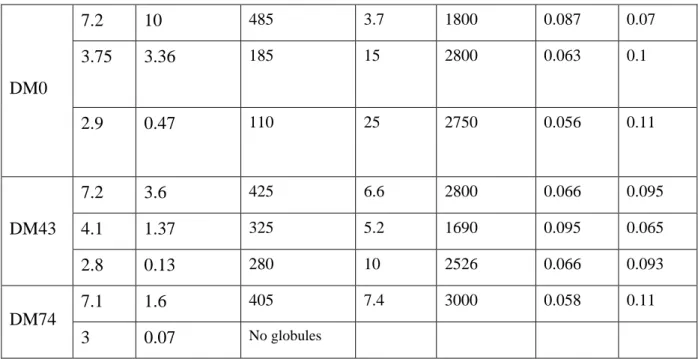
For DM0 and DM74 at pH ~7, two different samples were measured at two different times. Proteins in free or complexed state were measured respectively by colorimetric and UV detection after separation using ultrafiltration membrane (Amicon Ultra MWCO, Millipore, USA) for different concentrations. They show that more than 98% of the proteins are in turbid mixture complexes or in precipitates when the latter are observed.
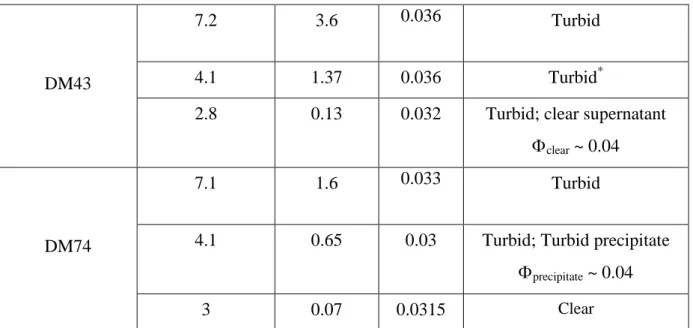
The possibility of precipitation or slow decantation inside the cell (see Table 1), which removes some of the complexes from the beam, must be considered. No precipitation was observed either before recording the spectra or during removal of the samples between 12 H and 24 H later, except for DM43 at pH 4.1. But even in this case we are sure of the result, for the following reason: a significant precipitation, removing some material from the beam, would be visible in the large range q.
There, the signal of all lysozyme, complexed or free, was measured, so that the scattering is equivalent to the scattering of a solution of free soluble lysozyme at the same concentration.
Individual components of the mixtures
At low q, a small increase due to aggregates is observed for lysozyme, but it is not large enough to compete with the scattering from complexes.
Mixtures
It is much larger than the scattering of single lysozyme, which shows a plateau in this region, and also larger than that of pectin, which diffuses as q-1.7. In this case, this may be due to a transition to a new regime of spatial distribution of primary globules. Before proceeding with the details, two important features of scattering curves should be emphasized.
In this interval, one probes the form factor of the objects; and the scattered intensity is almost constant in first approximation. This means that the amount of specific area of the proteins is constant from one sample to another. At pH ~ 7 (Figure 2.a), the intensity of the scattering in the q-4 region decreases as the ratio [-]/[+]intro increases, which, according to Porod's law, suggests that the specific area decreases under the assumption of, that the contrast between sphere and solvent does not change (this will be discussed quantitatively below).
At large q, the correlation peak depends on the charge as observed for other pHs: as at pH 4, it evidences for DM 43, a less perfect aggregation of proteins (point shifted towards low q). When we observe DM0 as a function of pH (Figure 3.a), we see the same dependence on [-]/[+] input as mentioned above: the lower the charge, the higher the signal in the q interval -4 and the smaller the size of the globules.
Quantitative analysis
The second, at the highest qs, corresponds to the Porod law of each lysozyme, which corresponds to the scattering from the inside of the beads. For our full set of samples, the accuracy of the experiment is less than 15%. From the size of the beads and the volume fraction of the lysozyme within the complexes (lyso ~ 1/2 inner), we can deduce the volume occupied by lysozyme per bead, and thus the number of lysozyme per bead Nagg.
We will only focus here on values for pH 7, to give some examples of the variation. 1 Influence of methylation degree, pH, [-]/[+]intro and molecular weight on the structure of the pectin/lysozyme complexes. We will now discuss the scattering data as a function of the different parameters (DM, pH, molecular weight) using mostly the degree of stacking of the proteins, observed from the correlation peak at large q and the characteristics of the spheres (size radius and compactness) obtained at low Q.
Because we are working with a quasi-constant chain concentration, the effect of the charge ratio and the effect of the linear charge density cannot be separated. At first glance we could therefore conclude that the enhancement of the peak is merely an effect of the linear charge density due to the decrease in methylation. However, another pair of samples involving chains of the same higher molecular weight show a similar effect.
There are strong analogies between the dispersion described here on pectin/lysozyme and the dispersion of the PSSNa/lysozyme system, in the region of the phase diagram where the PSS chains are in a dilute regime after interaction with the proteins [36]. These differences must be due to the effect of the persistence length, in agreement with simulations [19, 20], which predict less complexation for more chain stiffness. It is especially important for applications because it controls the accessibility to the core of the spheres.
The stiffness effect can also play a role in bead size. The lower attraction may be related to the difference in the surface charge density of the beads in the two systems: the surface charge density for pectin is lower because the linear charge of pectin is weaker than that of PSS. A final interesting point of comparison between the pectin/lysozyme and PSS/lysozyme systems concerns the hydrophobic effects.
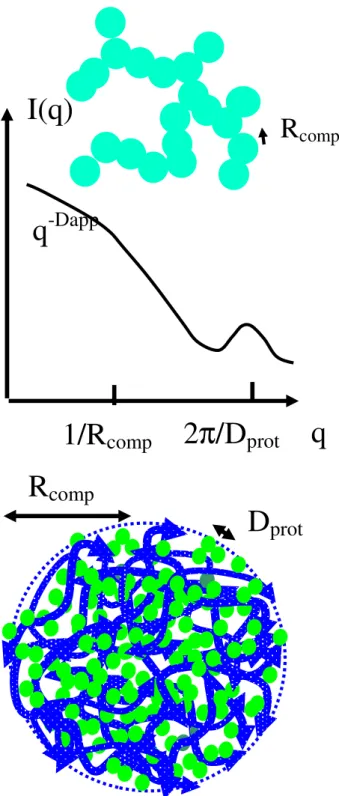
On large scales, the bead sizes range between 10 nm for the lowest level of pectin charge and 50 nm for the highest. The comparison is complicated by the fact that at low DM (lower charge) the beads stay small and aggregate into larger structures. This may be due to the lower molecular weight of the DM0 chain: keeping all other physicochemical parameters constant, short chains tend to form smaller beads). Two components of the trick are based on the plot of I(q).q4/2 = f(q) scattering curves (Figure 5).
Once we have determined, from the X axis, the value of Rcomp, it is possible to use the absolute values along the Y coordinate, I(q).q4/2 to obtain the contrast of the globules: comp.