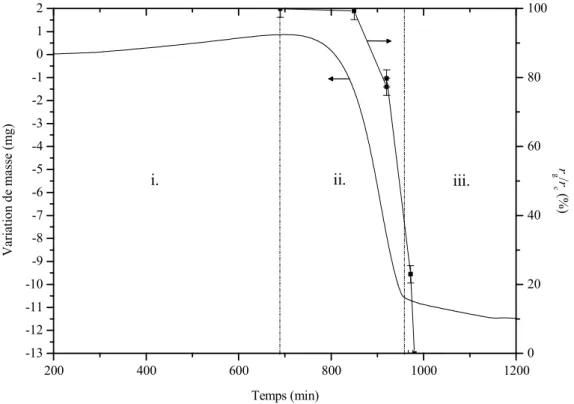
Le début du grossissement des grains coïncide avec le début de la réduction de la silice. En particulier, le rôle de la couche de silice à la surface des particules de silicium reste mal compris.
Context
- Silicon production
- Metallurgical Grade silicon (MG-Si)
- Electronic Grade silicon (EG-Si)
- Solar Grade silicon (SoG
- Bulk crystalline silicon solar cells
- Silicon crystallization and wafering
- Solar cell fabrication steps
- Thin film crystalline silicon solar cells
- Crystalline Silicon Thin Film solar cells (CSiTF) particularities
- The needs for low cost substrates
- S’Tile process: silicon sintered substrates for the PV industry
- Solar cell structures and substrate requirements
- Substrate elaboration process – Technological and scientific issues
- Conclusion
Then the crystallization front moves progressively from the bottom to the top of the crucible. Although the crystallization front rate in the Gradient Freeze process (~1 cm/h) is lower than in the Czochralski process (~10 cm/h), the global rate of crystallization is greater (~10 kg/h compared to ~2 kg /h) as the section of the bar is much larger. The biggest advantage of the first generation of solar cells is the robustness of the elaboration process.
The Epitaxial Wafer Equivalent (EpiWE) [RHEW04] is one of the simplest methods to realize a CSiTF solar cell. EpiWE or RexWE processes are not as strict regarding the porosity of the substrate.
![Figure I.1: Photograph of silicon rods [Pro06].](https://thumb-eu.123doks.com/thumbv2/1bibliocom/463399.69173/70.892.190.700.505.840/figure-i-1-photograph-silicon-rods-pro06.webp)
Starting materials and methods
Powders and characteristics
- Powder morphologies
- Particle size characterization
- Powder purity
- Powder castability and sinterability
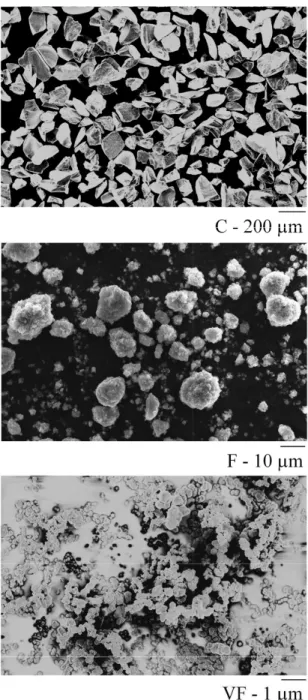
The powder morphology (Figure II.1) was observed using standard scanning electron microscopy (SEM, LEO STEREOSCAN 440) or field emission gun scanning electron microscopy (FEG-SEM, CARL ZEISS ULTRA55) for the finest. The specific surface area, SSABET, given in Table II.2, is then derived from a plot of adsorbed volume as a function of gas pressure. From these observations, the size of the angular particles in the coarse can be related to the specific surface area measured by BET using equation (II.4) and the shape factor, n # 5.
Using equation (II.1) to estimate the particle diameter from BET measurements is then appropriate in this case. In Figure II.4, the equivalent sizes, 2a, of angular (Equation (II.4)) and spherical (Equation (II.1)) particles are plotted against specific surface area measured by BET.
High temperature treatments
- Furnace geometry and materials at the sample surroundings
- Thermogravimetry
- Dilatometry
- Water vapor partial pressure controller
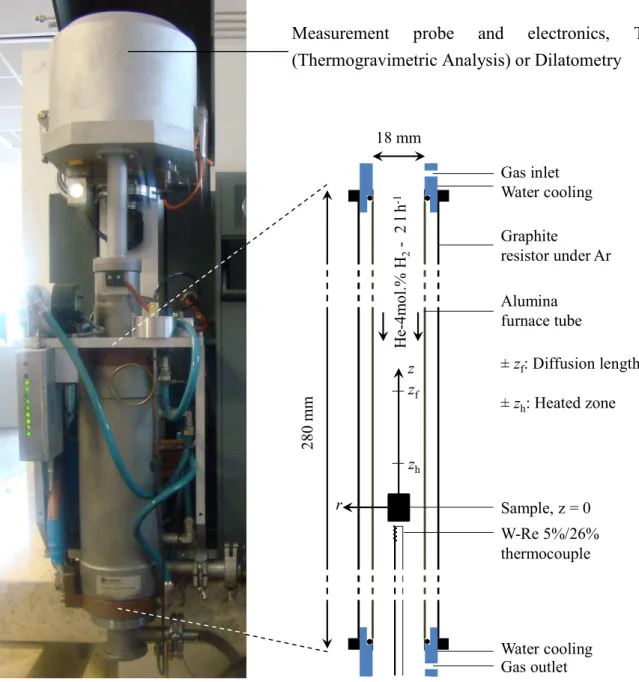
600 MPa cannot be applied during compression due to the risk of the punch sticking in the mold. In most of the experiments, He-4 mol.% H2 (supplied by Air Liquide, mixed crystal) gas mixture was used. An alumina push rod is in contact with the top spacer and follows the progress of the sample during the thermal cycle.
The load applied by the push rod to the sample (typically 5 g) is controlled by inductors at the top of the device. During blank experiments, the push rod is in contact with the bottom of the aluminum tube.
Metallographic procedures
For some experiments, the variable water vapor pressure in the sample environment is used by monitoring the water vapor in the upstream gas flow at the pipe inlet. The water vapor pressure is monitored with a humidity control system consisting of two gas lines and shown schematically in Figure II.10. The two gases are mixed and a humidity probe (Vaisala HUMIDICAP® HMT333) connected to a controller (West N8800) allows adjusting the thermal mass flow (Brooks SLA5850S) to give a water vapor pressure, HProbeO.
We will see from the modeling arguments in Chapter V.2 that these water vapor pressures actually correspond to approximately 10 and 200 Pa in the surrounding sample. Between each step the sample is cleaned with ethanol in an ultrasonic bath and rinsed under water.
Oxidation kinetics
Passive and active oxidation of silicon
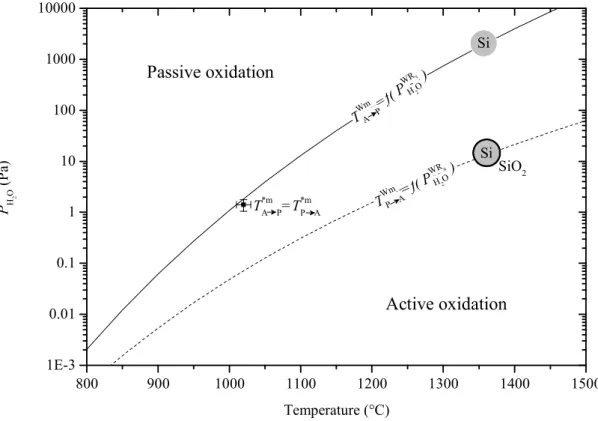
At low temperature and high oxygen pressure, passive oxidation of silicon occurs, which means that the formation of solid silicon dioxide, SiO2(s), is promoted through reactions (R1) or (R3) (equilibrium constant K1 or K3), depending on the atmosphere ii . In the first case (iii.), we consider the competition between the formation of solid silicon dioxide (R3) and gaseous silicon monoxide (R4). As long as the effective partial pressure of silicon monoxide, PSiO, is lower than the equilibrium partial pressure, PSiOR5 (equation (III.1)), the silicon surface remains bare.
In the same way as discussed above, PSiOR7 (Equation (III.3)) determines the transition between passive and active oxidation. In Figure III.1 the expected TAWmP and TPWmA are plotted as a function of the ambient water vapor pressure.
Elucidation of silicon powder oxidation mechanisms .1 Experimental approach
Experimental results
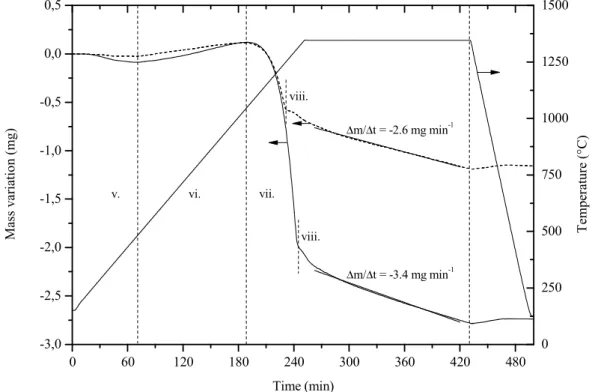
Below 400 °C, a mass loss related to desorption of adsorbed species on the powder is observed. Actually, the water is probably supplied by a condensate film observed 70 mm below the sample position, on the furnace tube and on the thermocouple (Figure III.4, Appendix B.3.4). With reference to Figure III.1 (point), the relevant mechanism for the passive to active transition can be determined with the water partial pressure calculated Pa.
Another proof of the previous statement is the ratio between mass gain and mass loss measured in the etched powders (dashed line in Figure III.3), in which the amount of silica increased during passive oxidation should be equal with the amount of silica further reduced. The global mass loss, mols, depends on the initial thickness of the silica layer as estimated in Figure III.2, but also on the silica grown during the passive amorphous phase, possibly silica glass.
Summary
IGA measurements (Chapter II.1.3) agree with estimates predicted from the mechanism (R5) as can be seen in Figure III.5. The experimental passive to active transition temperature is equal to the active to passive temperature estimated from the equilibrium constant of reaction (R5) and ambient water vapor pressure. When reaction (R5) is considered as the silica reduction mechanism, TGA measurements confirm IGA measurements of the oxygen contamination in starting powders.
Mass loss ratios of passive and active oxidation on previously etched powders are coherent with the balance of reaction (R5). Reaction (R5) is possible at temperatures as low as C and hydrogenated atmosphere is not helpful in terms of silica elimination.
Silica reduction kinetics in silicon powder compacts .1 Experimental approach .1Experimental approach
- Experimental results on 7 samples
- Model for silicon compact oxidation
- Application of the model to 7 samples
- Extension of the model to 15 samples
- Summary
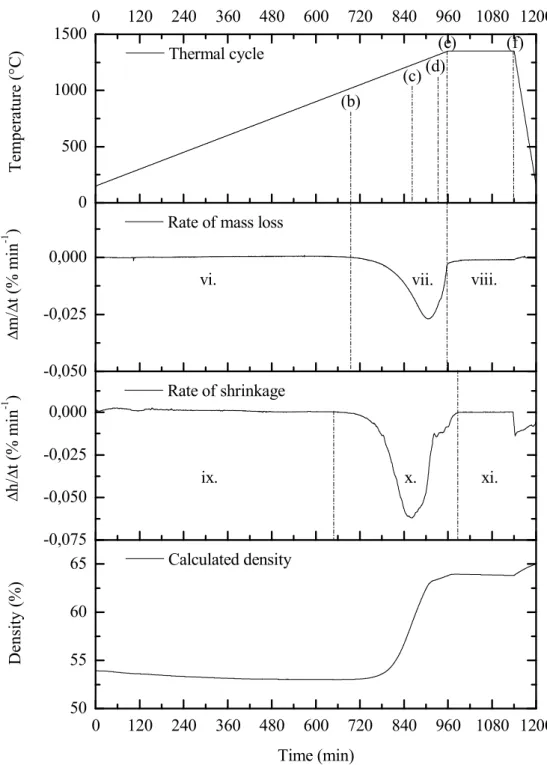
The relative density of the compact mass is deduced from the rate of mass loss and the rate of shrinkage assuming isotropic shrinkage. The model correctly predicts a faster decrease in mass loss rate compared to the standard cycle of 1.25 °C min-1. For sample 15, the effect of reducing porosity on the global mass loss of the sample is shown.
The model predicts an earlier mass loss, but taking into account the shape of the curve. Indeed, for the 15 sample, reducing the pore fraction in the model leads to a better fit of the mass loss curve (Figure III.10).
Discussion: continuity of the silica layer
However, during heating under the passive-to-active transition, continuous growth of the silica layer occurs through reaction (R1). But, as soon as the passive to active transition temperature is exceeded, the overall concentration of vacancies should increase and accelerate the diffusion of silicon monoxide molecules (Figure III.13 (a)). Another possible reason for the acceleration of the diffusion in the silica layer after the passive to active transition is the generation of vacancies by the reaction itself (R5), at the silicon-silica interface.
Regardless of the origin of the defects, given the thickness of the silica layer (0.5 nm, two or three silica tetrahedra), these should rapidly propagate into non-healable holes (Figure III.13 (d)) as observed by Tromp et al. According to a mass balance, at passive to active transition, the evaporation does not limit the silicon monoxide exit, if equation (III.36) is verified.
Conclusion
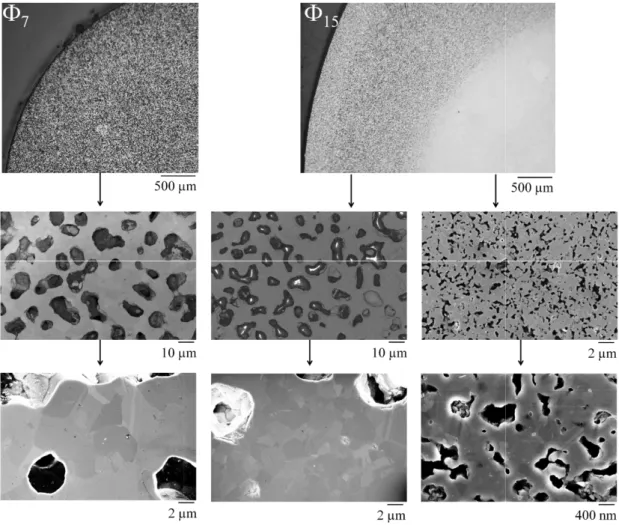
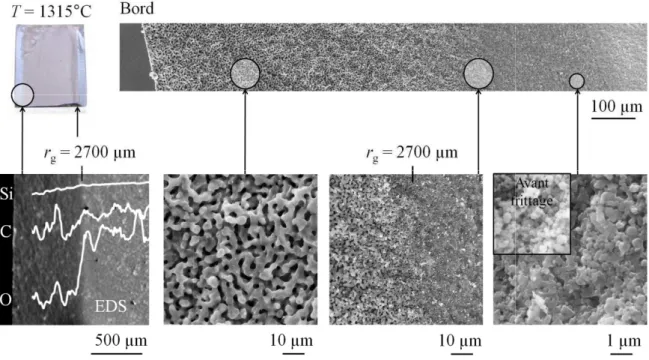
The diffusion flux of silicon monoxide from the sample surface is roughly estimated in equation (III.35) from the discussion in section III.3.3. From our results on silica reduction kinetics, it is fair to assume that the hole area fraction exceeds this limit as soon as the passive-to-active transition is exceeded. From the reduction front to the edge of the sample (reduced area), densification is hindered by significant grain coarsening (7 microstructure in Figure III.11) and densities higher than 65% TDSi cannot be achieved.
As far as the silicon sintering process is concerned, the understanding of the role of the silica layer on silicon sintering mechanisms is of crucial importance and will be discussed in Chapter IV.2. The establishment of a model related to silica reduction and microstructure evolution in porous layers will also be of great importance to control the residual oxygen content, the porosity and finally the electrical properties of the final material.
Sintering kinetics
Sintering stage models .1 Sintering stage definitions
- Effect of interface curvature on solid and vapor phases
- Initial sintering stage: mechanisms and equations
- Intermediate and final sintering stage models
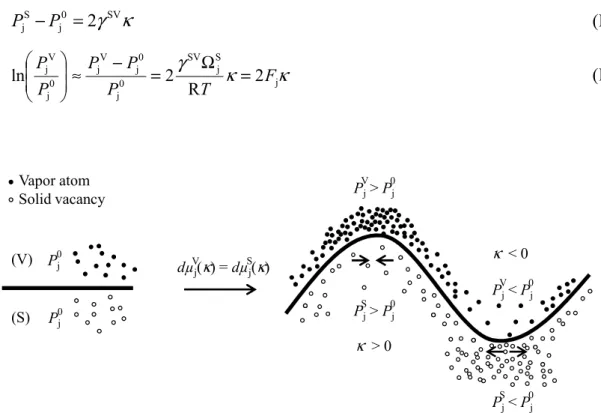
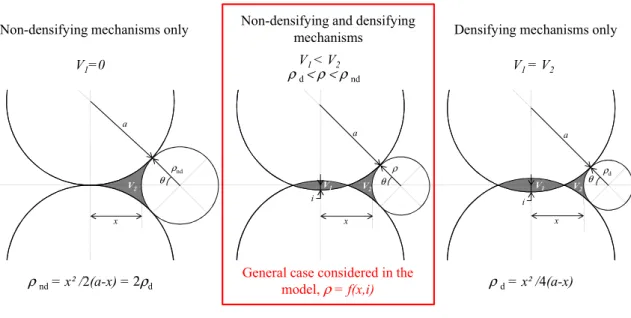
According to the Laplace equation (IV.5), the curvature of the solid-vapor interface causes a pressure jump at the surface of the particle between the solid phase and the vapor phase. In the solid phase (Equation (IV.8)), a positive curvature (convex surface) also results in a pressure increase that acts as a compressive stress on the lattice, while a negative curvature (concave surface) results in a pressure drop that acts as a tensile stress. The volume of the tetrakaidecahedron, Vt, is given in equation (IV.23), where lp is the length of the pore segment.
The pore volume per tetrakaidecahedron, Vp, is given in equation (IV.24), where p is the radius of the pore. The pore volume fraction is then defined as the ratio between Vp and Vt in equation (IV.25) [Cob61].
The role of silica during sintering of silicon .1 Literature analysis
- Neck growth kinetics estimations
- Silicon sintering: experimental approach
The lattice diffusion coefficient estimated from this study, DSil,Si, is given in equation (IV.29). This diffusion coefficient, given in equation (IV.31), is called the lattice diffusion coefficient of silicon in silica, DSil,SiO2. The silicon-to-silicon surface diffusion coefficient, DSis,Si, is very high (Equation (IV.30)).
The neck growth rate by lattice diffusion from the particle surface is given in Equation (IV.18). If DSiOl,SiO2 [SK90] (Equation (IV.32)) is chosen, the presence of silica only slightly affects lattice diffusion kinetics.
Modeling of densification kinetics
- Initial stage of sintering
- Intermediate stage of sintering
- Combination of initial and intermediate stage models
In the second part, the modeling of the second stage (second peak) is discussed, taking into account the growth of the microstructure observed in the photomicrographs of samples (i) and (j) (Figure IV.15). By integrating equation (IV.51), the diffusion coefficient of silicon into silica from Brebec et al. BSS+80] can be modified to account for the effect of pressure drop in equation (IV.52).
Indeed, once the neck is formed, part of the pore surface is concave as shown in Figure IV.24. In Figure IV.24, the concave surface fraction and the increase in pore segment length are plotted against temperature.
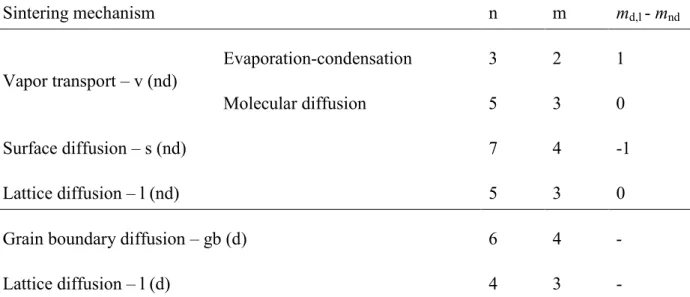
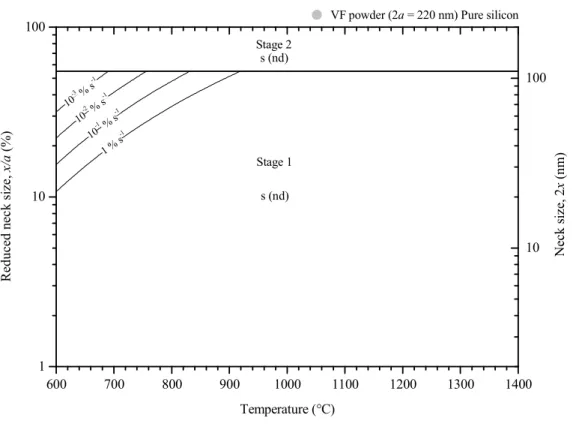
Sintering maps: effect of silica and particle size
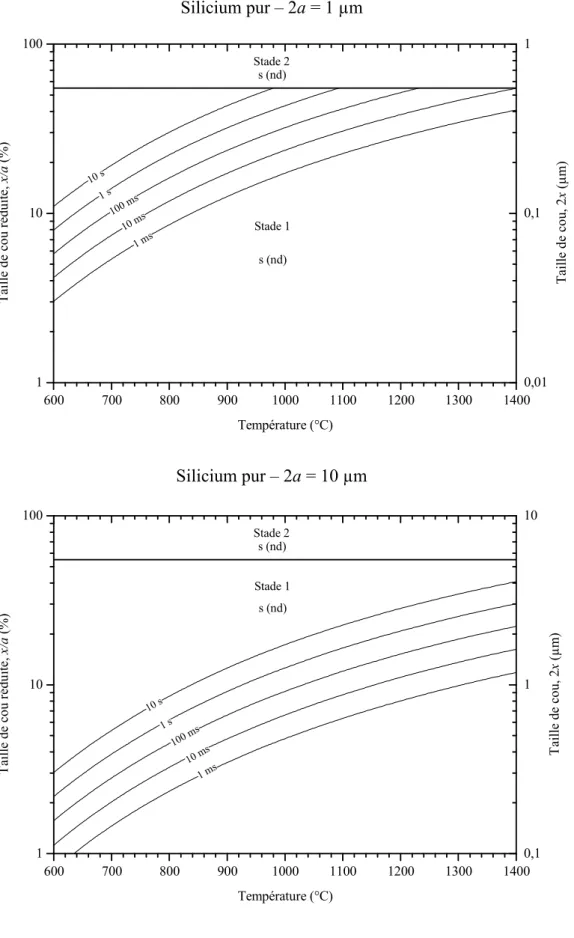
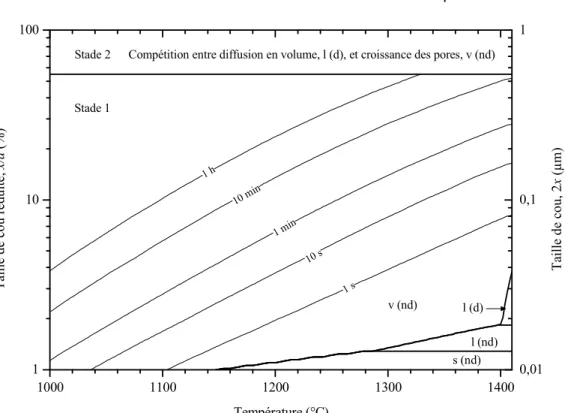
Then, for neck-to-particle size ratio higher than 55 %, sintering occurs in the second phase. For silicon particles coated with silica, a particle size change significantly affects the boundary positions between sintering mechanism domains (Figure IV.30). As the particle size is reduced, the surface diffusion domain (s (nd)) grows to higher neck-to-particle size ratio and the vapor transport domain (v (nd)) shrinks to higher temperature and neck-to-particle size ratio.
For particle diameters greater than 1 µm, vapor transport dominates sintering kinetics at all neck to particle size ratios. As the particle size decreases, the lattice diffusion domain moves toward lower temperatures and higher neck-to-particle size ratios.
Conclusion and perspectives
![Figure 4: Repartition of the production cost of crystalline [Sun10, Vei11].](https://thumb-eu.123doks.com/thumbv2/1bibliocom/463399.69173/65.892.227.701.762.1051/figure-4-repartition-production-cost-crystalline-sun10-vei11.webp)
![Figure I.8: Absorption coefficient and penetration depth of the light in crystalline silicon depending on the wavelength at room temperature [HB98]](https://thumb-eu.123doks.com/thumbv2/1bibliocom/463399.69173/77.892.156.745.574.946/figure-absorption-coefficient-penetration-crystalline-depending-wavelength-temperature.webp)
