HAL Id: hal-00204222
https://hal.archives-ouvertes.fr/hal-00204222
Submitted on 27 Mar 2008
HAL is a multi-disciplinary open access archive for the deposit and dissemination of sci- entific research documents, whether they are pub- lished or not. The documents may come from teaching and research institutions in France or abroad, or from public or private research centers.
L’archive ouverte pluridisciplinaire HAL, est destinée au dépôt et à la diffusion de documents scientifiques de niveau recherche, publiés ou non, émanant des établissements d’enseignement et de recherche français ou étrangers, des laboratoires publics ou privés.
Raman spectroscopy and X-ray diffraction studies of stress effects in PbTiO3 thin films
A. Bartasyte, O. Chaix-Pluchery, J. Kreisel, J. Santiso, S. Margueron, Michel Boudard, Carmen Jiménez, A. Abrutis, F. Weiss
To cite this version:
A. Bartasyte, O. Chaix-Pluchery, J. Kreisel, J. Santiso, S. Margueron, et al.. Raman spectroscopy and X-ray diffraction studies of stress effects in PbTiO3 thin films. IEEE Transactions on Ultrasonics, Ferroelectrics and Frequency Control, Institute of Electrical and Electronics Engineers, 2007, 54 (12), pp.2623. �10.1109/TUFFC.2007.589�. �hal-00204222�
Raman Spectroscopy and X-ray Diffraction Studies of Stress Effects in PbTiO
3Thin Films
Ausrine Bartasyte1,2*, Odette Chaix-Pluchery1, Jens Kreisel1, José Santiso3, Samuel Margueron1, Michel Boudard4, Carmen Jimenez1, Adulfas Abrutis2, François Weiss1
1 Laboratoire des Matériaux et du Génie Physique (CNRS-INP Grenoble-Minatec), 3 parvis Louis Néel, BP 257, 38016 Grenoble Cedex 1, France
2 Vilnius University, Department of General and Inorganic Chemistry, Naugarduko 24, LT-03225 Vilnius, Lithuania
3 Institut de Ciencia de Materials de Barcelona, Campus de la UAB, E-08193, Spain
4 Laboratoire de Science et Ingénierie des Matériaux et des Procédés (CNRS-INP Grenoble-UJF), 1130 Rue de la Piscine, BP75,38402 St. Martin d’Hères Cedex, France
* Corresponding author: ausrine.bartasyte@gmail.com
Abstract: A systematic study of domain structure and residual stress evolution with film thickness and of phase transition in c/a epitaxial PbTiO3/LaAlO3 films using X-ray diffraction and Raman spectroscopy is reported. Both techniques revealed that the films are under tensile residual stress in the film plane and that a-domains are more stressed than c-domains. The two components of the large A1(TO) Raman modes are associated with a- and c-domains and their intensity ratio correlates to the volume fraction of a-domains. The evolution of the Raman signature with temperature revealed that the spectrum of a-domains disappears around 480°C whereas c-domains present an anomaly in their spectrum at 500°C but maintain a well-defined Raman signature up to 600°C.
I. Introduction
Lead titanate PbTiO3 (PTO) is a classical example of a ferroelectric oxide among the perovskite family. Thin films of PbTiO3 and other related materials offer key advantages for a variety of applications in non-volatile memories, microelectronics, sensors technologies and electromechanical systems [1]. Physical properties of ferroelectrics in bulk material and in thin films are substantially different due to stresses, grain size effect, domain structure, defects, etc. [2, 3]. For instance, film stresses can significantly change mechanical, optical and electrical properties, ferroelectric domain structure and the nature of phase transition, which in turn has a potential influence on the reliability of devices. Physical properties such as dielectric, piezoelectric, and optical characteristics critically depend on the ferroelectric domain configuration [4, 5] which also depends on the various stresses developed during film fabrication. As a consequence of this, several authors have developed a thermodynamic theory which predicts the domain configuration of epitaxial ferroelectric films as function of lattice mismatch and temperature [6-9]. Given the complexity of internal and external stresses, an experimental investigation of residual stress remains useful for predicting and controlling physical properties for ferroelectric film - based devices.
Films are usually subjected to substantial stresses during growth and the subsequent cooling process from deposition temperature to room temperature (RT). At the growth temperature, stresses are mainly misfit stresses (also called epitaxial stresses) which result from lattice mismatch between the film and the substrate; intrinsic stresses related to growth technique are rather negligible in metalorganic chemical vapor deposition (MOCVD). During the cooling process, additional stresses may develop in the film due either to thermal stress arising from different thermal expansion coefficients between the film and the substrate or to a lattice distortion related to the structural phase transition. The main stress relaxation mechanisms in epitaxial ferroelectric films are obtained by the formation of dislocations and domains. Dislocation formation can take place only when the layer thickness exceeds a critical value [10]. Ferroelectric domains form at and below the cubic-to- tetragonal phase transition and are generally observed in the form of tweed patterns in the low temperature phase [11].
In the past, optical fluorescence [12], X-ray diffraction (XRD) [13], wafer curvature measurements [14], cantilever beam deflection [15], laser reflectance [16] and Raman spectroscopy [17-24] have been used for stress analysis of ferroelectric materials. Among them, XRD and Raman
spectroscopy are the most popular techniques, as they are powerful tools for non-destructive investigation of structure. Raman spectroscopy is complementary to XRD methods as it is a local probe and is sensitive to even subtle changes of symmetry. Moreover, ferroelectricity and thus Raman modes are strongly influenced by mechanical deformation of the sample resulting, for example, from hydrostatic pressure or stress [18, 19, 25-28].
Here we report a study of domain structure and residual stress evolution with film thickness and of phase transition in epitaxial PTO films on LaAlO3 (LAO) by using XRD and Raman scattering. In particular, Raman measurements were performed in all polarization configurations attainable in the backscattering geometry which allows us to obtain information on both a- and c- domains.
II. Theoretical considerations
At room temperature PTO is ferroelectric and adopts a tetragonal crystal symmetry (space group C14v) with one formula unit in the unit cell [29]. At 490 °C, a ferroelectric-to-paraelectric phase transition takes place. It has been reported that this structural phase transition has both displacive- and order-disorder-like properties [30, 31] as is the case for most ferroelectric perovskites. In the cubic high-temperature phase (space group O1h), there are 12 vibrational degrees of freedom at k=0, which belong to the irreducible representations 3T1u + T2u, where T2u is a silent mode since it is neither infrared nor Raman active. The triply degenerated T1u modes are only infrared active. According to these selection rules, Raman modes should disappear in the paraelectric cubic phase. In the tetragonal phase, each T1u mode splits into A1 + E modes, resulting in 3A1 + 3E modes, whereas the T2u mode splits into B1+E modes. The A1 and E modes are infrared and Raman active and the corresponding phonons are polarized in the z-direction or in the xy plane, respectively; the B1 mode is only Raman active. The Raman tensors are presented in (1) for each mode, and the direction of polarization is indicated in parentheses.
˙
˙˙
˚
˘
Í ÍÍ Î È
⋅
⋅
⋅
⋅
⋅
⋅
=
b a a z
A1( )
˙
˙˙
˚
˘
Í ÍÍ Î È
⋅
⋅
⋅
⋅ -
⋅
⋅
⋅
= c
c B1
˙
˙˙
˚
˘
Í ÍÍ Î È
⋅
⋅ -
⋅
⋅
⋅
-
⋅
⋅
= e
e x
E( )
˙
˙˙
˚
˘
Í ÍÍ Î È
⋅
⋅
⋅
⋅
⋅
⋅
⋅
= e
e y
E( ) (1)
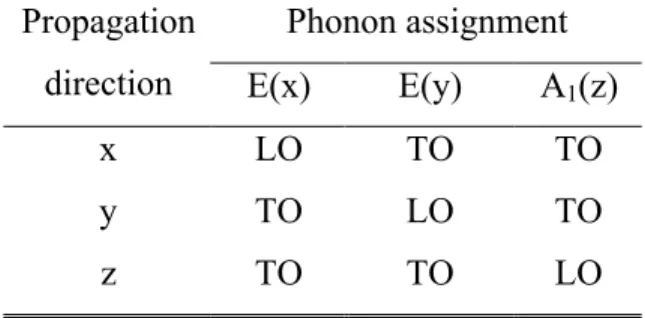
Due to long-range electrostatic forces, all A1 and E modes split into transverse (TO) and longitudinal (LO) components. Depending on the phonon propagation direction (x, y or z), only pure TO or LO can be observed in Raman spectra, as presented in Table 1.
III. Experimental details
Film depositions were carried out in a vertical hot wall pulsed injection MOCVD reactor described elsewhere [32-34]. The injector injects micro-doses (a few microliters) of an organic solution containing a dissolved mixture of metalorganic precursors. After flash evaporation of the micro-doses, the resulting vapor mixture is transported by an Ar + O2 gas flow towards the heated substrate. The injector consists of a computer-driven, high-speed, precision electromagnetic valve operating under a repetitive pulsing regime. The deposition conditions were optimized in order to obtain a pure and high quality PTO perovskite phase (bulk lattice parameters a=3.899 Å and c=4.153 Å) deposited on a LAO substrate (a=3.791 Å, supplied by CrysTec, Berlin, Germany) with the surface cut parallel to a (00l) plane (indices refer to the pseudo-cubic setting) [35, 36]. Films of different thickness from 30 to 460 nm were deposited at 650 °C. The thicknesses were measured from the film cross-section micrographs obtained by scanning electron microscopy (SEM). XRD attests a high quality, single phase film. More details concerning deposition techniques and standard sample characterization can be found in references [35, 36]. Texture analysis of epitaxial films was carried out using a Bruker D8 Advance diffractometer (Bruker AXS, Karlsruhe, Germany) with a four-circle and general area detection diffraction system (GADDS) (lCuKa1=1.54056 Å, Ni filter).
The LAO substrate was used as an internal standard assuming that it is stress-free.
Raman spectra were collected using a Labram spectrometer (Jobin-Yvon/Horiba, Villeneuve d’Asq, France) equipped with a N2 cooled charge coupled device detector. Experiments were conducted in the micro-Raman mode at room temperature in a backscattering geometry. The 514.5 nm line of an Ar+ ion laser was focused on a spot size smaller than 1 mm. The system was calibrated using Si spectra at room temperature. The temperature measurements in the range from room temperature to 600 °C have been carried out by using a commercial Linkam heating stage (Linkam Scientific Instruments Ltd., Survey, UK) placed under the Raman microscope.
IV. Results and discussion
A. XRD results
The q/2q XRD patterns of PTO/LAO films are characteristic of the PTO tetragonal structure consisting only of intense (00l) and very weak (h00) reflections [37]. This indicates a dominant c-
domain structure containing a small fraction of a-domains. Two-dimensional reciprocal space mappings near the (103) and (301) PTO peaks are shown in Fig. 1a. The reciprocal space mapping integrates the intensity from different j-angles (± 5°), making it possible to observe together the (301) and (310) reflections, which were found at different j-values. The coexistence of (301) and (310) reflections indicates that there exists two types of a-domains, a1 and a2: both types have their c-axis parallel to the substrate plane but a2 domains are rotated by 90 ˚ with respect to a1 domains.
(301) reflection is split in two spots indicating twinning of a-domains. The (103) spot corresponding to c-domains is elongated which indicates that some twinning also appears in c-domains.
In order to clarify the twin structure, w-c contour maps of c-domain (003) and a-domain (300) reflections were measured (Fig. 1b and 1c). The maps reveal twinning in a- and c-domains with fourfold symmetry. Twinning is very well pronounced in a-domains (Fig. 1c), whereas it is less evident in c-domains despite the square shape of the spot (Fig. 1b). The evolution with film thickness, of twin angle of a- and c-domains extracted directly from the splitting of the reflections in the XRD maps, is given in Table 2. One can see that the tilt of c-domains increases whereas the tilt of a-domains slightly decreases with increasing film thickness.
The proportion ofc- and a-domains was quantified as the percentage of a-domains (A, %) in the films and was calculated by peak integration of the (102) reflection in j-scans corresponding to the different domains:
A= 2*(I(102)c=58°+I(102)c=62°)
2*(I(102)c=58°+I(102)c=62°)+I(102 )c=27°*100 (2) , where I is the peak integrated intensity in j-scans measured at different c angles, corresponding to a-axis (c = 58 ° or c = 62 °) and c-axis (c = 27 °) oriented crystallites (i.e.,a- and c- domains). More details on domain structure can be found in Ref. 35. An evaluation of the volume fraction of a- domains, applying Eq. (2), is given in Table 2 as a function of PTO/LAO film thickness.
The evolution of the c lattice parameter in c-domains with film thickness is given in Fig. 2. The lowest value is observed in thinnest films and it gradually increases with thickness without reaching the bulk c value even in the 460 nm thick film. The c lattice parameter in PTO/LAO films is lower than the value reported in the literature for bulk PTO. Thin films are usually considered to be subjected to biaxial stresses in the film plane and we thus consider that the normal direction is stress- free. If the films are subjected to a biaxial compressive in-plane stress, the in-plane values would be strained: the in-plane parameter would be shorter and the c-axis (out-of-plane parameter) larger.
Therefore, the c-parameter decrease in c-domains should arise from biaxial tensile stress in the film plane although a compressive misfit stress is expected. The fact that we do not observe a compressive stress at RT indicates that the films do not retain the strain induced by the mismatch with substrate. A more important source of strain is probably produced by other types of stresses. We will address this apparent contradiction later in the manuscript.
B. Raman spectroscopy results 1- Effect of polarization
Raman spectra were measured in crossed and parallel polarization configuration (VH and VV, respectively) on the film surface or cross section, i.e. the incident and scattered laser beams are normal or parallel to the substrate plane, respectively. The consideration of the crystallographic reference setting of the films in our system (a- and c-domain structure) and the use of the above- discussed Raman selection rules allows us the assignment of the Raman modes as schematically illustrated in Fig. 3.
It follows that when a spectrum is recorded on the film surface, E(TO) modes observed in VH configuration come from a-domains only, whereas A1(TO) modes obtained in VV configuration originate in a-domains and A1(LO) in c-domains. The spectrum recorded on the film cross section in VH configuration consists also of E(TO) modes, which come from c- and 50 % a -domains, according to Raman selection rules. VV spectra measured on cross section consist of A1(LO) modes related to a-domains and A1(TO) modes, which come from c- and 50 % a-domains. Considering that the c-domain fraction is greater than 80 % in films of all thicknesses, we can assume that E(TO) and A1(TO) modes come mainly from c-domains when spectra are collected on the film cross section. As seen in Fig. 3, E(LO) modes cannot be observed in our measurement conditions if selection rules are strictly obeyed. In conclusion, modes relative to a- and c-domains can be separated in polarized Raman spectra recorded on the film cross section as well as on the film surface.
As predicted by the C4v point group selection rules, only E(TO) modes are observed in the PTO/LAO spectrum recorded in VH configuration on the film surface and cross section (Fig. 4); this attests to a good crystalline quality and epitaxy of the film. The spectrum measured in a parallel polarization configuration (VV) contains a mixture of A1(TO), A1(LO), E(TO) and E(LO) modes instead of the only allowed A1 modes. Furthermore, when spectra are recorded on film surface, A1(TO) modes coming from both c- and a-domains are observed as seen in Fig. 4. This probably is
related to the existence of ferroelectric domains leading to a depolarization of the laser beam. In spectra recorded on film surface, the separation of A1(TO) modes coming from both a- and c - domains is not evident; as the volume fraction of a-domains is quite small, c-domain A1(TO) modes resulting from depolarization may have higher intensity than a-domains modes. Nevertheless, A1(TO) modes coming from different domains can be separated because the intensity of A1(TO) modes related to c-domains markedly increases in spectra recorded on the cross section.
2- E(TO) modes and residual stresses
It has been reported in earlier studies [18] that Raman modes are sensitive to pressure; their positions in wavenumber was a function of pressure can be described by tan empirical law. If only E(TO modes are considered,
w[E(TO)]=w0[E(TO)]+(dw[E(TO)] /dP)P (3) where w0[E(TO)] is the mode wavenumber at ambient conditions (1 bar, 25 °C), and dw[E(TO)] /dP is the empirical pressure coefficient as determined from measurements under hydrostatic pressure [18, 19]. However, stresses in thin films correspond to non-hydrostatic conditions, and we thus have to introduce the effect of anisotropy in the phonon deformation potential. Supposing the harmonic approximation and using symmetry arguments, the relation between doubly degenerate E mode frequency and applied stresses can be described as follows [38]
E(TO)
Dw =a'E(TO)(sXX+sYY)+b'E(TO)sZZ (4) where DwE(TO)=wE(TO)-w0E(TO), a'E(TO) and b'E(TO)are the deformation potential constants expressed in terms of compliance and sXX, sYY and sZZ are stresses along a-, b- and c-axis of tetragonal PTO cell, respectively. In the case of hydrostatic pressure P, Eq. (4) can be written as
E(TO)
Dw =(2a'E(TO)+b'E(TO))P (5)
Epitaxial PTO films, grown on cubic substrates, are under biaxial stress sb in the substrate plane. Thus, the shift of E(TO) mode due to biaxial stress in c-domains can be expressed as
E(TO)
Dw =2a'E(TO)sb (6)
and in a-domains as
E(TO)
Dw =(a'E(TO)+b'E(TO))sb (7) Although PTO films are not in hydrostatic conditions, it has been argued in the literature that hydrostatic pressure instabilities offer a guide as how a material will react to an external stress as
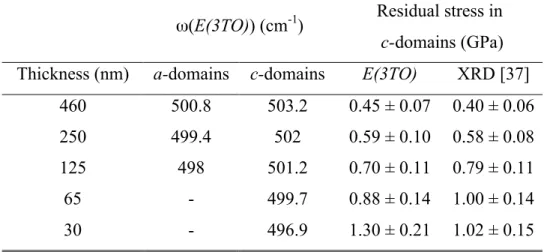
Raman modes also shift linearly under biaxial stress; only the relation coefficients differ. It is to be noted that the stress values in tensile-strained PTO films are, in the literature, often estimated from the shift of the E(1TO) soft mode using Eq. (3) [17, 20, 22, 24]; however, its pressure coefficient is experimentally known only for compression (hydrostatic pressure) (dwE(1TO)/dP = -5.8 ± 0.2 cm-1 GPa-1[18]) and the soft mode is anharmonic. For this reason, we performed stress value calculations from the shift of the E(3TO) mode which is a real (harmonic) hard mode in the sense that its pressure coefficient is positive (dwE(3TO)/dP = +7.1 ± 1 cm-1 GPa-1 [18]). The obtained values were in good agreement with the stress values calculated from the c-lattice parameter obtained by XRD (Table 3), as described in Ref. 37. The similarity between stress values allows us to consider that Eq. (3) can be used for E(3TO) in the case of PTO/LAO films. Therefore, Raman data obtained from hydrostatic pressure experiments can be used in our case to provide an understanding and reasonable estimate of the stress state from E(3TO) hard mode in c-domains in PTO films. From comparison of Eqs. (3) and (4), it results that b'E(3TO)<<a'E(3TO) and then from Eqs. (6) and (7), that the shift of the E(3TO) mode
E(3TO)
Dw in a-domains should be half of that in c-domains for a given biaxial stress value.
Indeed, the E(3TO) mode is observed at a lower wavenumber in PTO/LAO films than in a single crystal (506.2 cm-1) (Table 3). This observation provides evidence that films are under tensile residual stress. Stress values evaluated in c-domains decreased from 1.3 to 0.5 GPa when the thickness increased from 30 to 460 nm (Table 3) [37]. E(3TO) modes related to a-domains are shifted to lower wavenumbers in comparison with modes coming from c-domains (Table 3);
accordingly, a-domains are more stressed than c-domains. The higher stress in a-domains should result from a larger lattice mismatch between the film and the substrate and more probably from the nano-size of a-domains as they form thin sheets in a matrix of c-domains [11], which may generate a supplementary stress at c/a domain interfaces. Therefore, stresses in a-domains are probably not biaxial and the stress relation with DwE(TO) should then be described by Eq. (4). Thus, residual stress value in a-domains cannot be estimated from the shifts of Raman modes, because the stress symmetry in a-domains is unknown.
Qualitatively, one can see that the difference in residual stress in a- and c-domains is considerable. Thus, residual stress value in c/a/c/a epitaxial PTO films with dominant c-domain structure can be determined only from polarized Raman spectra recorded on film cross section. The case of polycrystalline films is different as Raman selection rules are not respected and residual stresses can be evaluated from spectra collected in common way on the film surface. Only few
literature reports can be found on residual stress values in c-domains in epitaxial PTO films [24], and calculations are made by using anharmonic E(1TO) soft mode and Eq. (3).
PTO films are under in-plane tensile stress whatever the film thickness, which is in agreement with XRD results. Thus, the origin of the tensile residual stress is not only the mismatch between the film and the substrate, because this would lead to a compressive stress. Other possible origins of tensile stress are related to phase transition and to a difference in film and substrate thermal expansion coefficients. Thermal stress is usually rather small; thus the high residual stress values, especially in thin films, cannot be explained if the stress related to the phase transition is assumed to be completely relaxed. As a matter of fact, residual stress measured in films at room temperature is the sum of all stresses developed during the complex process of film preparation, and it cannot be associated to only one origin of stress. At the present state of our work we cannot say if the epitaxial stress is relaxed to zero or if only the other types of stress are dominating the physics of the system.
3- Domain structure and A1(TO) modes
Similar to E(TO) modes, A1(2TO) and A1(3TO) modes are also shifted to lower wavenumbers in comparison with A1 bulk modes (Fig. 5 and [37]). As mentioned before, both types of A1(TO) modes related to c-domains and coming from a-domains are observed in VV spectra recorded on the film surface due to a depolarization effect (labeled a- and c-components in Fig. 5). Since a-domains are more stressed than c-domains, it results that a-components appear at lower wavenumbers in comparison with c-components. The intensity ratio between a- and c- components is correlated to the volume fraction of a-domains as shown in Fig. 5; it follows the same thickness dependence as the a- component is the more intense feature in the 125 nm thick film spectrum. Intensities of the A1(TO) mode coming from a-domains are increased in comparison with those from c-domains resulting from the depolarization effect. In a recent study of Pb(Zr,Ti)O3 /MgO epitaxial films [39], a remarkable correlation was found between the intensity of the A1(1TO) mode and the c-domains volume fraction , thus providing a useful probe for domain characterization.
4- Effect of temperature
The evolution with temperature of VH Raman spectra (E(TO) modes) related to a- and c - domains in a 250 nm thick PTO/LAO film is shown in Fig. 6. Up to 400 °C, spectra are rather similar in both a- and c-domains. However, when the temperature is further increased, the spectral
signature of a- and c-domains becomes different: On the one hand, Raman modes in a-domains become gradually larger and less intense and the spectrum almost vanishes. On the other hand, the c- domains maintain a fairly well-defined Raman signature up to 600 °C. This observation suggests that the structural instabilities, with respect to temperature, are different for a- and c-domains. This difference may be explained by various factors, such as the different size and/or orientation of a- and c-domains with respect to the substrate, or a change in the domain structure with temperature.
However, further investigations are necessary to understand this behavior in more detail.
In order to determine the temperature at which the phase transition occurs, the temperature evolution of the E(2TO) mode profile was analyzed for a- and c-domains. The evolution in wavenumber of the E(2TO) mode as a function of temperature is reported in Fig. 7. It can be seen that a- and c-domains indeed show similar behavior at low temperature, in agreement with the above qualitative remarks. On the other hand, while the spectrum of a-domains disappears around 480 °C and is no longer allowed to follow the E(2TO) mode evolution, this mode coming from c-domains presents an anomaly at 500 ˚C. This anomaly provides evidence for a structural rearrangement and we note that this temperature coincides with the ferroelectric-to-paraelectric (tetragonal-to-cubic) phase transition in bulk PTO. Although this coincidence suggests that the c-domains become cubic, the presence of a Raman signature above 500 °C is a direct evidence that the c-domains are not strictly cubic at least on a local level. Although we do not know in detail the stress state of our films, it is interesting to see how our results stand within theoretical predictions. We note that a transition from c/a/c/a to a c-phase and to a paraelectric phase is predicted by Koukhar et al. [7] and Li et al.
[9], which is similar to our experimental observation. However, further investigations are needed to clarify where our films are situated in the so-called Pertsev diagrams. Lets us finally note, that various ferroelectric perovskites present (large) Raman bands even within a cubic average structure, and this is understood by the different coherence lengths obtained by the Raman and XRD techniques. If we consider that XRD probes the long range structure while Raman is a local probe, then the Raman signature of an average cubic structure finds its origin in the existence of local polar disorder which averages out to a cubic structure (one well-known example is the so-called 8-site model [40]). This could also explain our observed persisting Raman signal. However, the fact that the two bands between 200 and 300 cm-1 remain fairly well-defined also leaves the place for an interpretation where the c-domains adopt above 500 °C a new crystal or domain structure. Raman
spectroscopy alone, unfortunately, does not allow to conclude in favor of the first or the second scenario, and high temperature XRD is under way to clarify this point.
V. Conclusions
A systematic study of domain structure and residual stress evolution with film thickness and of phase transition in c/a epitaxial PTO/LAO films is reported by using XRD and Raman spectroscopy.
The results obtained by both techniques provide evidence that the films are under tensile residual stress in the film plane although a compressive misfit stress is expected. The a-domains are more stressed than c-domains, with a significant difference in stress values evaluated from the Raman shift of the E(3TO) mode. Residual stress is partially relaxed with increasing film thickness. As expected by the Raman selection rules, residual stress values in epitaxial PTO films with a dominant c-domain structure can be obtained only from polarized Raman spectra coming from c-domains, i.e. from spectra recorded on the film cross section. The large A1(TO) modes are split into two components, respectively assigned to a- and c-domains; their intensity ratio was correlated to the volume fraction of a-domains.
The evolution with temperature of Raman spectra of PTO films shows that Raman modes of a- domains gradually evolve until the spectrum almost vanishes at 480 °C whereas modes in c-domains remain well defined up to 600 °C despite an anomaly in the spectrum evolution at 500 °C. This suggests a structural rearrangement at a temperature close to the bulk structural phase transition temperature. Let us finally note, neither the phase transition temperature. Let us finally note that neither the phase transition temperature nor the high temperature symmetry of epitaxial c/a PTO films can be determined from Raman spectra recorded on film surface in backscattering geometry, but that a cross section geometry, as in this work, should be used.
Acknowledgments: This work has been supported by the European network of excellence FAME and EGIDE.
References
[1] J.F. Scott, “The physics of ferroelectric ceramic thin films for memory applications”, Ferroelectrics Rev., vol. 1, no. 26, pp. 1–129, 1998.
[2] M. Okuyama and Y. Hamakawa, “Si-monolithic miniature ultrasonic sensor using PbTiO3 thin film prepared on a Si or SiO2 cantilever”, Sensor Mater.,vol. 1, pp. 13–24, Jan. 1988.
[3] J.F. Scott and C.A. Paz de Araujo, “Ferroelectric memories”, Science, vol. 246, pp. 1400-1405, Dec. 1989.
[4] D. Damjanovic, “Ferroelectric, dielectric and piezoelectric properties of ferroelectric thin films and ceramics”, Rep. Prog. Phys., vol. 61, pp. 1267-1324, May 1998.
[5] R. Ramesh, T. Sands, and V.G. Keramidas, “Effect of crystallographic orientation on ferroelectric properties of PbZr0.2Ti0.803 thin films”, Appl. Phys. Lett., vol. 63, no. 6, pp. 731-733, Aug. 1993.
[6] N.A. Pertsev, A.G. Zembilgotov, and A.K. Tagantsev, “Effect of mechanical boundary conditions on phase diagrams of epitaxial ferroelectric thin films”, Phys. Rev. Lett., vol. 80, no. 9, pp. 1988 – 1991, Mar. 1998.
[7] V.G. Koukhar, N.A. Pertsev, and R. Waser, “Thermodynamic theory of epitaxial ferroelectric thin films with dense domain structures”, Phys. Rev. B, vol. 64, pp. 214103-1–15, Nov. 2001.
[8] S.Y. Hu, Y.L. Li, and L.Q. Chen, “Effect of interfacial dislocations on ferroelectric phase stability and domain morphology in a thin film – a phase-field model”, J. Appl. Phys., vol. 94, no. 4, pp. 2542 – 2547, Aug. 2003.
[9] Y.L. Li, S.Y. Hu, Z.K. Liu, L.Q. Chen, “Phase-field model of domain structures in ferroelectric thin films”, Appl. Phys. Lett., vol. 78, pp. 3878-3880, Jun. 2001.
[10] J.S. Speck and W. Pompe, “Domain configurations due to multiple misfit relaxation mechanisms in epitaxial ferroelectric thin films. I. Theory”, J. Appl. Phys., vol. 76, no. 1, pp. 466- 476, Jul. 1994.
[11] C.S. Ganpule, V. Nagarajan, B.K. Hill, A.L. Roytbard, E.D. Williams, S.P. Alpay, A. Roelops, R. Waser, and L.M. Eng, “Imaging three-dimensional polarization in epitaxial polydomain ferroelectric thin films”, J. Appl. Phys., vol. 91, no. 3, pp. 1477-1481, Feb. 2002.
[12] Q. Ma and D.R. Clarke, “Stress Measurement in Single-Crystal and Polycrystalline Ceramics Using Their Optical Fluorescence”, J. Am. Ceram. Soc., vol. 76, no. 6, pp. 1433-1440, June 1993.
[13] E. Ching-Prado, A. Reynes-Figueroa, R.S. Katiyar, S.B. Majimder, and D.C. Agrawal, “Raman spectroscopy and X-ray diffraction of PbTiO3 thin films”, J. Appl. Phys., vol. 78, no. 3, pp. 1920- 1925, Aug. 1995.
[14] C.C. Li and S.B. Desu, “Raman spectroscopy and X-ray diffraction of PbTiO3 thin film”, J. Vac.
Sci. Technol. A, vol. 14, no. 1, pp. 13-21, Jan. 1996.
[15] J.H.L. Voncken, C. Lijzenga, K.P. Kumcer, K. Kiezer, A.J. Burggraaf, and B.C. Benekamp,
“New method for the measurement of stress in thin drying gel layers, produced during the formation of ceramic membranes”, J. Mater. Sci., vol. 27, no. 2, pp. 472-478, Jan. 1992.
[16] S.S. Sengupta, S.M. Park, D.A. Payne, and L.H. Allen, “Origins and evolution of stress development in sol-gel derived thin layers and multideposited coatings of lead titanate”, J. Appl.
Phys., vol. 83, no. 4, pp. 2291-2296, Feb. 1998.
[17] D. Valim, A.G. Sauza Filho, P.T.C. Freire, J. Mendes Filho, C.A. Guavany, R.N. Reispaud, and E.B. Araujo, “Evaluating the residual stress in PbTiO3 thin films prepared by a polymeric chemical method”, J. Phys. D: Appl. Phys., vol. 37, pp. 744-747, Feb. 2004.
[18] J.A. Sanjurjo, E. Lopez-Cruz, and G. Burns, “High-pressure Raman study of zone-center phononos in PbTiO3”, Phys. Rev. B, vol. 28, no. 12, pp. 7260-7268, Dec. 1983.
[19] F. Cerdeira, W.B. Holzapfel, and D. Bauerle, “Effect of pressure on the zone-center phonons of PbTiO3 and on the ferroelectric-paraelectric phase transition”, Phys. Rev. B, vol. 11, no. 3, pp.1188- 1192, Feb. 1975.
[20] D. Fu, T. Ogawa, H. Suzuki, and K. Ishikawa, “Thickness dependence of stress in lead titanate thin films deposited on Pt-coated Si”, Appl. Phys. Lett., vol. 77, no. 10, pp. 1532-1534, Sept. 2000.
[21] A.-D. Li, D. Wu, C.-Z. Ge, P. Lu, W.-H. Ma, M.-S. Zhang, C.-Y. Xu, J. Zuo, and N.-B. Ming,
“Raman spectroscopy and X-ray diffraction study of PbTiO3 thin films prepared by sol-gel technique”, J. Appl. Phys., vol. 85, no. 4, pp. 2146-2150, Feb. 1999.
[22] P.S. Dobal, S. Bhaskar, S.B. Majamder, and R.S. Katiyar, “Micro-Raman investigation of stress variations in lead titanate films on sapphire”, J. Appl. Phys., vol. 86, no. 2, pp. 828-834, Jul. 1999.
[23] L. Sun, Y.F. Chen, L. He, C.Z. Ge, D.S. Ding, T. Yu, M.-S. Zhang, and N.B. Ming, ”Phonon- mode hardening in epitaxial PbTiO3 ferroelectric thin films”, Phys. Rev. B, vol. 55, no. 18, pp.
12218-12222, May 1997.
[24] S.-H. Lee, H.M. Jang, S.M. Cho, and G.-C. Yi, “Polarized Raman scattering of epitaxial PbTiO3 thin film with coexisting c and a domains”, Appl. Phys. Lett., vol. 80, no. 17, pp. 3165-3167, Apr.
2002.
[25] H. Zheng, J. Kreisel, Y.H. Chu, R. Ramesh, and L. Salamanca-Riba, “Heteroepitaxially enhanced magnetic anisotropy in BatiO3-CoFe2O4 nanostructures”, Appl. Phys. Lett., vol. 90, pp.
113113 1-3, Mar. 2007.
[26] I.A. Kornev, L. Bellaiche, P. Bouvier, P.E. Janolin, B. Dkhil, and J. Kreisel, “Ferroelectricity of perovskites under Pressure”, Phys. Rev. Lett., vol. 95, pp.196804 1-4, Nov. 2005.
[27] I.A. Kornev and L. Bellaiche, “The nature of ferroelectricity under pressure”, Phase Transitions, vol. 80, no. 4, pp. 385-413, Apr. 2007.
[28] G.A. Samara and E.L. Venturini, “Ferroelectric/relaxor crossover in compositionally disordered perovksites”, Phase transitions, vol. 79, no. 1-2, pp. 21-40, Jan. 2006.
[29] G. Burns and B.A. Scott, “Raman studies of underdamped soft modes in PbTiO3”, Phys. Rev.
Lett., vol. 25, no. 3, pp.167 – 170, Jul. 1970.
[30] N. Sicron, B. Ravel, Y. Yacoby, E.A. Stern, F. Dogan, and J.J. Rehr, “Nature of the ferroelectric phase transition in PbTiO3”, Phys. Rev. B, vol. 50, no. 18, pp. 13168-13180, Nov. 1994.
[31] M.D. Fontana, H. Idrissi, G.E. Kugel, and K. Wojcik, “Raman spectrum in PbTiO3 re-examined:
dynamics of the soft phonon and the central peak”, J. Phys.: Condens. Matter, vol. 3, pp. 8695-8705, Jun. 1991.
[32] J.P. Sénateur, F. Weiss, O. Thomas, R. Madar, and A. Abrutis, “Procédé et dispositif d’introduction de précurseurs dans une enceinte de dépot chimique en phase vapeur” Patent FR2707671 (1993), PCT FR94/00858 (1994), US5945162 (1999), Eu EP730671 (1996).
[33] J.P. Sénateur, A. Abrutis, F. Felten, F. Weiss, O. Thomas, and R. Madar, In “Advances In Inorganic Films and Coatings”, P. Vincenzin, Ed. Florence, Italy: Techna srl., 1995, 71-105.
[34] J.P. Sénateur, C. Dubourdieu, V. Galindo, F. Weiss, and A. Abrutis, in “Innovative processing of films and nanocrystalline powders”, K.-L. Choy, Ed. London: Imperial College Press, 2002, pp.
71-105.
[35] A. Bartasyte, A. Abrutis, C. Jimenez, F. Weiss, O. Chaix-Pluchery, and Z. Saltyte,
“Ferroelectric PbTiO3 films grown by pulsed liquid injection metalorganic chemical vapour deposition”, Ferroelectrics, vol. 353, no. 1, pp. 104-115, Jun. 2007.
[36] A. Bartasyte, R. Bouregba, E. Dogheche, M. Boudard, G. Poullain, C. Jimenez, V.
Plausinaitiene, D. Remiens, A. Abrutis, F. Weiss, O. Chaix–Pluchery, and Z. Saltyte, “Ferroelectric PbTiO3 films grown by pulsed liquid injection MOCVD”, J. Surf. Coat. Technol., vol. 201, pp. 9340 – 9344, May 2007.
[37] A. Bartasyte, O. Chaix-Pluchery, J. Kreisel, M. Boudard, C. Jimenez, A. Abrutis, Z. Saltyte, and F. Weiss, “Investigation of thickness-dependent stress in PbTiO3 thin films”, J. Appl. Phys, vol. 103, pp. 014103 1-8, Jan. 2008.
[38] R.J. Briggs and A.K. Ramdas, “ Piezospectroscopic study of Raman spectrum of cadmium sulfide”, Phys. Rev. B, vol. 13, no. 12, pp. 5518 – 5529, Jun. 1976.
[39] M. Osada, K. Nishida, S. Wada, and T. Katoda, “Domains distributions in tetragonal Pb(Zr,Ti)O3 thin films probed by polarized Raman spectroscopy”, Appl. Phys. Lett., vol. 87, pp.
232902 1-3, Nov. 2005.
[40] R. Comès, M. Lambert, and A. Guinier, “The chain structure of BaTiO3 and KNbO3”, Solid State Commun., vol. 6, no. 10, pp. 715-719, Oct. 1968.
Figure captions
Fig.1: (a) X-ray diffraction omega-2 theta mapping near the (103) and (301)/(310) PTO /LAO peaks.
Omega-chi contour maps of (b) c-domain (003) reflection, and (c) a-domain (300) reflection.
Fig. 2: Film thickness dependence of the PTO c lattice parameter in c-domains.
Fig. 3: Raman scattering geometries and polarization configurations used for the Raman mode assignment in a- and c-domain PTO/LAO films.
Fig.4: Polarized Raman spectra of PTO/LAO films recorded in parallel and crossed polarization configurations on the film surface and on the film cross section.
Fig. 5: Evolution of the A1(2TO) and A1(3TO) modes as a function of PTO/LAO film thickness. The a- and c-components of each A1(TO) mode refer to modes coming from a- and c-domains, respectively. The volume fraction of a-domains (%) is given in the figure for each film thickness.
Fig. 6: Temperature dependence of the VH Raman spectra related to a- and c-domains in a 250 nm thick PTO/LAO film.
Fig. 7: Evolution in wavenumber of the E(2TO) mode in a- and c-domains as a function of temperature in a 250 nm thick PTO/LAO film.
Tables
Table 1: TO-LO assignment of the A1 and E modes.
Table 2: X-ray characterization of PTO/LAO films of different thicknesses comprised in the range 30-460 nm.
Film thickness (nm) 460 250 125 65 30
Twinning angle of a-domains (˚) 2.36 2.4 2.42 - - Twinning angle of c-domains (˚) 0.69 0.50 0.33 0 0 Volume fraction of a-domains (%) 4.7 14.4 19.4 9.0 -*
* Undetermined due to very low peak intensities Phonon assignment Propagation
direction E(x) E(y) A1(z)
x LO TO TO
y TO LO TO
z TO TO LO
Table 3: E(3TO) phonon wavenumbers and residual stress values estimated from E(3TO) mode wavenumber and XRD data in PTO/LAO films of different thicknesses comprised in the range
30-460 nm.
w(E(3TO)) (cm-1) Residual stress in c-domains (GPa) Thickness (nm) a-domains c-domains E(3TO) XRD [37]
460 500.8 503.2 0.45 ± 0.07 0.40 ± 0.06
250 499.4 502 0.59 ± 0.10 0.58 ± 0.08
125 498 501.2 0.70 ± 0.11 0.79 ± 0.11
65 - 499.7 0.88 ± 0.14 1.00 ± 0.14
30 - 496.9 1.30 ± 0.21 1.02 ± 0.15
Fig. 1
Fig. 2
Fig. 3
Fig. 4
Fig. 5
Fig. 6
Fig. 7