Many thanks to the folks at the Nakamura lab and Mizuki san for their work on the cryogenic target. Thank you to Sandra, Doris and Ben for their support. You are all wonderful people who I am happy to meet and I wish you all the best for the future.
Physics of light neutron-rich nuclei near the drip-line
- Shell closure breakdown
- Clusters
- Halos
- Neutron-rich Helium isotopes
The case of neutron-rich Helium isotopes provides an illustration of the aforementioned phenomena. Extensive study of helium isotopes has been carried out by shadowing light on neutron interaction in nuclear matter.
![Figure 1.2: Ground-state matter density distribution in Boron isotopes from [KH01].](https://thumb-eu.123doks.com/thumbv2/1bibliocom/463484.69240/12.892.274.580.237.716/figure-ground-state-matter-density-distribution-boron-isotopes.webp)
Theoretical approaches
Three-body models
We note that in the framework of this model, 11Li represents a favorable initial state to populate the predicted ground state due to their similar structure.
Ab initio approaches
Quantum Chromodynamics (QCD) is the fundamental theory describing the strong interaction responsible for the nucleon-nucleon interaction. Ab initio approaches are based on a Yukawa-like model [Yuk35] in which the nucleon-nucleon interaction is described in terms of meson exchanges.
![Figure 1.6: GFMC result from [Pie05] are compared to experimental spectroscopy (green) of light nuclei using two-body av18 interaction only (blue) and using addi-tional Illinois-2 three-body interaction.](https://thumb-eu.123doks.com/thumbv2/1bibliocom/463484.69240/17.892.160.777.184.639/figure-result-compared-experimental-spectroscopy-interaction-illinois-interaction.webp)
The 10 He spectroscopy
Double charge exchange reaction
Within experimental uncertainties, the shape of the obtained relative energy spectrum of the 8He+n+n system from the 1H(11Li,8He+n+n) is identical to that of [KYA+94]. A preliminary spectrum shows a significant number of counts in the 0-3 MeV region of the missing mass spectrum.
![Figure 1.8: Excitation spectra of 10 He from double charge exchange reaction [OBG + 94] obtain after subtraction of all the physical background](https://thumb-eu.123doks.com/thumbv2/1bibliocom/463484.69240/20.892.444.751.243.461/figure-excitation-spectra-exchange-reaction-subtraction-physical-background.webp)
Proposed approach
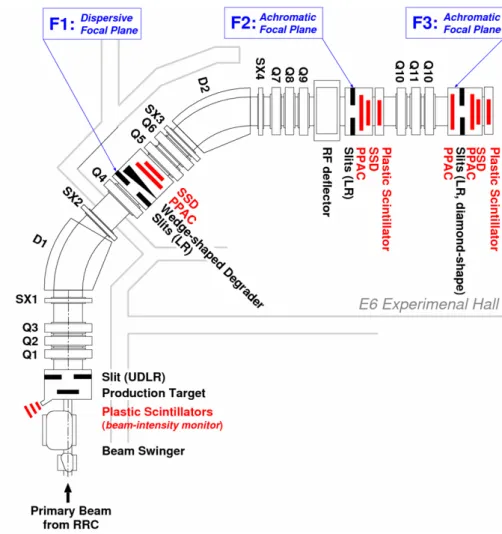
The main goal was the production and study of the 10He resonances by the 11Li(d,3He) transfer reaction. The fragmentation produced a cocktail of very stable and unstable nuclei, the purification of the bundle was performed by the RIPS fragment separator.

Beam tracking Device
Reaction targets
Reaction chamber
The detection
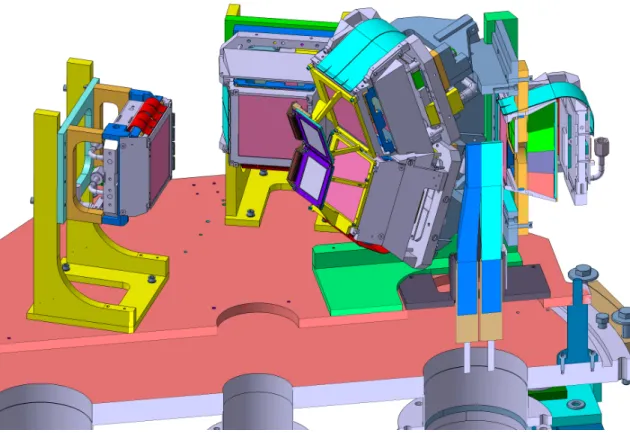
The MUST2 detector
A schematic of the electronic logic connection of the MUST2 detection can be found in App.C. The aluminum frame was held in front of the DSSD using screws directly into the telescope frame.
Plastic detectors
Because the detector offers half the detection surface of the MUST2 DSSD, they were deported by 65 mm towards the target as shown in Fig.2.9. Therefore, almost the entire surface of the MUST2 DSSD could be used with the SSSD.
Electronics and data acquisition
The design of the mechanism holding the two plastic detectors was slightly complicated by the high density of detectors around zero degrees as illustrated in Fig.2.10. The thickness of the detector was 20 mm for the first stage and 30 mm for the second stage and covered an active area of 70 mm by 40 mm in front of the zero degree telescope.
Detectors position measurement
First, the preceding experiment simulations, which aim to define the feasibility and performances of the experimental setup. A GEANT4-based simulation of the MUST2 array, as well as the other γ and particle detectors was used for the first time [Ram09].
Prior-experiment simulations
- Building the setup
- Angular coverage
- Study around the target
- Particles identification
- Background evaluation
Therefore, for the extraction of the relevant information about the structure of 10He, we focus on the small angles in the center of mass frame. Most of the statistics are below 22 MeV, which means the 3He stops in the first phase of MUST2. The peak visible around 47◦ in the particle angle distribution in Fig.3.6 and Fig.3.7 corresponds to the reversal of the kinematic line.

Post-experiment simulations
Resolution and efficiency
The error bars can be reduced by using more statistics, but the runtime as well as the volume of the generated file are limitations. The more bodies the phase space involves, the more the weight of each configuration is small, and the more the need for statistics is high.
Solid angle
Each time a specific case was identified, a diagnostic method was implemented and a solution was found within the same software that handles the remaining channels. We will discuss MUST2 and SSSD detector calibration and particle identification. In the last part of the chapter, the extraction of the excitation energy and the angular distribution, which contains information about the structure, will be discussed.
Beam particles identification
The main pollutant, 3H, is not visible due to the low energy loss in the PPAC and Plastic.
PPAC Beam Tracking Detector
Calibration and efficiency
Beam Tracking
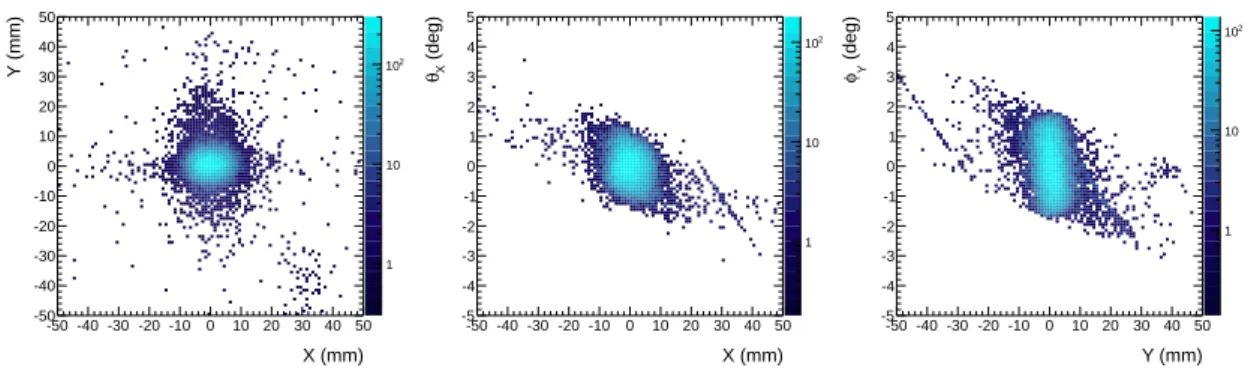
The 11Li distribution is much wider than the 9Li distribution, because in the former case full acceptance of the RIPS line is used, while in the latter case narrow slits are used. The first excitation energy spectra obtained using the initial PPAC parameters led to peak widths that were inconsistent with the simulations. To check the validity of the trajectory reconstruction, we first used the image of the target frame.
MUST2 Telescopes
- Energy Calibration
- Time Calibration
- CsI Calibration
- Event Selection
- Energy Calibration
- Thickness measurement and correction
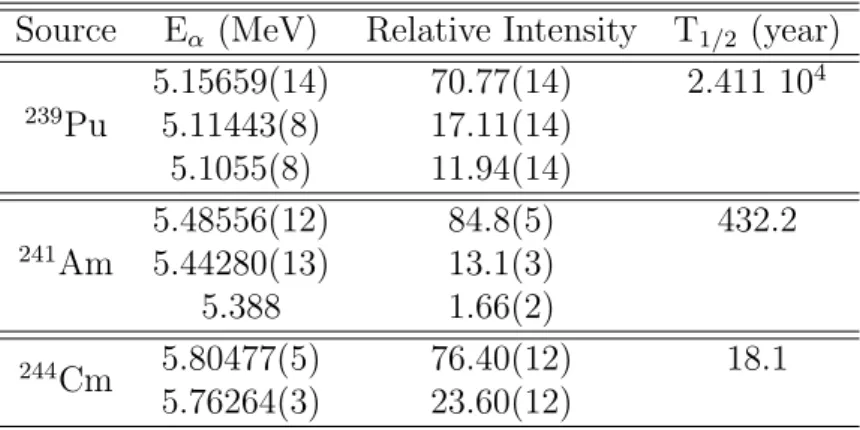
The latter gives a 430 ps FWHM resolution for the electronics, within MUST2 TDC specifications. A typical 5 to 10 strips were disabled, mostly on the exposed front sides of the silicon detector. The range of α particles from the source listed in Table 4.4 exceeds the thickness of the detectors.
Particle Identification
- E-∆E identification
- E-TOF identification
- Multi-variables analysis
- Zero degrees telescope
- Zero degrees plastic detectors
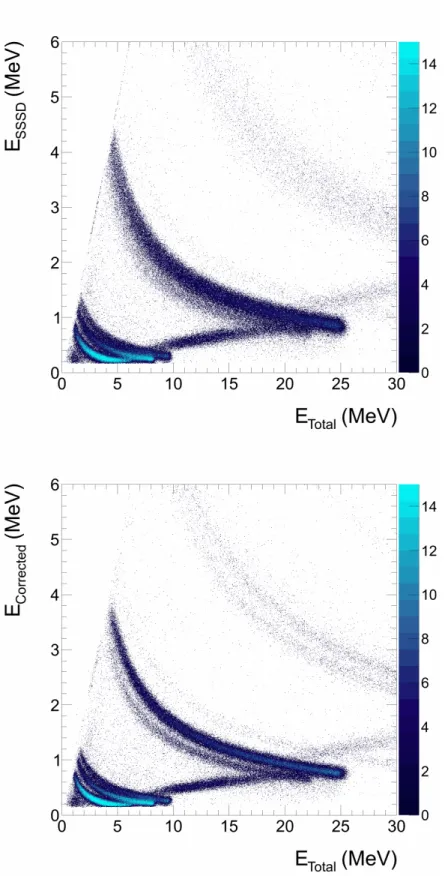
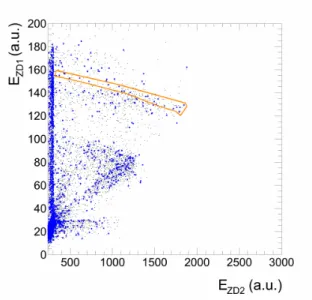
The significant inhomogeneities of the SSSD detector severely limit particle separation, as shown in Figure 4.16 (top). 3He are separated from 3H and 4He due to different energy losses in the SSSD that change their time of flight differently. This identification is powerful enough to remove any halo beam contribution in the identification spectrum shown in Fig. 4.20.
Extracting the observables of interest
Excitation Energy
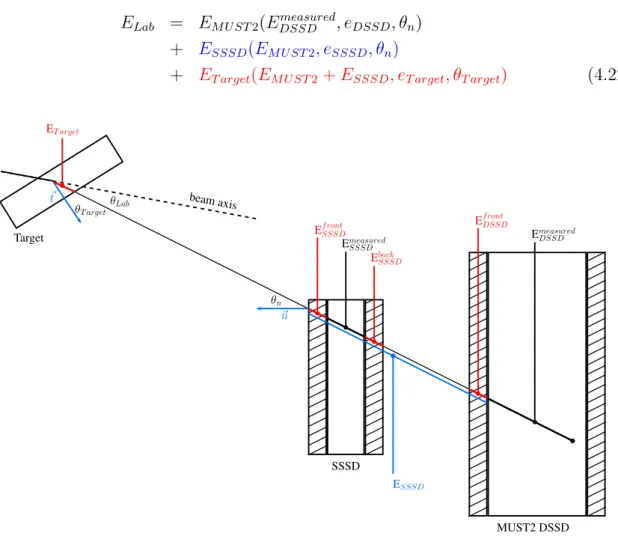
In the case of an unbound nucleus B, the reference energy of the system mmB gs can be defined in different ways. TA+Tb−2TATbcos(θLab) (4.19) With the measured Tb and θLab one can now calculate the excitation energy of the studied nuclei. As expressed in Eq.(4.21), the correction term depends on the energy of the particle as it crosses the non-sensitive material.
Angular Distribution
Conclusion
- The Born Approximation
- Transition potential
- Zero Range approximation
- Form factor
- Optical potential
Taβ is the transition amplitude associated with the reaction, depending on the spin projections of the particles Ma and Mβ. We can then write the transition amplitude (Eq.5.6) as:. Vβ − Uβ) now controls the transition amplitude. In the case of the (d,3He) reaction, the nucleus is a deuterium, denoted d andb an3He. It is known that changing the value of r0 induces variation of the calculated cross-section.
Results for elastic and inelastic scattering
Energy Spectra
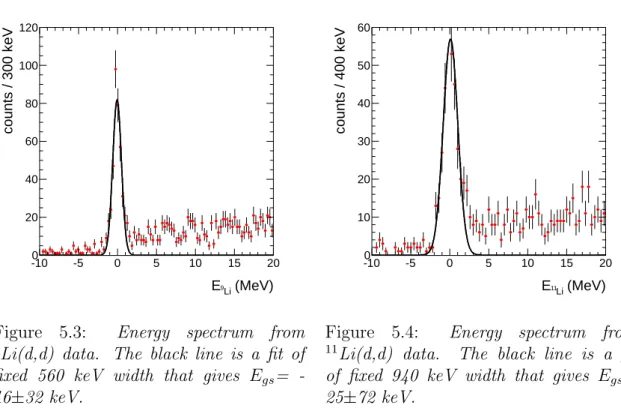
A strong background is seen at low energies where the TOF identification of 2H is no longer effective for separating from 1H and 3H. The excellent matching of the baseline positions is an indication of the correctness of the set target thickness, 1.9 mg/cm2. Coincidence with heavy particles around zero degrees plays an important role, as shown in Figure 5.5, which shows the inclusion spectrum.
Differential cross-section
Results for the one-proton transfer reaction (d, 3 He)
Excitation Energy
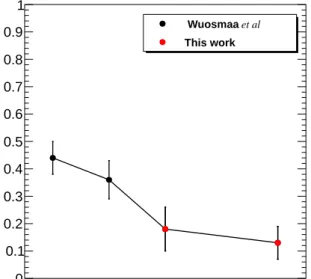
The superposition of the normalized spectrum on the carbon target and the 10He spectrum is shown in Fig.5.16. Clearly, the contribution of the carbon from the CD2 target does not explain the observed structure. Once normalized, the two spectra can be superimposed to get an idea of the contribution.
Differential cross-sections
Therefore, the extraction of the spectroscopic factor is performed by a minimization procedure with the points of the first maximum. The radius of the shape factor used in the DWBA calculation is not well known in the case of (d,3He) reactions. The radius of the shape factor Rf f significantly affects the value of the spectroscopic factor.
Excited states of 10 He
The spectroscopic factor is meaningful for the Rf f value and is the main contribution of the error bars is the evaluation of its value.
Discussion
No evidence was found in favor of the predicted narrow resonance near the 8He+n+n threshold. The role played by the 9Li nucleus in the binding mechanism of the neutron halo is expressed here. Taking advantage of the high 14Be beam velocity now available at RIKEN/RIBF, states in 10He can be populated with the 14Be(p,pα) reaction.
Methodology
The simulation (see chapter 3) initially aimed to define the best setup for the current experiment. Today's and tomorrow's challenge in nuclear physics is dealing with complicated setup and a large number of channels. Nuclear physics experiments tend to look at more and more exotic physics cases which lead us to have more and more complex setup and strong physical background.
Version control
NPTool was developed in the same spirit as many projects of High Energy Physics, and more generally, free software. NPTool is distributed under the General Public License version 3 (GPLv3) and the project can be freely copied, distributed and modified.
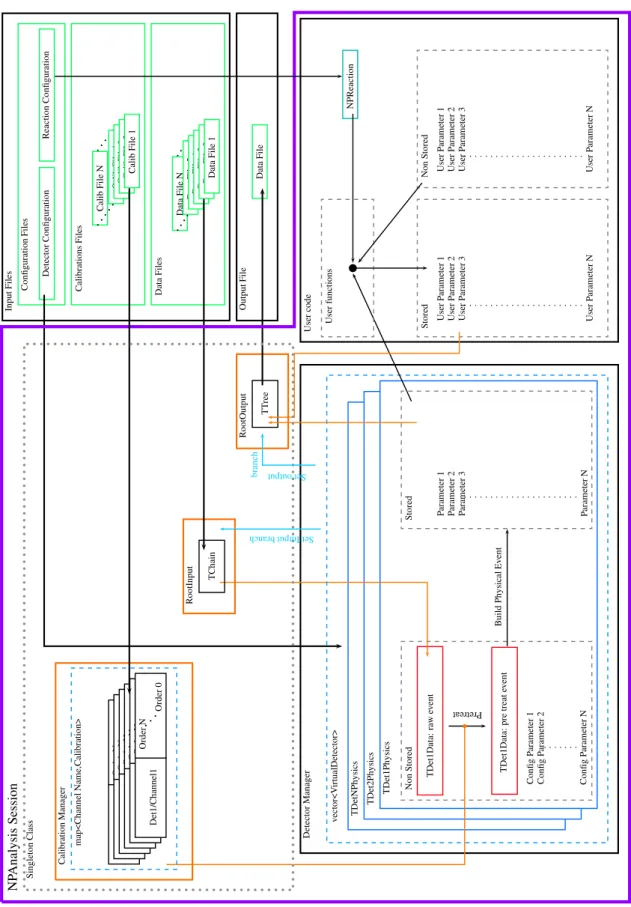
NPlibrary
Physics tool: NPNucleus, NPReaction, NPEnergyLoss
A method, KineRelativistic, that allows the calculation of the laboratory angles and energies of the exiting particles, giving the center of mass angle, is used for simulation purposes. On the other hand, the relativistic reconstruction method that allows to deduce the excitation energy of the nuclei of interest using as input the laboratory angle and the energy of other nuclei is used for analysis purposes. Finally, the class allows to estimate the initial energy using ∆E and the material thickness e: using a dichotomous algorithm, the trial energy ET of the particle is tested until the companion ∆ET matches ∆E.
Handling tool: VDetector, DetectorManager, Calibration-
Designed to handle the dE/dx energy loss table and perform various calculations, this class finds use in every phase of the experiment. It has been successfully used in the fully automatic MUST2 DSSD calibration algorithm (see Section 4.4.1) to evaluate the energy loss of α particles in the dead layer or in the NPAnalysis project to correct the energy loss in the target. The program used a cutting algorithm that performed the calculation on the infinitesimal path of the particle and the interpolation of the dE/dx(E) function.
NPSimulation
InitializeScorers Scorers are readout objects that store information about particle interactions in the associated volume. The output of the simulation is an experimental file that can be analyzed like any experimental data. NPSimulation is currently being used in several laboratories around the world to work on the prospects for future detectors such as GASPARD and in preparation for upcoming experiments.
NPAnalysis
Perspective
The angular distribution of the transfer reaction carried information about the wave function of the transferred particles. Moreover, the contribution from the discarded space is generally not negligible, even for closed shell cores. Ishihara, Low-lying penetrating mode in 12be and the melting of the n=8 shell closure, Physics Letters B491(2000), no.
![Figure 1.5: Level predicted by Aoyama in [Aoy03] for 10 He and 11 Li.](https://thumb-eu.123doks.com/thumbv2/1bibliocom/463484.69240/16.892.233.635.391.646/figure-level-predicted-aoyama-aoy03-10-11-li.webp)
![Figure 1.9: Proton seration energy spectra leading to resonant structure of 10 He from (p,2p) experiment (top and bottom right quadrant) and other light nuclei from [KYO + 97]](https://thumb-eu.123doks.com/thumbv2/1bibliocom/463484.69240/20.892.171.677.777.1034/figure-proton-seration-spectra-resonant-structure-experiment-quadrant.webp)
![Figure 1.10: Excitation spectra of 10 He ,from [JAA + 10b] ,interpreted as a narrow resonance at 1.42 MeV (dashed line) and a correlated background (dotted line).](https://thumb-eu.123doks.com/thumbv2/1bibliocom/463484.69240/21.892.480.792.601.896/figure-excitation-spectra-interpreted-narrow-resonance-correlated-background.webp)