HAL Id: hal-01555552
https://hal.inria.fr/hal-01555552
Submitted on 4 Jul 2017
HAL
is a multi-disciplinary open access archive for the deposit and dissemination of sci- entific research documents, whether they are pub- lished or not. The documents may come from teaching and research institutions in France or abroad, or from public or private research centers.
L’archive ouverte pluridisciplinaire
HAL, estdestinée au dépôt et à la diffusion de documents scientifiques de niveau recherche, publiés ou non, émanant des établissements d’enseignement et de recherche français ou étrangers, des laboratoires publics ou privés.
Distributed under a Creative Commons
Attribution| 4.0 International LicenseVScope: Middleware for Troubleshooting Time-Sensitive Data Center Applications
Chengwei Wang, Infantdani Abel Rayan, Greg Eisenhauer, Karsten Schwan, Vanish Talwar, Matthew Wolf, Chad Huneycutt
To cite this version:
Chengwei Wang, Infantdani Abel Rayan, Greg Eisenhauer, Karsten Schwan, Vanish Talwar, et al..
VScope: Middleware for Troubleshooting Time-Sensitive Data Center Applications. 13th Interna- tional Middleware Conference (MIDDLEWARE), Dec 2012, Montreal, QC, Canada. pp.121-141,
�10.1007/978-3-642-35170-9_7�. �hal-01555552�
Time-Sensitive Data Center Applications
Chengwei Wang, Infantdani Abel Rayan+, Greg Eisenhauer, Karsten Schwan, Vanish Talwar∗, Matthew Wolf, Chad Huneycutt
Georgia Institute of Technology∗HP Labs+Riot Games
Abstract. Data-Intensive infrastructures are increasingly used for on- line processing of live data to guide operations and decision making.
VScope is a flexible monitoring and analysis middleware for troubleshoot- ing such large-scale, time-sensitive, multi-tier applications. With VScope, lightweight anomaly detection and interaction tracking methods can be run continuously throughout an application’s execution. The runtime events generated by these methods can then initiate more detailed and heavier weight analyses which are dynamically deployed in the places where they may be most likely fruitful for root cause diagnosis and mit- igation. We comprehensively evaluate VScope prototype in a virtualized data center environment with over 1000 virtual machines (VMs), and apply VScope to a representative on-line log processing application. Ex- perimental results show that VScope can deploy and operate a variety of on-line analytics functions and metrics with a few seconds at large scale.
Compared to traditional logging approaches, VScope based troubleshoot- ing has substantially lower perturbation and generates much smaller log data volumes. It can also resolve complex cross-tier or cross-software-level issues unsolvable solely by application-level or per-tier mechanisms.
Keywords: Cloud, Data Center, Management, Troubleshooting
1 Introduction
In the ‘big data’ era, live data analysis applications are becoming easy to scale, as well as being lucrative for or even critical to a company’s operation. For instance, by continuously analyzing the live number of page views on its products, an e- commerce website can run a dynamic micro-promotion strategy in which when over 3000 customers are looking at a product for over 10 seconds, an extra 20% discount appears on the web page to increase sales. Other mission-critical examples for e-commerce sites are click fraud and spam detection.
The importance of live data analysis is underscored by the recent creation of real-time or ‘streaming’ big data infrastructures1, which include Flume, S4, Storm, Chukwa, and others [5, 28, 25, 29, 11, 23, 15]. Conceptually, these are based
1 In this paper we use the term ‘real-time’ to refer a latency restriction within seconds or hundreds of milliseconds.
Fig. 1.A typical real-time web log analysis application composed from Flume, HBase, HDFS, and Hadoop. In Flume,agents reside in web or application servers, collecting logs and converting them into key-value pairs.Collectorsreceive and aggregate the local results and insert them into HBase, a distributed, scalable key-value store by which users can query the analysis results on-the-fly. HBase consists ofregion serversthat are equipped with a memory cache, termed MemStore, and a Write Ahead Log (WAL).
The data are first written to the WAL and MemStore before being asynchronously persisted to the back-end distributed file system, HDFS, which is typically shared by other data-intensive batch systems, such as Hadoop-based MapReduce codes used for off-line, long-term analyses. Each tier can scale to 1000s of servers or virtual machines.
on the well-established paradigm of stream- or event-based processing [16, 2, 1], but their attractiveness stems from the fact that they can be easily integrated with other elements of ‘big data’ infrastructures, such as scalable key-value stores and MapReduce systems, to construct multi-tier platforms spanning thousands of servers or consolidated virtual servers in data centers. A sample platform integrating Flume and other data-intensive systems is depicted in Figure 1.
Crucial to maintaining high availability and performance for these multi-tier applications, particularly in light of their stringent end-to-end timing require- ments, is responsive troubleshooting – a process involving the timely detection and diagnosis of performance issues. Such troubleshooting is notoriously difficult, however, for the following reasons:
– Holistic vs. tier-specific troubleshooting.As illustrated in Figure 1, each tier is typically a complex distributed system with its own management compo- nent, e.g. HBase or Flume masters. Developed by different vendors and/or managed by different operation teams, tier-specific management can improve the availability of individual tiers, but is not sufficient for maintaining an en- tire application’s end-to-end performance, a simple reason being that issues visible in one tier may actually be caused by problems located in another.
Needed are holistic systems to efficiently track problems across tiers.
– Dynamic, per-problem functionality. Problems in complex, large-scale sys- tems arise dynamically, and for each class of problems, there may be differ- ent detection, analysis, and resolution methods. Troubleshooting, therefore, is an inherently dynamic activity, involving on-line capabilities to capture differing metrics and to diagnose/analyze them with potentially problem- and situation-specific methods[36].
– Scalable, responsive problem resolution.In latency-sensitive applications like the one in Figure 1, to maintain desired timing, troubleshooting must be conducted both with low perturbation and with high responsiveness: issues must be detected, diagnosed, and repaired without missing too many events and while maintaining availability for other ongoing actions.
– System-level effects. Holistic troubleshooting must extend beyond a single application, to also identify the system-level bottlenecks that can arise in today’s consolidated data center or cloud computing systems.
Previous troubleshooting systems have not addressed all of these challenges.
Solutions that monitor ‘everything all the time’ [26, 39, 27], including both appli-
10 100 1000
HDFS (16/122)
Flume (95/122)
HBase (5/122)
All (122/122)
Slowdown%(logscale base 10)
Tier Name(# of nodes per tier/total # of nodes)
Fig. 2. E2E performance slowdown (i.e. latency increase) % caused by debug-level logging at dif- ferent tiers of the architecture shown in Figure 1.
cation and system-level events, do not scale for detailed diag- nostics via say, debug-level log- ging or tracing with consequent high levels of perturbation. This is shown in Figure 2, where con- tinuously logging application- level debugging events on all of its nodes slows down an appli- cation’s performance by more than 10 times over the base- line. Sampling [30, 31, 14, 7] for some of the components and/or for some period of time may not only miss important events, affecting troubleshooting effec-
tiveness, but will also bring about serious performance issues when using a homogeneous and/or random sampling strategy across all nodes, e.g., with Dap- per [31]’s use of a uniform, low (1/1000) sampling rate. In Figure 2, debug-level logging in the Flume application’s HBase tier, the smallest portion of the system (5/122 VMs), results in over 10 times slowdown, which is more than an order of magnitude of the perturbation imposed by debug-level logging in the Flume tier, which has the majority of nodes (95/122). Thus, it is inadvisable to use a high sampling rate for the HBase tier, whereas such a strategy for the Flume tier will likely lead to only modest additional perturbation. An alternative troubleshoot- ing approach chosen by GWP [30] is to randomly pick some set of machines. This may work well if that set is in the HDFS tier, but will be prohibitively costly if the HBase tier is picked. Other approaches, like those taken by Fay [14] and Chopstix [7] to set sampling rates based on the event population, still remain
unaware of application level perturbation, resulting in the same issue as the one faced by GWP. We, therefore, conclude thata more flexible system is needed for efficient troubleshooting, where methods can differ for each behavior, tier, and type of analysis being performed.
The VScope middleware presented in this paper makes it possible (1) to ad- just and tune troubleshooting dynamically – at runtime – for individual tiers and across tiers, (2) to dynamically deploy any analysis action(s) needed to under- stand the metric data being captured in the ways required by such troubleshoot- ing, and (3) to do so in ways that meet the perturbation/overhead requirements of target applications. To achieve those ends, VScope, as a flexible monitoring and analysis system, offers the following novel abstractions and mechanisms for troubleshooting latency-sensitive, multi-tier data center applications:
1. Dynamic Watch, Scope, and Query. VScope abstracts troubleshooting as a process involving repeatedWatch, Scope, andQuery operations. Respec- tively, these (i) detect performance anomalies, (ii) ‘zoom-in’ to candidate problematic groups of components or nodes, and (iii) answer detailed ques- tions about those components or nodes using dynamically deployed monitor- ing or analysis functions. VScope can operate on any set of nodes or software components and thus, can be applied within a tier, across multiple tiers, and across different software levels.
2. Guidance.Replacing the current manual ‘problem ticket’ mechanisms used in industry, VScope based troubleshooting is directed by on-line ‘guidance’, realized by theWatchandScopeoperations that first detect abnormal behav- ior, followed by exploring candidate sources for such behavior, and only then initiate more detailed queries on select entities. The current implementations ofWatch and Scope support both ‘horizontal guidance’, to track potential problems across different tiers of a multi-tier application, and ‘vertical guid- ance’, to understand whether problems are caused by how applications are mapped to underlying machines.
3. Distributed Processing Graphs (DPGs).All VScope operations are realized by DPGs, which are overlay networks capable of being dynamically deployed and reconfigured on any set of machines or processes, supporting various types of topologies and analysis functionalities. First introduced in our pre- vious work [36], where we proposed the basic architecture of DPGs and inves- tigated an impact model of metric number/size and various DPG topologies, along with other factors, this paper presents DPG implementation, APIs, and commands, based on which we build VScope’s troubleshooting functionality.
VScope’s capabilities and performance are evaluated on a testbed with over 1000 virtual machines (VMs). Experimental results show the VScope runtime negligi- bly perturbs system and application performance, and requires mere seconds to deploy 1000 node DPGs of varying topologies. This results in fast operation for on-line queries able to use a comprehensive set of application to system/platform level metrics and a variety of representative analytics functions. When support- ing algorithms with high computation complexity, VScope serves as a ‘thin layer’
that occupies no more than 5% of their total latency. Further, by using guidance
that correlates system- and application-level metrics, VScope can locate prob- lematic VMs that cannot be found via solely application-level monitoring, and in one of the use cases explored in the paper, it operates with levels of perturba- tion of over 400% less than what is seen for brute-force and most sampling-based approaches.
2 System Design and Implementation
2.1 Goals and Non-Goals
The design of VScope is driven by the following goals: (1) flexibility: to initi- ate, change, and stop monitoring and analysis on any set of nodes at any time, supported by operators for dynamically building and controlling user-defined actions for runtime troubleshooting; (2) guided operation: programmable meth- ods for detecting potential problems and then tracking interactions that may contribute to them, between tiers and across software levels, thereby focusing troubleshooting in ways that can reduce overheads and improve effectiveness;
and (3)responsiveness and scalability: to deploy troubleshooting methods with low delay at scales of 1000+ nodes.
VScope is designed to be a general platform rather than a set of ad hoc analysis algorithms/solutions. VScope does not replace operator involvement, but aims to facilitate their troubleshooting efforts. Further, while VScope may be used to seek the root causes of failures, its current implementation lacks functionality like an off-line diagnostic database and a rich infrastructure for determining and using decision trees or similar diagnostic techniques. Also, the methods presently implemented in VScope focus on persistent performance prob- lems that will likely render an application inoperable after some time, i.e., when there are frequent or repeated violations of certain performance indicators that persist if they are not addressed. Having determined potential sources of such problems, VScope can then trigger certain actions for mitigation or recovery, but it assumes such functionality to be supported by other subsystems (e.g., inher- ent to specific applications/tiers or software levels) or housed in some external system for problem resolution [9].
2.2 VScope Overview
The system architecture of VScope is depicted in Figure 3(a). The machines (VMs or physical machines) in the target application are managed by a server called VMaster. Operators use VScope operations, DPG commands, or scripts with the DPG API, in a console called VShell provided byVMaster.VMaster executes those commands by deploying DPGs on requested machines to process their monitoring metrics, and it returns results to operators. In detail, it starts a DPGManager to create a new DPG, which essentially, is an overlay network consisting of processing entities namedVNodesresiding on application machines.
The DPGManager dynamically deploys VNodes equipped with assigned func- tions on specified machines, and connects them with a specified topology.VNodes
(a) VScope Architecture (b) VScope Software Stack Fig. 3.VScope System Design
collect and process monitoring metrics, transmit metrics or analysis results to other VNodes or the DPGManager, which in turn relays results to VMaster.
DPGManager can initiate, change, or terminate its DPG on-the-fly.
InVMaster, themetric librarydefines monitoring metric types and associated collection functions. The function library defines the user-defined and default metric analysis functions, including those used in guidance (see Section 2.5).
The above metrics and functions can be dynamically deployed into DPGs for various troubleshooting purposes.
The VScope software stack, described in Figure 3(b), has three layers. The troubleshooting layer exposes basic operations in VShell: Watch, Scope, and Query, which will be described in Section 2.3. TheWatch andScope operations constitute theguidance mechanism, whereWatchnotifies the operator when and where end-to-end anomalies happen, andScopeprovides the potential candidate nodes contributing to the anomalies. Operators (or automated decision engines) can then useQuery for in-depth analysis on those candidates yielded by guid- ance. These operations are built upon the DPG layer. In particular, the guidance mechanism (Watch andScope) relies on an anomaly detection DPG and on in- teraction tracking DPGs. The DPG layer also exposes API and management commands to offer finer grain controls and customization. The lowest layer, the VScope runtime, is comprised of a set of daemon processes running on all nodes participating in the VScope system (i.e., the machines hosting the application and additional management machines running VScope). This runtime maintains the connections between machines and implements dynamic DPG creation and management. In virtualized data centers, the VScope runtime can be installed in hypervisors (e.g., Dom0 in Xen), in the virtual machines hosting the applica- tion(s) being monitored, in both, and/or in specialized management engines [21, 24]. Our testbed uses a VScope installation in the Xen hypervisor as well as in the VMs hosting the Flume application.
2.3 Troubleshooting Operations
Watch. TheWatch operation monitors a list of metrics on a set of nodes2, and its current implementation applies to them an anomaly detection function in Table 1.Arguments of Watch(*Optional)
Argument Description nodeList∗ a list of nodes to monitor metricList a list of metric types detectFunc∗detection function or code
duration∗ duration frequency∗ frequency order to detect and report anoma-
lous behaviors for any specified metrics. The parameters of the Watch operation described in Ta- ble 1 show its ability to monitor metrics on any VScope node, using detection function specified with detectFunc. Sample functions used
in our work include thresholding key performance indicators (KPI), such as re- quest latency and statistics like those based on entropy described in [37]. The frequency and duration of the Watch operation are also configurable. In our Flume application, theWatch operation continuously executes on all the Flume agent nodes, monitoring their end-to-end message latencies and detecting the nodes with latency outliers. Internally,Watchis implemented using an anomaly detection DPG explained in Section 2.5.
Scope. TheScope operation (described in Table 2) discovers a set of nodes in- teracting with a particular node specified by argumentsource, at a time specified Table 2.Arguments of Scope(*Optional) Argument Description
nodeList∗ a list of nodes to explore graph name of interaction graph source node in interest timestamp∗interaction at a specific time
distance number of edges direction∗ backward, forward or both by argument timestamp. This op-
eration guides troubleshooting by informing operators which nodes are related to the problematic node when the anomaly happens. Based on this guidance, operators can de- ploy a DPG on those nodes (or some subset of them) for further diagnosis, using the Query opera-
tion. For instance, for the Flume application, ‘horizontal guidance’ identifies the HBaseregion servers with which some specified Flume agent is interacting via a Flumecollector, and ‘vertical guidance’ tracks the mappings between a phys- ical machine and the VMs it hosts. By default, the output ofScope is a list of nodes directly interacting with the source. distance and direction are optional arguments, where the former specifies indirect interactions by setting the value
>1, and the latter specifies the ‘direction’ of interaction, for instance, ‘receiving requests from’ or ‘sending requests to’.
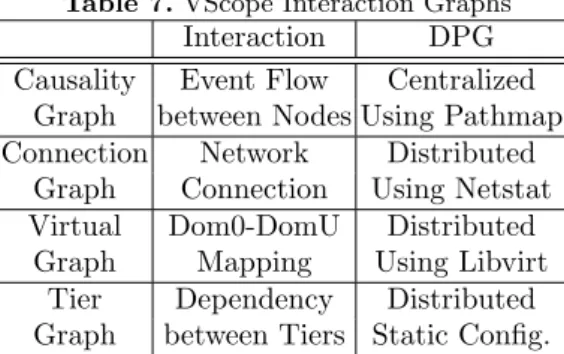
In a nutshell,Scope works by searching an in-memory, global graph abstrac- tion that describes interactions between every pair of nodes. Multiple types of interaction graphs are supported, covering a range of interactions from event level to network and system levels. These are shown in Table 7 and are specified
2 A node is a physical or a VM running the VScope runtime in example application.
with the argumentgraph. The creation and continuous update of the global graph is implemented using an interaction tracking DPG explained in Section 2.5.
Query. TheQueryfunction collects and analyzes metrics from a specified list of Table 3.Arguments of Query(*Optional)
Argument Description nodeList∗ a list of nodes to query metricList∗ a list of metric types
queryFunc analytics function or code mode∗ continuous or one-shot nodes, and provides results to query
initiators. Query has two modes – continuous mode and one-shot – the latter being helpful when running monitoring or analysis actions that have high overheads.Query(including query with ’continuous’ mode) is de-
signed with the ‘pull’ model, i.e., the VMaster requests (pulls) metrics/results fromVNodes. Conversely,watch is designed with the ‘push’ model, i.e.,VNodes periodically report basic metrics or anomaly detection results to theVMaster.
2.4 Flexible DPGs
DPG as the Building Block. All VScope operations described in Section 2.3 are implemented via DPGs. A DPG consists of a set of processing points (VNodes) to collect and analyze monitoring data. It can be configured in multiple topolo- gies to meet varying scale and analysis requirements. For example, it can be configured as a hierarchical tree or as a peer-to-peer overlay or, when operat- ing at smaller scales, as a centralized structure. Managed by aDPGManager, a DPG can be dynamically started on a specified set of nodes, where eachVNode runs locally on a designated node and executes functions specified in VScope operations. These functions are stored as binaries in the function library, and they can be dynamically linked. As a result, DPGs are flexible in terms of topol- ogy, functions executed, and metric types. Further, DPG outputs can be (i) presented immediately to the VScope user inVShell, (ii) written into rotating logs, or (iii) stored as off-line records in a database or key-value store. The last two configurations are particularly important when historical data is needed for troubleshooting. The use case in Section 4.2 uses rotating logs to store past metric measurements.
DPG API and Management Commands. Figure 4 describes the DPG core
API Point-to-point (P) Centralized (C) Hierarchy (H)
start
add
delete
sender receiver master
slaves
root parents
leaves create
stop insert assign
Fig. 4.DPG API and Topologies API and sample topologies, with de-
tails shown in Table 4. The create() method automatically creates any size topology of type point-to-point (P), centralized (C), or hierarchy (H) for some specified list of nodes. Topology specifics are configurable, e.g., besides the number of nodes, one can specify
the branching factor of a hierarchical topology.Create() returns a unique DPG
Table 4.Pseudo Functions for DPG API
DPG create (list, topology, spec) Create a DPG with a specified topology int add (src, dst, DPG) Add a link fromVNode src toVNodedst int assign (func, spec, list, DPG) Assign function to a list ofVNodes
int start (DPG) Start a DPG
int stop (DPG) Stop an operating DPG
int insert (new, src, dst, DPG) Insert a newVNode between existingVNodes int delete (src, dst, DPG) Delete a link fromVNode src toVNode dst ID for reference in subsequent operations, and in the assign() method, the pa- rameterfunc is a registered function ID. When a DPG is running, one can call theassign() to change the functionality on any VNode or use theinsert() and delete()methods to change the DPG. The DPG API is exposed as commands in VShell, as well, and there are additional auxiliary management commands like list (listing metric types, functions, or DPGs) and collect (returns the metric collection function).
Though operators can just use VScope operations without knowing the un- derlying DPG logic, new topologies, new operations and customization of exist- ing functionality can be added easily through direct use of DPG APIs, which is not described in detail here because of space constraints.
2.5 Implementation
VScope Runtime. The VScope runtime is implemented with EVPath [1], a C library for building active overlay networks. Metric collection uses standard C libraries, system calls, and JMX (at application level). Metrics are encoded in an efficient binary data format [1], and a standard format template is used to define new metric types. Built-in metrics and functions are listed in Table 5 and Table 6. As shown in the tables, VScope has a comprehensive set of metrics across application, system and platform levels, and a variety of representative analytics functions that are implemented with standard C libraries and other open source codes [13]. The DPGs associated with these functions have different topologies. For instance, Pathmap, PCA (Principle Component Analysis) and K-Clustering are implemented as centralized DPGs, as they require global data.
Table 5.Basic Metrics Level Basic Metrics
Appli- E2E Latency, JMX/JVM Metrics cation Flume/HBase/HDFS INFO Logs Virtual VCPU, Memory, I/O Metrics Machine Network Traffic, Connections Dom0 & CPU, I/O and Memory Metrics
System Paging, Context Switch Metrics
Table 6.Built-in Functions
DPG Algorithms
Watch Hierarchy MAX/MIN/AVE, Entropy, Top-K Scope Centralized Pathmap[3]
Query Centralized K-Clustering, PCA
End-to-End Anomaly Detection. TheWatch operation is implemented us- ing a DPG with a hierarchical topology in which the leaves are all of the nodes
Algorithm 1: Parallel Graph Aggregation
1. On each leaf node, generate an adjacency list (where each record is [vertex ID, connected vertices]) sorted by vertex IDs, and send it to parent 2. On each parent or root node, mergensorted
adjacency lists as follows:
i. Create an arrayP with size ofnstoring current vertex ID in each adjacency list.
ii. If multiple IDs inP are the same and they are the smallest, merge their records into a new record, else take the record with the smallest vertex ID inP as the new record. (essentially an n-way sorting of n vertex ID arrays)
iii. Place the new record into the merged adjacency list.
iv. UpdateP to reflect the next record in each adjacency list.
v. Repeat ii to iv until all the records innadjacency lists are visited.
of the web log analysis application. This DPG collects the end-to-end latency on each Flume agent, which is defined as the duration between the time when a new log entry is added and the time it (or its associated result) appears in HBase. This is measured by creating a test log entry on each agent, querying the entry in HBase, and computing the difference. The latencies are then aggre- gated through the tree using Entropy-based Anomaly Testing (EbAT) [37, 35], a lightweight anomaly detection algorithm, to output the agents that are outliers.
Other algorithms for anomaly detection and ranking are investigated in [38, 34].
Interaction Tracking. Table 7 shows the built-in global graphs supported by Table 7.VScope Interaction Graphs
Interaction DPG Causality Event Flow Centralized
Graph between Nodes Using Pathmap Connection Network Distributed
Graph Connection Using Netstat Virtual Dom0-DomU Distributed
Graph Mapping Using Libvirt Tier Dependency Distributed Graph between Tiers Static Config.
Scope, covering a range of in- teractions from event level to network and system levels. For each graph type, in our imple- mentation, a DPG is deployed and continuously run on all the nodes to construct and update the corresponding graph struc- ture inVMaster. There are two ways to track the global interac- tions,centralized ordistributed.
For interactions like the causality graph implemented usingPathmap[3], a DPG collects metrics from leaves, compresses them at intermediate nodes, and then constructs the graph at the DPG root. An alternate distributed implementation of graph construction uses parallel analysis in which the leaves analyze metrics to generate a local graph (e.g., in the connection graph, it is the ingress and egress connections on a node), the local graphs are aggregated at parent nodes to create partial graphs which are finally aggregated at the root to produce the global graph. The current prototype uses adjacency lists to represent graphs and employs the parallel algorithm shown in Algorithm 1 to merge adjacency lists.
3 Experimental Evaluation
Experiments are conducted on a testbed running 1200 Xen VMs hosted by 60 physical server blades using Ubuntu Linux (20 VMs per server). Every server has a 1TB SATA disk, 48GB Memory, and 16 CPUs (2.40GHz). Each VM has 2GB memory and at least 10G disk space.
3.1 VScope Base Overheads
We install VScope on every VM in a host and vary the number ofVNodes on Table 8.VScope Runtime Overheads DPG# VNode# CPU Usage Memory Usage in Host in VM Increase Increase
20 1 <0.01% 0.02%
100 5 <0.01% 0.02%
1000 50 <0.01% 0.03%
each VM. Each VNode collects the metrics shown in Table 5, and sends them to a separate DPG. As shown in Table 8, CPU and Memory overheads to the VM are negligible even when there are 50VNodes(1000
concurrent DPGs in the host). With continuous anomaly detection and via inter- action tracking, VScope imposes only 0.4% overhead on the end-to-end latency of application described in Section 4. In contrast and as shown in Section 4, heavyweight VScope operations, like those performing tracing or logging may incur considerable overheads, due to the innately high costs of those data collec- tion methods. These facts demonstrate the utility of continuously using the ‘thin’
VScope layer, which does not add notable costs, and then, only using heavier weight data collection and analysis methods when needed. Further, by having the ’thin’ layer point out ’where’ and ’when’ such heavier weight methods are to be used, the inevitably high overheads of using those methods can be reduced.
3.2 DPG Deployment
Fast deployment of DPGs is critical for timely troubleshooting. We evaluate this by measuring the latency for deploying a hierarchical DPG on more than 1000 VMs, each of which has one VNode. The topology has a height of 2, and the total number of leaf VMs varies from 125 to 1000.
As expected, Figure 5(a) shows increased deployment times (presented as la- tency on the Y-Axis) with increased DPG sizes. However, latency remains within 5 seconds even at the scale of 1000 VMs. This would be considered sufficient for current troubleshooting delay requirements stated in [8] (typically 1 hour), but it also suggests the utility of future work on DPG reuse – to use and reconfigure an existing DPG, when possible, rather than creating a new one, or to pre-deploy DPGs where they might be needed. Deploying moderate scale DPGs with hun- dreds of nodes, however, usually happens within 1 second, suggesting that such optimizations are not needed at smaller scale. Also note that deployment latency varies with different branching factors (bf). At scales less than 750, deploying the DPG with bf 125 has larger latency than those with smaller bf values; this is because parent nodes construct their subtrees in parallel and the parents in the DPG with bf 125 have the biggest subtrees.
0 1 2 3 4 5
1,000 750 500 250 125
Latency(Seconds)
Scale bf=5 bf=25 bf=125
(a) DPG Deployment Time
0 1 2 3 4 5
1,000 800 600 400 200 100
Global Aggregation Latency(Seconds)
Scale
(b) Global Tracking Time
0 50 100 150 200 250
1,000 800 600 400 200 100
Local Aggregation Latency(USeconds)
Scale
(c) Local Merge Time Fig. 5.Efficient DPG Deployment and Guidance Mechanism
3.3 Interaction Tracking
The Scope operation relies on efficient methods for interaction tracking. We evaluate a distributed DPG (used for connection graph) by creating a two-level, hierarchical DPG with bf 25. We vary its number of leaves from 125 to 1000, and for this test, each VM has a randomly generated local interaction graph represented by an adjacency list with 1000 vertex entries with each vertex con- nected to 1000 randomly generated vertices. We measure the total latency from the time the first local graph is generated by leaf VMs to the time when the respective merged graph is created at the root. We also measure the average time of local processing incurred during the per-node aggregation of connection graph information in order to study the dominant factor in total latency.
As shown in Figure 5(b), the total latency for generating a global graph in- creases as the system scales, but it remains within 4 seconds for 1000 VMs, where each VM has a 1000×1000 local connection graph. This means that the system can generate such a global graph at a resolution of every 4 seconds. Total latency is mainly due to the queuing and dequeuing time onVNodes plus network com- munication time. This is shown by the small measured local aggregation latency in Figure 5(c). At the same time, since these latencies increase linearly with the total number of inputs, parallel aggregation is a useful attribute to maintain for large scale systems. We also note that the local graphs occupy a fair amount of memory, which suggests opportunities for additional optimizations through use of more efficient internal data structures. Finally, the analytics actions taken by Scope utilize the Pathmap for centralized interaction tracking. In Section 3.4, Figure 6 shows that it can generate a 1000 VM graph within 8 seconds.
In summary, theScopeoperation’s current implementation is efficient for the long running enterprise codes targeted in our work, but it may not meet the requirements of real-time codes such as those performing on-line sensing and actuation in highly interactive settings like immersive games.
3.4 Supporting Diverse Analytics
We use the algorithms in Table 6 as micro-benchmarks to measure the base performance of VScope operations. Tests randomly generate a 1000×1000 matrix of float numbers on each VM, and vary the size of the hierarchical DPG (bf=25) from 125 to 1000 leaf VMs. We measure the latency for analyzing the data on
0 2 4 6 8 10
PathmapPCAKMeansTop10EntropyMMA
PathmapPCAKMeansTop10EntropyMMA
PathmapPCAKMeansTop10EntropyMMA
PathmapPCAKMeansTop10EntropyMMA
PathmapPCAKMeansTop10EntropyMMA
Latency(Seconds)
Scale 19.5
(VS 10.2%) 49.0
(VS 7.1%) 93.0 (VS 4.5%)
125 250 500 750 1,000
Function Code VScope(VS)
Fig. 6.Analytics Microbenchmark Performance
all leaf VMs at each scale. For centralized algorithms, the parent VNodes only relay the data. For the Top-K algorithm, we calculate the top 10 numbers. We conduct K-Means clustering with 5 passes.
Figure 6 shows latency breakdowns as well as the total latency of each func- tion. In general, most of the algorithms operate within seconds, with increasing latencies for rising scales. Algorithms with high computational complexity are more costly, of course, but for such ‘heavyweight’ algorithms, especially for PCA, although the total latencies are over 1.5 minutes at the scale of 1000 VMs, the base VScope implementation contributes only about 4.5% to these delays, and this contribution decreases as the system scales.
4 Experiences with Using VScope
This section illustrates the utility of VScope for troubleshooting, using the appli- cation described in Figure 1 (VScope’s DPG architecture was also investigated in other use cases in [36, 19].) The application’s Flume tier has 10 collectors, each of which is linked with 20agents. The HBase tier has 20region servers, and the HDFS tier has 40datanodes3. Experiments use web request traces from the World Cup website [18] to build a log generator that replays the Apache access logs on each of 200agentVMs. Eachagent reads the new entries of the log and sends them to itscollector. Thecollectorcombines theClientID andObjectID as the keyword and the log content as the value, then places the record into HBase.
The log generator generates 200 entries per second. The worst case end-to-end latency in the problem-free scenario is within 300 milliseconds.
The VScope runtime is installed on all of the VMs and in addition, on all physical machines (i.e., Xen’s Dom0s). In accordance with standard practice for management infrastructures [21, 36], one additional dedicated VM serves as VMaster, and 5 dedicated VMs serve as parentVNodesin the two-level hierarchy DPGs used for troubleshooting. Two use cases presented below validate VScope’s utility for efficient troubleshooting.
3 Each tier has one master node, and in HBase, 5region serversserve as the ZooKeeper quorum. For simplicity, we do not ‘count’ masters when discussing scale.
4.1 Finding Culprit Region Servers
The first VScope use case crosses multiple tiers of the Flume application. The objective is to find some ‘culprit’ region serverexhibiting prolonged execution times. Those are difficult to detect with standard HBase instrumentation be- cause debug-level logging in region servers to trace their request processing times [6] generates voluminous logs and high levels of perturbation to the run- ning server(s). Hence troubleshooting using brute force methods might quickly find a culprit by turning on all of theregion servers’ debug-level logging and then analyzing these logs (in some central place), but this would severely perturb the running application. Alternative methods that successively sample some random set of servers until a culprit is found would reduce perturbation but would likely experience large delays in finding the culprit server. More generally, for multi-tier web applications, while bottleneck problems like the ‘culprit’ region server de- scribed above commonly occur, they are also hard to detect, for several reasons.
(1) Dynamic connectivity – the connections between the Flume and HBase tiers can change, since theregion serverto which a collector connects is determined by the keyword region of the collector’s current log entry. (2) Data-Driven concur- rency – HBase splits the regions on overloadedregion servers, causing additional dynamic behavior. (3) Redundancy – a region server is typically connected by multiplecollectors. As a result, one ‘culprit’ region serverexhibiting prolonged processing times may affect the end-to-end latencies observed on manyagents.
We synthetically induce server slowdown, by starting garbage collection (GC) in the Java Virtual Machine (JVM) on one of the region servers. This pro- longed disturbance eventually slows down the Flume agents connected to the region server via their collectors. Experimental evaluations compare VScope, the brute-force, and the sampling-based approaches for finding the culprit re- gion server. The VScope approach follows the 3 steps illustrated in Figure 7.
Flume Agents
further analysis
Watch
E2E Latency Entropy Detection
Scope
Using Connection Graph
Analyzing Timing in RPC-level logs
Query
Abnormal Flume Agents
SLA Violation on Latency
Related Collectors&
Region Servers Shared RegionServers
Dynamically Turn on Debugging Processing Time in RegionServers Flume
Agents
further analysis further analysis
Watch
E2E Latency Entropy Detection
E2E Latency Entropy Detection
Scope
Using Connection Graph Using Connection
Graph
Analyzing Timing in RPC-level logs Analyzing Timing in
RPC-level logs
Query
Abnormal Flume Agents
SLA Violation on Latency SLA Violation
on Latency
Related Collectors&
Region Servers Related Collectors&
Region Servers Shared RegionServers
Dynamically Turn on Debugging Dynamically Turn
on Debugging Processing Time in RegionServers
Fig. 7.Steps using VScope operations (1) A user at a VShell console
issues a Watch operation to find which agents have prolonged end- to-end latencies.
(2) Use theconnection graph (cho- sen from Table 7) and theScopeop- eration to find the connectedcollec- torsand theregion serversto which they connect. In these guidance ac- tions, the connection graph is the graph parameter, the problematic
agentnode is thesource, and ’2’ is used as thedistance parameter. The output will be the collector and associated region servers. By iteratively ‘Scoping’ all anomalousagents, we find that they share 5collectors. Furthermore, the Scope operation returns the set of region servers in use by these collectors, and we can determine that they have 4 region serversin common. Therefore, we select those four as candidate culprits. Under the assumption of only one culpritregion server, this operation will succeed because the culprit affects all of thesecollec-
tors. While it will be rare to have multiple culpritregion serversin a short period of time, in that case, more candidates may be chosen, but they still constitute only a small set of all region servers.
(3) Here, VScope has narrowed down the search for the problematicregion server, and we can now use theQuery operation to turn on debug-level logging for the candidates. We note that theregion serversyielded by theScope operation will always include the culprit, because VScope tracks all connections. The user will still have to carefully examine the region server logs to find the problem, but
0 100 200 300 400 500 600
20/20 16/20 12/20 8/20 4/20 1/20
Slowdown(%)
Sampling Rate VScope
Brute−Force
Fig. 8. E2E Performance Slowdown (i.e. E2E latency increase) % w.r.t Sampling Rate (# of sampled region servers / total # of region servers) instead of having 20 candidates (the
brute-force approach), there are just 4. If the examination is done sequentially (by gathering and examining logs one server at a time) to minimize perturbation, the user can expect to examine 2 logs on the average (requiring 20 minutes of logging and .45GB of data) with VScope, as op- posed to 10 logs (requiring 100 minutes of logging and 2GB of data) with the brute- force approach. If log gathering is per- formed in parallel to save time, the in- formation provided by VScope allows the
retrieval of just 4 logs (0.9GB) vs. 20 logs (4.1GB) by the brute-force approach.
Note that, as shown in Figure 8, simultaneously logging on multiple region servers has a non-linear effect upon system performance. Simultaneous logging on only 4 servers (with VScope) slows the overall system down by 99.3%, but logging on all servers (brute-force) slows it by 538.9%. Compromise approaches like random sampling might log on more than one, but fewer than the total num- ber of candidate region servers, hoping to trade off perturbation with ‘time-to- problem-discovery’. However, the inherent randomness makes their performance nondeterministic. In contrast, VScope rationally narrows the set of possible bad region servers, thus improving the expected perturbation, log data sizes, and time to resolution in both average and worst cases.
These results validate the importance of VScope’s ‘guided’ operation that explicitly identifies the nodes on which troubleshooting should focus, in contrast to methods that use sampling without application knowledge or that employ non-scalable exhaustive solutions. They also demonstrate VScope’s ability to assist with cross-tier troubleshooting. We note that, for sake of simplicity, this use case assumes the root cause to be within theregion servers. This assumption can be removed, of course, and in that case, operators can apply further analysis as shown in Figure 7 by iteratively using VScope operations.
4.2 Finding a ‘Naughty’ VM
Previous research has shown the potential for running real-time application in virtualized settings [22]. However, VMs’ resource contention on I/O devices can degrade the end-to-end performance of the application. A typical scenario is
that some ‘naughty’ VM excessively uses a physical NIC shared by other VMs on the same physical host, thereby affecting the performance of the real-time VMs. Potential ‘naughty’ VMs could be those that run MapReducereducersand exchange voluminous data with a number of other nodes (e.g.mappers), or those running HDFSdatanodesand replicating large files. Contention could also stem from management operations like VM migration and patch maintenance [32].
There are remedies for contention issues like those above. They include mi- grating the ‘naughty’ VMs and/or changing network scheduling. VM migration can involve long delays, and changes to VMs’ network scheduling may involve kernel reboots that are unsuitable for responsive management. The solution with which we experiment performs traffic shaping for the ‘naughty’ VM on-the-fly, in
0.01 0.1 1 10
FlumeLatency(S)FlumeLatency(S)FlumeLatency(S)FlumeLatency(S)
0.1 1 10 100 1000 10000 100000
#Mpkgs/second#Mpkgs/second#Mpkgs/second#Mpkgs/second
1 10 100 1000 10000 100000
#Mpkgs/second#Mpkgs/second#Mpkgs/second#Mpkgs/second
1 10 100
#Mpkgs/second#Mpkgs/second#Mpkgs/second#Mpkgs/second
Anomaly Injected HDFS Write
Remedy using Traffic Shaping in Dom0 Time
Trace 1
Trace 2
Trace 3
Trace 4 E2E Performance
Good VM
Hypervisor
Naughty VM 0.01
0.1 1 10
FlumeLatency(S)FlumeLatency(S)FlumeLatency(S)FlumeLatency(S)
0.1 1 10 100 1000 10000 100000
#Mpkgs/second#Mpkgs/second#Mpkgs/second#Mpkgs/second
1 10 100 1000 10000 100000
#Mpkgs/second#Mpkgs/second#Mpkgs/second#Mpkgs/second
1 10 100
#Mpkgs/second#Mpkgs/second#Mpkgs/second#Mpkgs/second
Anomaly Injected HDFS Write
Remedy using Traffic Shaping in Dom0 Time
Trace 1
Trace 2
Trace 3
Trace 4 E2E Performance
Good VM
Hypervisor
Naughty VM
Fig. 9.Using VScope to Find a ‘Naughty’ VM the hypervisor, without involv-
ing guest VMs. To do so, how- ever, support is needed to first locate the troublesome VM.
VScope running in the Dom0s of our virtualized infrastructure provides such support. Specif- ically, VScope deploys VNodes in each host’s Dom0, using the virtualization graph in Table 7 to track mappings between VMs and hypervisors.
We emulate the ‘naughty’
VM issue by deploying a VM with a Hadoop datanode and tasktracker, on the host where a
‘good’ VM is running one of the 200 Flumeagents. This scenario is chosen to emulate co-running a real-time web log analysis application with a batch sys- tem using Hadoop for long term
analysis on the data generated by the real-time application. In this case, a prob- lem is created by starting a HDFS benchmarking job called ‘TestDFSIO write’, which generates 120 2GB files with 4 replicas for each file in HDFS. This ‘naughty VM’ generates 3 files (we have 40slavesin the Hadoop configuration. Everyslave carries out 3 map tasks, each of which writes a 2G file to HDFS, and replicates them via the network. VScope is used to find that naughty VM, so that its communications can be regularized via Dom0 traffic shaping.
The monitoring traces in Figure 9 demonstrate VScope’s troubleshooting process. Trace 1 presents the latency data generated by the Watch operation.
Latency rises after the anomaly is injected. Using 1 second as the threshold for an end-to-end performance violation, after 20 violations are observed within 5 minutes, the Watch operation reports an anomaly and its location, i.e., the
‘good’ VM. After the anomaly is reported, troubleshooting starts for the VM by querying basic VM level metrics, including the number of packages per second represented by Trace 24, where we find that metrics in the VM do not show ab- normal behavior. In response, we use theScopeoperation to find which physical machine is hosting the VM and thenQueryits aggregate packet rate. With these guided actions, Trace 3 shows that the shared NIC is exchanging a large number of packets, in contradiction to the low packet rate in the ‘good’ VM. The next step is to furtherScopethe virtualization graph to find the other VMs running on the same physical host and thenQuery the network metrics of their VIFs5. The ‘naughty’ VM is easily found, because its respective VIF consumes the ma- jority of the packets for the physical NIC, as shown in Figure 9:Trace 4. The correctness of the diagnosis obtained via VScope is demonstrated by applying traffic shaping in Dom0, which involves using TC to throttle the bandwidth of the ‘naughty’ VM. It is apparent that this action causes the end-to-end latency of the good VM to return to normal (see Trace 1). In Trace 3, the hypervisor packet rate goes down, and in Trace 4 the network consumption of the ‘naughty’
VM also sinks, as expected, but it still has its share of network bandwidth.
5 Related Work
Aggregation systems like SDIMS[39] and Moara[20] are most related to VScope in terms of flexibility. SDIMS provides a flexible API to control the propaga- tion of reads and writes to accommodate different applications and their data attributes. Moara queries sub-groups of machines rather than the entire sys- tem. In both systems, flexibility is based on dynamic aggregation trees using DHTs (Distributed Hash Tables). VScope’s approach differs in several ways.
First, VScope can control which nodes and what metrics to analyze; neither SDIMs nor Moara provides this level of granularity. SDIMS only controls the level of propagation along the tree, and Moara chooses groups based on at- tributes in the query (e.g., CPU utilization). Second, the analysis functions in SDIMS and Moara are limited to aggregation functions, while arbitrary func- tions can be used with VScope, including those performing ‘in transit’ analysis.
Third, like other monitoring or aggregation systems, including Ganglia[26], As- trolabe[33], and Nagios[27], SDIMS and Moara focus on monitoring the summary of system state, while VScope’s can also be used for in-depth troubleshooting, including debugging and tracing, supported by basic metric aggregation like that performed in theWatch operation.
GWP[30], Dapper[31], Fay[14], Chopstix[7] are distributed tracing systems for large scale data centers. VScope is similar in that it can monitor and an- alyze in-depth system or application behaviors, but it differs as follows. First, instead of using statistical (Fay and Chopstix leverage sketch, a probabilistic data structure for metric collection) or random/aggressive sampling (as used in
4 We only show NIC-related metrics for succinctness.
5 A VIF is the logical network interface in Dom0 accepting the packets for one VM and in our configuration, each VM has a unique VIF.
GWP and Dapper), VScope can look at any set of nodes, making it possible to implement a wide range of tracing strategies (including sampling) through its guidance mechanism. Second, those tracing systems use off-line analysis, while VScope can analyze data on-line and in memory, to meet the latency restriction for troubleshooting real-time applications.
HiTune[12] and G2[17] share similarity with VScope in that they are general systems for troubleshooting ‘big-data’ applications. HiTune extracts the data- flows of applications, using Chukwa for data collection and Hadoop for dataflow analysis. G2 is a graph processing system that uses code instrumentation to ex- tract runtime information as a graph and a distributed batch processing engine for processing the queries on the graph. VScope differs in its focus on on-line troubleshooting, whereas HiTune and G2are mainly for off-line problem diagno- sis and profiling. Further, HiTune and G2 are concerned with analyzing within a single application tier, while VScope troubleshoots across multiple applica- tion tiers. Other troubleshooting algorithms and systems, such as Pinpoint[10], Project5[4], and E2EProf[3], target traditional web applications while VScope focuses on real-time data-intensive applications.
6 Conclusions
VScope is a flexible, agile monitoring and analysis system for troubleshooting real-time multi-tier applications. Its dynamically created DPG processing over- lays combine the capture of monitoring metrics with their on-line processing, (i) for responsive, low overhead problem detection and tracking, and (ii) to guide heavier weight diagnosis entailing detailed querying of potential problem sources.
With ‘guidance’ reducing the costs of diagnosis, VScope can operate efficiently at the scales of typical data center applications and at the speeds commensurate with those applications’ timescales of problem development. The paper provides evidence of this fact with a real-time, multi-tier web log analysis application.
Our ongoing work is further developing VScope’s notion of guided operation, one idea being to automatically generate certain sequences of guidance actions from the previous manual actions taken by operators. We will also investigate other guidance options. To extend scalability to the 10,000+ machines of to- day’s large scale data center applications run by web companies like Google or Amazon, it may also be useful to pre-position DPGs into potentially critical sub- systems and/or reconfigure existing DPGs, instead of deploying new ones when investigating problems via detailed queries.
References
1. The evpath library. http://www.cc.gatech.edu/systems/projects/EVPath.
2. D. Abadi, D. Carney, U. C¸ etintemel, M. Cherniack, C. Convey, S. Lee, M. Stone- braker, N. Tatbul, and S. Zdonik. Aurora: a new model and architecture for data stream management. The VLDB Journal, 12(2):120–139, 2003.
3. S. Agarwala, F. Alegre, K. Schwan, and J. Mehalingham. E2eprof: Automated end-to-end performance management for enterprise systems. In Proceedings of the 37th Annual IEEE/IFIP International Conference on Dependable Systems and Networks, DSN ’07, pages 749–758, Washington, DC, USA, 2007. IEEE.
4. M. K. Aguilera, J. C. Mogul, J. L. Wiener, P. Reynolds, and A. Muthitacharoen.
Performance debugging for distributed systems of black boxes. InProceedings of the 19th ACM symposium on Operating systems principles, SOSP ’03, 2003.
5. Apache. Cloudera flume. http://archive.cloudera.com/cdh/3/flume/.
6. Apache. Hbase log. http://hbase.apache.org/book/trouble.log.html.
7. S. Bhatia, A. Kumar, M. E. Fiuczynski, and L. Peterson. Lightweight, high- resolution monitoring for troubleshooting production systems. In Proceedings of the 8th USENIX conference on Operating systems design and implementation, OSDI’08, pages 103–116, Berkeley, CA, USA, 2008. USENIX Association.
8. P. Bodik, M. Goldszmidt, A. Fox, D. B. Woodard, and H. Andersen. Fingerprinting the datacenter: automated classification of performance crises. In Proceedings of the 5th European conference on Computer systems, EuroSys ’10, pages 111–124, New York, NY, USA, 2010. ACM.
9. G. Candea, S. Kawamoto, Y. Fujiki, G. Friedman, and A. Fox. Microreboot - a technique for cheap recovery. InProceedings of the 6th Conference on Symposium on Opearting Systems Design & Implementation, OSDI’04, 2004.
10. M. Y. Chen, E. Kiciman, E. Fratkin, A. Fox, and E. Brewer. Pinpoint: Prob- lem determination in large, dynamic internet services. InProceedings of the 2002 International Conference on Dependable Systems and Networks, DSN ’02, pages 595–604, Washington, DC, USA, 2002. IEEE Computer Society.
11. T. Condie, N. Conway, P. Alvaro, J. M. Hellerstein, K. Elmeleegy, and R. Sears.
Mapreduce online. In Proceedings of the 7th USENIX conference on Networked systems design and implementation, NSDI’10, 2010.
12. J. Dai, J. Huang, S. Huang, B. Huang, and Y. Liu. Hitune: dataflow-based perfor- mance analysis for big data cloud. InProceedings of the 2011 USENIX conference on USENIX annual technical conference, USENIXATC’11, 2011.
13. M. De Hoon, S. Imoto, J. Nolan, and S. Miyano. Open source clustering software.
Bioinformatics, 20(9):1453–1454, June 2004.
14. U. Erlingsson, M. Peinado, S. Peter, and M. Budiu. Fay: extensible distributed tracing from kernels to clusters. InProceedings of the Twenty-Third ACM Sympo- sium on Operating Systems Principles, SOSP ’11, pages 311–326, 2011.
15. Facebook. Scribe. https://github.com/facebook/scribe/wiki.
16. B. Gedik, H. Andrade, K.-L. Wu, P. S. Yu, and M. Doo. Spade: the system s declarative stream processing engine. InProceedings of the 2008 ACM SIGMOD international conference on Management of data, SIGMOD ’08, pages 1123–1134.
17. Z. Guo, D. Zhou, H. Lin, M. Yang, F. Long, C. Deng, C. Liu, and L. Zhou. g2: a graph processing system for diagnosing distributed systems. InProceedings of the 2011 USENIX annual technical conference, USENIXATC’11, 2011.
18. Hewlett-Packard. Worldcup98 logs. http://ita.ee.lbl.gov/.
19. L. Hu, K. Schwan, A. Gulati, J. Zhang, and C. Wang. Net-cohort: Detecting and managing vm ensembles in virtualized data centers. InProceedings of the 9th ACM International Conference on Autonomic Computing, ICAC ’12, 2012.
20. S. Y. Ko, P. Yalagandula, I. Gupta, V. Talwar, D. Milojicic, and S. Iyer. Moara:
flexible and scalable group-based querying system. In Proceedings of the 9th ACM/IFIP/USENIX International Conference on Middleware, Middleware ’08, pages 408–428, New York, NY, USA, 2008. Springer-Verlag New York, Inc.
21. S. Kumar, V. Talwar, V. Kumar, P. Ranganathan, and K. Schwan. vmanage:
loosely coupled platform and virtualization management in data centers. InPro- ceedings of the 6th international conference on Autonomic computing, ICAC ’09, pages 127–136, New York, NY, USA, 2009. ACM.
22. M. Lee, A. S. Krishnakumar, P. Krishnan, N. Singh, and S. Yajnik. Supporting soft real-time tasks in the xen hypervisor. In Proceedings of the 6th ACM SIG- PLAN/SIGOPS international conference on Virtual execution environments, VEE
’10, pages 97–108, New York, NY, USA, 2010. ACM.
23. LinkedIn. Kafka. http://sna-projects.com/kafka/design.php.
24. M. Mansour and K. Schwan. I-rmi: performance isolation in information flow appli- cations. InProceedings of the ACM/IFIP/USENIX 2005 International Conference on Middleware, Middleware ’05, pages 375–389, 2005.
25. N. Marz. Twitter’s storm. https://github.com/nathanmarz/storm.
26. M. L. Massie, B. N. Chun, and D. E. Culler. The ganglia distributed monitoring system: Design, implementation and experience. Parallel Computing, 2003.
27. L. Nagios Enterprises. Nagios. http://www.nagios.org/documentation.
28. L. Neumeyer, B. Robbins, A. Nair, and A. Kesari. S4: Distributed stream com- puting platform. InData Mining Workshops (ICDMW), 2010 IEEE International Conference on, pages 170 –177, dec. 2010.
29. A. Rabkin and R. Katz. Chukwa: a system for reliable large-scale log collection.
In Proceedings of the 24th international conference on Large installation system administration, LISA’10, pages 1–15, Berkeley, CA, USA, 2010.
30. G. Ren, E. Tune, T. Moseley, Y. Shi, S. Rus, and R. Hundt. Google-wide profiling:
A continuous profiling infrastructure for data centers. Micro, IEEE, 2010.
31. B. H. Sigelman, L. A. Barroso, M. Burrows, P. Stephenson, M. Plakal, D. Beaver, S. Jaspan, and C. Shanbhag. Dapper, a large-scale distributed systems tracing infrastructure. Technical Report dapper-2010-1, Google, Apr 2010.
32. V. Soundararajan and J. M. Anderson. The impact of management operations on the virtualized datacenter. In Proceedings of the 37th annual international symposium on Computer architecture, ISCA ’10, pages 326–337, 2010.
33. R. Van Renesse, K. P. Birman, and W. Vogels. Astrolabe: A robust and scalable technology for distributed system monitoring, management, and data mining.ACM Trans. Comput. Syst., 21:164–206, May 2003.
34. K. Viswanathan, L. Choudur, V. Talwar, C. Wang, G. MacDonald, and W. Sat- terfield. Ranking anomalies in data centers. In the 13th IEEE/IFIP Network Operations and Management Symposium, NOMS’12, pages 79 – 87, 2012.
35. C. Wang. Ebat: online methods for detecting utility cloud anomalies. InProceedings of the 6th Middleware Doctoral Symposium, MDS ’09, 2009.
36. C. Wang, K. Schwan, V. Talwar, G. Eisenhauer, L. Hu, and M. Wolf. A flexible architecture integrating monitoring and analytics for managing large-scale data centers. In Proceedings of the 8th ACM international conference on Autonomic computing, ICAC ’11, pages 141–150, New York, NY, USA, 2011. ACM.
37. C. Wang, V. Talwar, K. Schwan, and P. Ranganathan. Online detection of util- ity cloud anomalies using metric distributions. Inthe 12th IEEE/IFIP Network Operations and Management Symposium, NOMS’10, pages 96–103, 2010.
38. C. Wang, K. Viswanathan, L. Choudur, V. Talwar, W. Satterfield, and K. Schwan.
Statistical techniques for online anomaly detection in data centers. In the 12th IFIP/IEEE International Symposium on Integrated Network Management, IM’11, pages 385 – 392, 2011.
39. P. Yalagandula and M. Dahlin. A scalable distributed information management system. In Proceedings of the 2004 conference on Applications, technologies, ar- chitectures, and protocols for computer communications, SIGCOMM ’04, pages 379–390, New York, NY, USA, 2004. ACM.