Contents
Wound dressing materials
- Requirements for a good wound dressing
- Nanofibrous structures produced by electrospinning 2.3 Synthetic polymers
Nanofibrous structures as halochromic wound dressing materials 1 PH responsive nanofibres
- Apprehension of the color 4. Objective of the thesis
Electrospinning equipment
- Mononozzle electrospinning setup 2.2 Multinozle electrospinning setup
Characterization
- Conductivity and Viscosity
- Scanning Electron Microscopy (SEM)
- UV-VIS spectroscopy 4.5 Grey scale
The selection of polymer/dye system
Preliminary tests on PCL dye doped by Disperse Red 1 and the functional group 4. Preliminary tests on PA6 dye doped by Bromocresol Purple
- Dye release 3.2.2 Hydrolysis
- Hydrolysis and dissolution of nanofibres 4. Conclusions
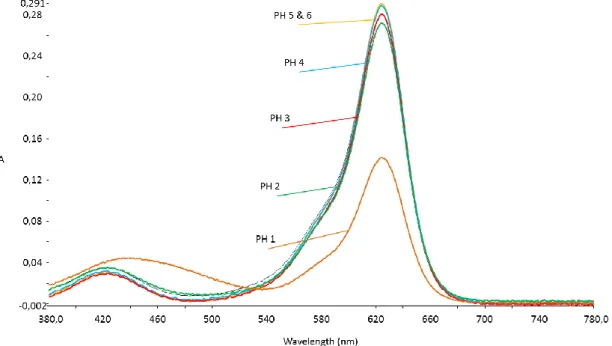
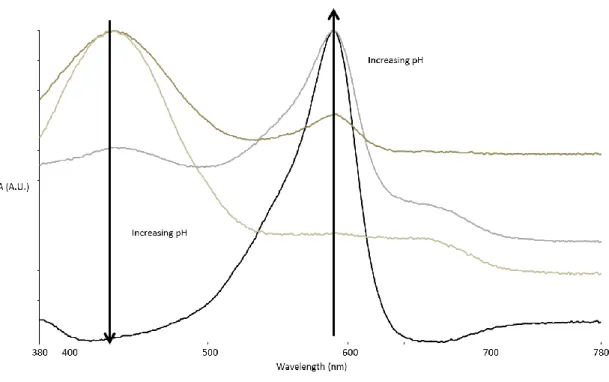
- Characterization of Fast Green in solution
- Characterization of Polyamide 6 nanofibres containing Fast Green by doping 1.3 PH sensitivity of the PA6/FG and PA6/FG/Perfixan samples
- Bromocresol purple characterization
Conclusions
Introduction and literature study
Introduction
In this way, the favorable properties of the components can be combined, increasing the quality of the new material. Poly(dadmac) is a polymeric complex agent to be used for the reduction of leachate color.
![Figure 1: PH values of acute wounds [14]](https://thumb-eu.123doks.com/thumbv2/pdfplayerco/320240.47872/17.892.260.637.118.325/figure-1-ph-values-acute-wounds-14.webp)
Nanofibrous structures as halochromic wound dressing materials
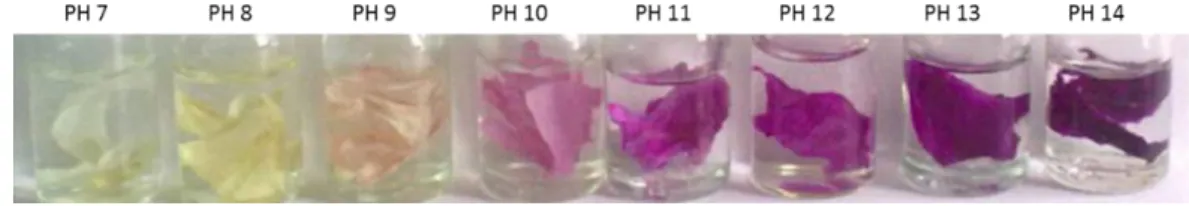
A pH-sensitive dressing can provide information based on color alone, as the pH of a wound's skin varies during the healing process. This can avoid unnecessary removal of the bandage. Color is a visual stimulus and can be used to indicate the healing process of a burn.
Objective of the thesis
Materials and methods
Materials
4 Laboratory jack Used to adjust TCD by measuring the distance between the needle tip and the collector. When there is a need for thicker and larger samples, the stability or the electrospinning process needs to be tested, a multi-nozzle electrospinning setup can be used. This setup is basically the same as the mononozzle setup, with the possibility of using more needles and being able to move the collector, creating a semi-continuous process.
The needles are connected to the syringes by PVC tubing and to the high voltage sources by a metallic wire in series mode to transmit the applied voltage. They are supported by the top element, which is made of an insulating material due to the electric field. The setup is located in a controlled environment that guarantees a temperature of 21±20°C and a relative humidity of 45±5%.
![Figure 5: Schematic of monozzle eletrospinning set up [15]](https://thumb-eu.123doks.com/thumbv2/pdfplayerco/320240.47872/27.892.186.708.106.540/figure-5-schematic-monozzle-eletrospinning-set-15.webp)
Color fastness
The formation of the nanofibrous structures was investigated using a scanning electron microscope (Jeol Quanta 200 F FE-SEM) at an accelerating voltage of 20 kV. A gold layer was applied using a sputter coater (Balzers Union SKD 030), which is responsible for the cracks that sometimes appear on the fibers in the SEM images. Various aqueous solutions with hydrochloric acid (Sigma-Aldrich 1 mol l-1) and sodium hydroxide (Sigma-Aldrich 50 wt %) were prepared for the determination of pH of each halocream sample.
In the above solutions, potassium nitrate was added (1 g l-1) to ensure a constant activity coefficient during the procedure. After immersion in pH baths, the samples are placed on a dry nanofibrous polyamide non-woven to view the color and allow handling of the samples. An integrated sphere (Spectralon Labsohere 150 mm) was used for the reflection measurements on the fabrics.
Preliminary tests on PCL and PA6 doped by colorants and complexing agent
Pure PA6 & PCL nanofibres, colorants incorporated with nanofibrous structures
III Preliminary tests on PCL and PA6 doped by dyes and complexing agent - 19 - A dye presents different characteristics in solution compared to substances incorporated in nanofibers. The halochromic behavior changes when a dye is added directly to the solution and then electrospun to produce the halochromic nanofibrous structures. Any type of pH indicator doped in the polymer solution does not change the fiber diameter and electrospinning parameters.
The molecular structure of the dye-doped PCL was also discussed, as it is believed to be a very important factor for evaluation. Although not the case in this project, this method would help in future work to better understand the mechanisms and interactions between dye molecules and nonwoven structures. In this chapter, the selection of a suitable polymer/dye system is described, and preliminary tests were carried out to study the system during electrospinning and to evaluate the process.
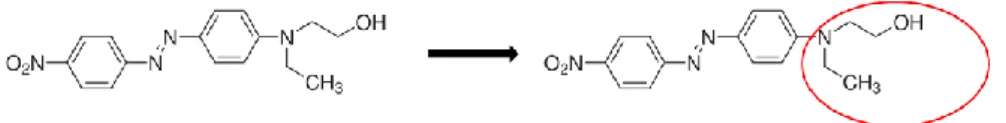
Preliminary tests on PCL dye doped by Disperse Red 1 and the functional group
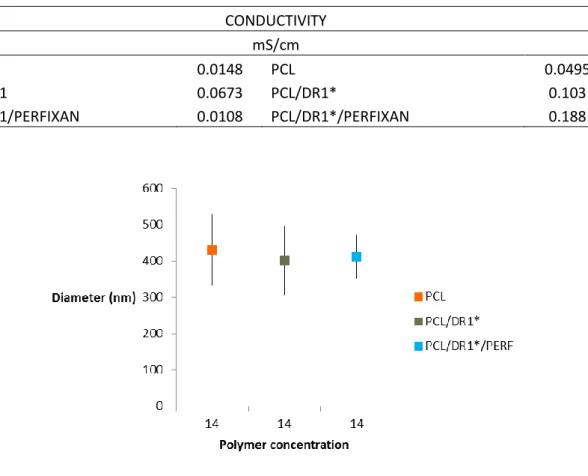
There is no significant effect of dye in polymer solutions, also in Figure 6. There is no significant difference in fiber diameter between DR1-doped PCL dye and DR1*-doped PCL dye (Figure 8).
Preliminary tests on PA6 dye doped by Bromocresol Purple
III Preliminary tests on PCL and PA6 doped with dyes and complexing agent - 23 - respectively during the electrospinning process and the parameters were kept constant (speed = 2 ml/h, voltage = 22 kV and TCD = 6 cm). The solution containing the complexing agent is not as stable as the doped dye. It took a few seconds to make it stable and still the beam was not straight like the dye-doped polymer solution.
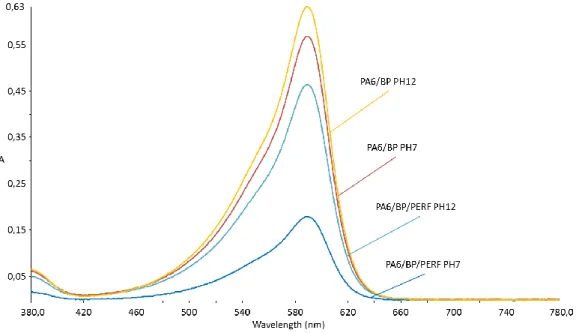
In conclusion, it can be said that the addition of the pH indicator bromocresol purple and the complexing agent to the polymer solution has no significant influence on the electrospinning process, although obtaining a stable electrospinning process is more difficult when Perfixan was also added. Last but not least, it was noted that after the solvent evaporated (5 hours after the solutions were electrospun) PA6/BP and PA6/BP/Perfixan nanofiber samples changed color from yellow to light green and from yellow to dark green, respectively, which can explained by the evaporation of the solvent. III Preliminary tests on PCL and PA6 doped with dyes and complexing agents - 24 - There is no dye release between pH 2 and 7, but there is dye release between pH 7 and 12.
Electrospinning PA 6, dye doped and blended
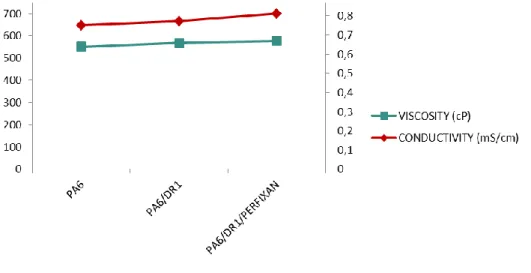
The color change of constant DR1 and DR1* nanofibers on the polymer solution was measured at pH 2, 7 and 12 with and without the presence of a complexing agent (Perfixan RDV). Although it is known that the addition of low molecular weight components can change the process conditions and fiber morphology, the morphology of PA6/DR1 and PA6/DR1* did not change, as seen in the SEM images (Figure 13). Cracks on the fiber structure were observed in pure PA6, while the PA6/DR1* nanofiber samples are free of cracks, which are due to the gold coating before imaging and are therefore due to the preparation of the SEM samples (Chapter II – Materials and Methods).
Furthermore, greater color depth was observed in PA6/DR1 samples than in PA6/DR1*. Moreover, from the normalized Kubelka-Munk plot, it was noted that there is a small color change between PA6/DR1 and PA6/DR1*. IV Electrospinning PA6, dye-doped and mixed - 31 - Moreover, there is no color change between pH 2 and 12 in PA6/DR1 nanofibers and PA6/DR1/Perfixan.
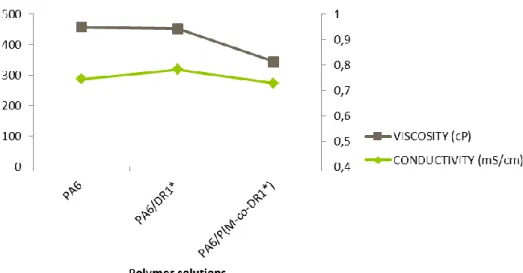
Characterization of blend nanofibers containing P(M)
The Kubelka-Munk plot in Figure 21 shows the difference in color depth of the two samples. In Figure 22 is the inset of the samples on the non-woven reference samples and it is clearly visible the release of the covalent bond dye at pH 12. The same was observed regarding the color depth of PA6/P(M-co- DR1* ) nanofiber samples except for the sample that was immersed in pH 0.5.
A significant color release of the blend nanofibers was observed in solution at pH 12 (figure 24) so further tests such as water stability were performed to characterize the color release. Furthermore, in the covalently bound polymer dye, release was observed at pH 12 due to the hydrolysis of the functional group of the dye molecule, so pH baths (10 and 11) were completed to observe at which value pH begins the hydrolysis of the dye. Above pH 10, hydrolysis of the covalent bond is observed, which can be explained by the fact that the functional group of the dispersant agent is hydrolyzed in the alkaline environment and the covalent bond between the backbone molecule and the dye molecule is broken.
4 Conclusions
IV Electrospin PA6, dye doped and mixed - 43 - Furthermore, nanofiber samples were tested in lower pH values and 1.5) because disperse red 1 is not stable in low pH values. Under pH 2, color change between pH 0 and 1.5 was noted in the dye doped and in the covalently bound nanofiber sample. Thus in pH 0 the greatest dye release was noted in both cases due to the dissolution of the polyamide 6 in low pH baths.
Hydrolysis of the covalently bound samples was noted as a consequence of the breaking of the covalent bond.
Electrospinning PA6 doped by Fast Green and by Bromocresol Purple
Electrospinning PA6, PA6/FG and PA6/FG/Perfixan
V Electrospinning of PA6 doped with Fast Green and Bromocresol Purple - 46 - prepared with 40 ml of PA6 in 50/50 AA/FA, the first is polyamide 6, the second is added 0.5% off Fast Green and v adds a third 0.5% omf and 4% complexing agent Perfixan RDV. Fast Green was found to have a long reaction time, so the method was repeated and the samples were now immersed for 10 minutes. In addition, the effect of Perfixan on the color of the dry dye was observed and at pH 12, the color change due to Perfixan was greater than that of the PA6/FG samples.
V Electrospin PA6 doped by Fast Green and by Bromocresol Purple - 50 - The dye leaching of the PA6/FG samples is the highest in pH 7. The dye release is increased in the dye-doped samples compared to that by Perfixan and the dye doped showing that the use of a complexing agent is indispensable to achieve a successful residual color. Samples doped by the complexing agent present much less dye release compared to the dye-doped nanofibrous samples, and this may be due to the elimination of polyvalent metal ions caused by the complexing agent.
Electrospinning of PA6, PA6/BP and PA6/BP/Perfixan
V Electrospin PA6 doped by Fast Green and by Bromocresol Purple - 53 - Conductivity and viscosity increase when perfiksan was added to the solution. The dye affects fiber morphology, as diameters that decrease with the addition of bromocresol purple (figure 50) and perfiksan have no effect on the fiber diameter. In order to characterize the dye leaching of the doped samples with bromocresol press and the doped samples with the complexing agent and the dye, tests were conducted between pH 2 and 12.
Fast green and bromocresol violet are labeled in solution and when incorporated into nanofibers. The complexing agent reduces the leaching of the dye at low pH, as the pH increases, the release of the dye also increases. The color of PA6/BP/PERF when spun is deeper due to the perfixant compared to dye-doped nonwovens.
Conclusions and future work
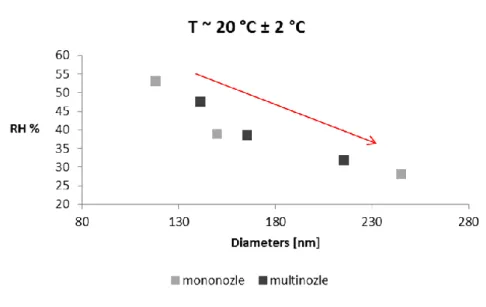
The influence of humidity on the diameters of polyamide nanofibers; data are selected on different electrospinning days and analyzed. Moisture has a plasticizing effect on diameters, when moisture increases, diameters decrease, which is the case for a good wound dressing, as absorbency is essential.
COLOURANTS MOLECULE STRUCTURE
18] Pitt Supaphol Chidchanok, Mit-uppatham, Manit Nithitanakul (2005) Ultrafine electrospun polyamide-6 nanofibers: effect of radiating electrode polarity on morphology and average fiber diameter. 28] Fernando Wypych, Kestur Gundappa Satyanarayana (2005) Functionalization of monolayers and nanofibers: a new strategy to produce polymer nanocomposites with optimized properties, Journal of Colloid and Interface Science, 285, pp. Derrick Dean2 and Ho-Wook Jun (2009) A hybrid biomimetic scaffold consisting of electrospun polycaprolactone nanofibers and self-assembled peptide amphiphile nanofibers.
40] Zhi-Juan Pan, Hong-Bo Liu, Qian-Hua Wan (2008) Morphology and Mechanical Property of Electrospun PA 6/66, www.tbisociety.org. References Songting Tan, Xianwei Huang and Bolin Wu (2007) Mini review: Some fascinating phenomena in electrospinning processes and applications of electrospun nanofibers. 49] Xuri Yan, Michael Gevelber (2010) Investigation of electrospun fiber diameter distribution and process variations, Journal of Electrostatics, 68, pp.