However, this is not enough, as users need tools that take advantage of the potential offered by the ontology to assist them in their information management and search tasks. Browsing tools are supplemented with search mechanisms, and the user is also provided with the possibility of establishing links between ontological concepts and file-directories, thus offering a fully functional tool for managing personal information.
Objectives and Motivation
The core of the OntoFM plugin is an existing personal ontology that corresponds to the user's personal information space. This ontology is used to complement traditional hierarchy-based personal file management with the potential to navigate and search the personal information space through concepts and relationships within the ontology.
Thesis Structure
Included is a brief review of personal information management, graphical representations of ideas and information, and software platforms and languages related to this thesis. This chapter provides a brief overview of personal information management and graphical representations of ideas and information, such as concept maps and mind maps.
Personal Information Management
Activities in and outside the PIM of (Boardman, 2004). Jones Teevan, 2007) had a different, more general than Boardman and Barreau's view of PIM, which includes the entire personal information space of users. Performing PIM activities may result in changes to the organizational structure of the user's personal information space, since such activities also include some organization.

Graphic Representations of Ideas and Information
Concept Maps
In addition to concepts, concept maps can also contain specific examples of events or objects that help clarify the meaning of a given concept. Finally, concept maps are used to define the ontology of computer systems, for example with the object role modeling or Unified Modeling Language formalism.

Mind Maps
Mind mapping software can be used to organize large amounts of information, combining spatial organization, dynamic hierarchical structuring, and node folding. The mind mapping concept can be expanded by allowing individuals to map more than just thoughts and ideas with information on computers and the Internet, such as documents, images and emails.
Concept Maps Versus Mind Maps
Finally, concept maps lead to deeper understanding, but they are not as easy to remember. However, mind maps are not as understandable as concept maps, but they are easier to remember.

Software Platforms and Languages
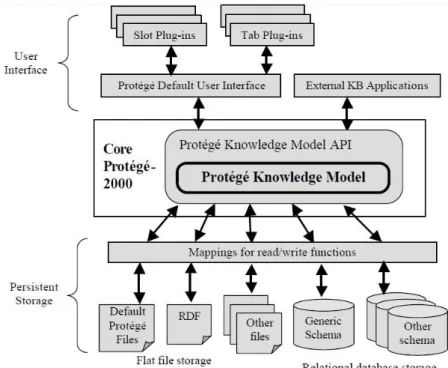
The Protégé Ontology Editor and Knowledge Acquisition System
Noy, Fergerson, Musen, 2000) describes four basic modeling components, including classes and instances slot facets and axioms. Starting with classes that represent the domain concepts and can be concrete or abstract, they can be organized into class hierarchies where multiple inheritance is allowed. Instances stand for case of concept, and each one inherits all of the concept's properties and relationships. Slots, which represent attributes or properties of the domain concepts, may have the same name, but they represent different attributes in different classes.
Lucene Information Retrieval Library
Search terms can be further modified in a variety of ways, including wildcards and soft searches. Finally, logical operators can be used to obtain different search results using the same query terms, depending on the operator used. Starting with the AND operator, you can insert it between expressions or phrases to indicate that both are to be found.
Web Ontology Language (OWL)
In addition, some ontology visualizations implemented as Protégé plugins compatible with Protégé-OWL 4.0 are presented. Starting with subsection 3.1 we present several personal information management systems such as MIT SFS, GoNTogle, SEDAR, NEPOMUK, SEMEX, HAYSTACK and SPONGE, while subsection 3.2 presents the three most well-known ontology visualizations implemented as Protégé plugins compatible with Protégé -OWL 4.0. Finally, Section 3.3 summarizes these related systems and visualizations and compares them to the functionality and appearance of OntoFM.
Personal Information Management Related Systems
- MIT Semantic File System (MIT-SFS)
- Semantic, Deep Archival File System (SEDAR)
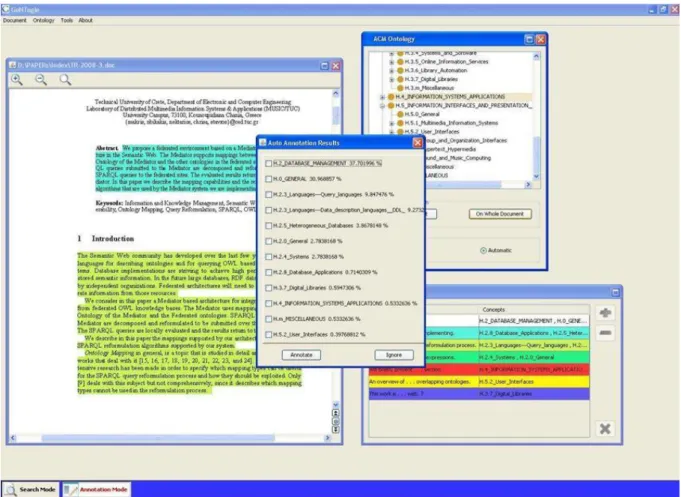
- GoNTogle
- NEPOMUK
- Semex
- Haystack
- SPONGE
Through semantic file system search, the user can retrieve a set of files and/or directories that contain the entities described in the query. Therefore, applications should help users filter and select information that is relevant to the user's needs. Starting with the search tool, a search of the RDF repository is performed as soon as the user starts typing keywords.
Related Ontology Visualizations
NavigOWL
OWLViz
It is enriched with graph layouts that can be applied to the ontology to understand its structure. The plugin enables the export of the chart as bitmap image, supports formats such as *.png, *.jpeg and *.svg. Finally, OWLViz is implemented as a view so that the subsumption graph can be shown on any tab.
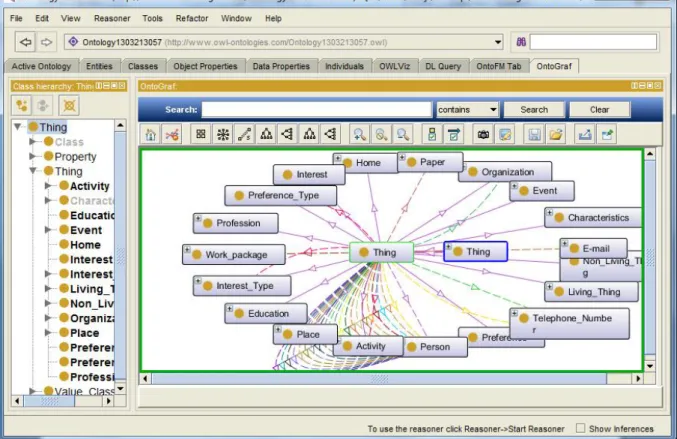
OntoGraf
This means that functions such as browsing and searching in the file system hierarchy are necessary for the user. Taking advantage of the provided search engine, the user can type all or part of the file name into the search box. When the user presses the Add Link button, the newly selected link between the file and the target is created in the personal ontology.
Comparing Related Personal Information Systems to OntoFM
The user can interact with the ontology visualization by expanding, collapsing or hiding nodes and applying filters or different layouts using the provided ontology visualization toolbar. To end with the navigation functionality, OntoFM introduces an innovative support for selecting multiple folders to access their contents at once or to limit the locations of the search results. Finally, as shown in the table above, only NEPOMUK and OntoFM allow the user to edit the ontology by adding new instances or relationships between two existing instances.
Comparing Related Visualizations to OntoFM Visualization
Summary table regarding the differences between MIT SFS, GoNTogle, NEPOMUK and OntoFM ( = supported, not supported, ? = not listed). Furthermore, even though both OWLVIZ and NavigOWL do not provide node or edge filtering, Ontograf and OntoFM do not provide node visibility status, but only for orphan nodes. Apart from that, both OWLVIZ and NavigOWL do not offer node pinning and loading or saving of graphs.
Comparing Results
While OWLViz cannot handle mouse events and does not support finding nodes, NavigOWL cannot export a graph. Summary table of the differences between the ontology visualizations NavigOWL, OWLViz, OntoGraf and OntoFM (=supported, not supported). In this chapter, we describe the previous implementation of OntoFM, namely what it consists of and how it works.
Earlier implementation of OntoFM
When searching is implemented, a hidden related concepts window appears, showing everything related to the keywords' concepts. To clarify, Figure 4-1 is an example of a search image log, which shows the case when the user searches for files related to the keywords "publication_journal_paper". Apart from the related files, the OntoFM application retrieves the first-level related concepts for both "publication" and "journal_paper".
Problems and Solutions
The two main functions implemented by OntoFM were browsing catalogs and files and searching the file system using semantic metadata provided by custom ontology. Additionally, the user could select multiple folders and view their contents simultaneously. The first one is indirectly through the file list panel, when the details view is selected, by sorting files using one of the time-related columns (created or modified) and the second one is directly through the "Date" concept use that in the personal ontology and restrict access to it. Protégé Bug Report, 2011) which calls for making Protégé UI components available for use by standalone applications.
Assumptions
General Assumptions
By this assumption we ensure that the user does not have to create a new “File” instance in the personal ontology. This leads to the decision to not allow the user to create or delete instances or drafts. However, information about our daily lives changes, so it is imperative to allow the user to change the ontology by relating its 'File' instances to other instances or concepts.
Visualization Assumptions
Finally, as mentioned above, we assume that each file and directory has corresponding "File" instance in the personal ontology. The similarities outlined above make OntoGraf ideal to use for the ontology visualization for the OntoFM plugin. On the physical structure side, each user has organized the files in a certain way, which allows the user to locate each file easily and quickly.
Specifications
The search results are displayed in the same results window with the selected folder contents, as discussed in the Visualization Assumptions subsection. As discussed in the Visualization Assumptions subsection, displaying the ontology or part of it is a complex issue, and can be classified as a "medium necessity" feature. At this point, we can assume that each path label is a search criterion that imposes the result files to be contained in the selected folder.
Architecture
Moreover, updating the ontology by relating files to other instances or concepts, to keep the ontology updated for everyday needs, is an essential feature that can also be classified as a "medium necessity" feature. The ontology visualization is based on the Ontograf plugin, which has been extended to support the additional functionality offered by the file manager and adapted to display the ontology according to the mind map paradigm. Mind mapping-inspired ontology visualization and interaction enables users to manipulate the ontology without requiring detailed technical knowledge in ontology building.

Implementation
Platform and tools
Finally, the top layer (user interface and visualization) collects user input and displays the results to the user. In this way, we provide semantic expressiveness by leveraging the inherent mind mapping connections to enrich and present the user's information space.
Libraries
Last but not least, the OntoGraf libraries helped visualize the ontology in a comprehensive mind map manner. This chapter describes an overview and functionality list using image stubs to illustrate the functionality of the plugin and to better explain the features offered.
Overview
Next is the location window located above the search bar, which allows the user to view the folders selected from the folder hierarchy panel. Finally, Chart Visualization toolbar located in the Chart Visualization panel contains the chart visualization controls.
Functionality
- Browsing through Catalogues and Ontology Items
- Search and Locate Files
- Advanced Search
- Relate File to Items
The first category is full exploration where the user knows the name and location of the file. As soon as a folder is selected, the file list pane located in the middle of the plugin setup displays all the files located under it, allowing the user to browse through them. This process can be repeated if the user wants to select more folders from the file hierarchy list.
As soon as the user selects a destination from the appropriate list, the "Add Relation" button becomes enabled. If the user wants to remove an existing relationship, he can click on the icon to remove the desired relationship.
