In Chapter 3, we will discuss how the concept of network virtualization can be concretely implemented in mobile network scenarios. Then, in Chapter 4, basic technical-economic concepts related to mobile network virtualization are presented and their importance is mentioned.
VIRTUALIZATION IN NETWORKING
In the first category, the network provider ignores the presence of VPN and the creation, management and separation of the channels are under customer control. The purpose of that network is to implement network services that are not available in the existing network.
![Figure 1: VLAN example [1]](https://thumb-eu.123doks.com/thumbv2/pdfplayerco/285004.36332/12.918.318.619.449.703/figure-vlan-example.webp)
NETWORK VIRTUALIZATION TOOLS AND ARCHITECTURES
- Benefits of SDN
- OpenFlow
- Benefits of SDN and OpenFlow usage in wireless networks
- Network Functions Virtualization (NFV)
When a switch wants to communicate with the controller, it uses the IP address of the controller while the port is defined by the user. Via that channel, the manipulation of switch takes place to give the opportunity to the controller to add, remove or update the flow entries of the flow tables. That mechanism is based on the in-port of the packets or in a tag at the header of the packets.
The controller examines the packet and inserts entries into the flow tables of the switches in the flow path (step 3). That port can be a physical port on the switch, or even a virtual one that is selected by a virtual machine running on the switch. The paper [10] also contains some additions to enable SDN in the core network of cellular networks.
Selection of the roaming destination can be based on a QoS metric such as performance, signal strength, or distance. The presence of the controller (probably residing in the mobility management entity (MME)) is crucial for the cooperation with the ANDSF. NFV assumes and emphasizes the widest possible flexibility regarding the physical location of the virtualized functions.
These benefits range from economics to performance to the feasibility of the features being virtualized.
![Figure 3: Software-Defined Network Architecture [5]](https://thumb-eu.123doks.com/thumbv2/pdfplayerco/285004.36332/16.918.244.689.97.495/figure-software-defined-network-architecture.webp)
BENEFITS OF MOBILE NETWORK VIRTUALIZATION: NETWORK SHARING
The idea of sharing
The reuse of the latter two is termed active radio access network (RAN) sharing which may involve sharing antennas/base stations across multiple mobile (virtual) network operators with either separate spectrum resources for each entity or sh. In short, there are three ways of sharing: sharing of mobile resources, sharing of cooper infrastructure and sharing of the fiber used in the cable networks. Basically, network sharing can be achieved through passive and active sharing Passive sharing refers to the reuse of components such as sites, masts, cables, ducts, splitters, shelters, generators, air conditioning equipment, diesel electric generator, battery, electrical supply, technical premises.
Operators can take advantage of the most profitable for them and combine different sharing methods. Essentially, network sharing can be achieved through passive and active sharing components such as sites, poles, cables, air conditioning equipment, diesel electricity. Active sharing refers to the reuse of backhauls, base stations and antenna systems. The reuse of the latter two is characterized as active radio access network (RAN) sharing, which may include antenna/base station sharing between multiple mobile (virtual) network operators with separate spectrum or spectrum resources over spectrum.
In the MORAN (Multi Operator RAN) approach, the operators share RAN gateways and some parts of the base stations such as processing elements, whereas the radios and power amplifiers remain physically independent to enable the units to use their different assigned frequencies. Due to operators' implementation choices, different nodes or parts of the common CN may be shared.
![Figure 18: RAN Sharing [17]](https://thumb-eu.123doks.com/thumbv2/pdfplayerco/285004.36332/30.918.243.700.102.360/figure-ran-sharing.webp)
Virtualization-based networks
In this way, infrastructure providers can only concentrate on the maintenance of the physical equipment and save manpower for the operation of the networks [21]. Moreover, by using virtualization, the deployment, maintenance, migration and upgrade of the mobile systems will be flexible and even on the go. In particular, the radio equipment in the BS is separate from the baseband processing unit.
This can alleviate the QoS problem for the delay-sensitive traffic that can be experienced in the remote virtualization approach. More specifically, they refer to the construction cost of the cell site as well as the cost of the radio BSs needed to cover a certain geographical area. In this architecture, a software-defined approach is used to achieve complete virtualization and programmability of the RAN.
First, the SDN controller evaluates the resources each network needs based on the current network requirements and characteristics. Fifth, through application-level virtualization, the SDN Controller provides a virtual operating network that meets operator requirements.
![Figure 21: Local virtualization framework [22]](https://thumb-eu.123doks.com/thumbv2/pdfplayerco/285004.36332/34.918.237.740.113.399/figure-local-virtualization-framework.webp)
COSTS FACED BY MOBILE NETWORK OPERATORS
Economic values
The IRR (Internal Rate of Return) is the discount rate resulting from an investment and income, which brings the present value of the future net cash flow to zero. To find this solution, several iterations of the proposed plan will have to be carried out. The IRR gives a good indication of the value achieved in relation to the money invested.
The cash balance (accumulated discounted cash flow) is in proportion to the difference between costs and profits. Its curve generally goes negative in the early part of the investment project due to initial capital expenditure. Once the revenues are generated, the cash flow becomes positive and the liquidity curve begins to rise.
The lowest point in the cash balance curve indicates the maximum amount of financing required for the project. The time when the cash balance becomes positive represents the payback period of the project.
![Figure 23: Cash balance [24]](https://thumb-eu.123doks.com/thumbv2/pdfplayerco/285004.36332/38.918.254.731.711.939/figure-cash-balance.webp)
Cost Models
24 represents a techno-economic model and the key steps to be estimated in order to have an overall idea of all the aspects of the investment that the figure indicates, the right way to create a techno-economic model is to gather information about regulation, competitors, and technological breakthroughs to form a strategy that will suit customers' needs.
Business Models
The cost of service provision will be reduced in SDN networks due to automated network configuration and in addition, human errors will be reduced. From this figure we can assume that, as the base station range decreases, the cost is driven by transmission, rather than radio and location costs. Another way would be to allow denser deployment while reducing the cost per base station.
The TRXs also require a software upgrade, which is actually performed at the base station controller level. To ensure physical coverage, the cell radius is determined from link budgets (transmitter output power, transmit antenna gain, path loss, receive antenna gain, receiver noise power, link margin) calculated on the uplink, which is more restrictive since the transmit power from the mobile is lower than that from the base station. In addition, the concentration of coverage leads to high costs of the base stations (BTSs).
The lowest point on the cash balance indicates the amount of investment funding required from the operator (payback period). Whatever technology is chosen in layer 2 (Ethernet or ATM), there is no impact on the cost level and profitability of the cases.
![Table 1: Running costs [26]](https://thumb-eu.123doks.com/thumbv2/pdfplayerco/285004.36332/41.918.169.772.622.795/table-running-costs.webp)
TECHNO-ECONOMIC MODEL
The following charts show CAPEX, OPEX and revenue in the mobile case (3G LTE case) that we mentioned above. Looking at Figure 30, it is important to note that user acquisition costs are considered to be the most important factors dominating the OPEX cost calculation. From Figure 31, we can assume that the majority of CAPEX is held at the BTS sites.
Note that in the sequel we will only focus on the CAPEX costs derived from the BTS used for coverage proposals, denoted as coverage BTS in Fig.31. In the model we will create and present, we will take the values of the last number as input and we will calculate the values as PI, IRR and NPV to estimate the investment plan that we want to analyze (the mobile network virtualization scenario) and finally for to compare PI, IRR NPV values from [32], with the respective values contained in our investment plan. The discount rate is assumed to be 10% and the IRR and PI are calculated using the equations described in the previous chapter.
Therefore, the total CAPEX (both coverage BTSs and other costs) is calculated as 18.1 the first year, 16 the second, 14.5 the third, etc. As already mentioned, the NPV is the sum of all the PVs for all the years in the time frame.
![Figure 30: OPEX expenditures in mobile case [32]](https://thumb-eu.123doks.com/thumbv2/pdfplayerco/285004.36332/47.918.209.765.338.661/figure-opex-expenditures-mobile-case.webp)
Economic analysis of a mobile network virtualization scenario
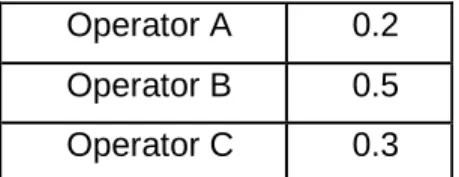
This means CAPEX is divided by 10, which is the number of years the asset (capital investment) is in use. In particular, we assume that there are three operators coined as operators “A”, “B” and “C” operating in the same market. We make this distinction by differentiating the numbers in our calculations below).
Specifically, in the first year, the coverage costs include urban BTS, second suburban BTS, and third rural BTS. We assume that the first year we do urban BTS, the second suburban and the third rural. This is of course a hypothetical scenario, as in reality additional marketing and other carrier-specific activities need to be included in the analysis.
From all the above we can conclude that in the case of mobile virtualization we can achieve better results. If we look at the IRR, it is an indicator that shows the values achieved in respect of money invested, it is greatly augmented in the virtualized scenario so that the investment can be more profitable.
SUMMARY
ACRONYMS
BIBLIOGRAPHY
12] "Teach Target: SDN-programmerbart netværk", tilgængelig på http://searchsdn.techtarget.com/definition/programmable-network-PN [Online]. 17] Ashish Narayan, "Infrastructure Sharing: Need, Need, Scope Scope and and Regulation", ITU Asia Pacific Centers of Excellence Training Course, tilgængelig på. 24] Katsianis, "Corse notes of Interdeparmental MSc in Economics and Management of Telecommunication Networks" University of Athens.Katsianis, "Corse notes of Interdeparmental MSc in Economics and Management of Telecommunication Networks".
26] Johansson, K.; Furuskar, A.; Karlsson, P.; Zander, J., "Relationship between Base Station Characteristics and Cost Structure in Cellular Systems," Personal, Indoor and Mobile Radio Communications, 2004.
![Figure 2: VPN [1]](https://thumb-eu.123doks.com/thumbv2/pdfplayerco/285004.36332/13.918.210.725.360.639/figure-vpn.webp)
![Figure 4: Controller and Forwarding Layers [1]](https://thumb-eu.123doks.com/thumbv2/pdfplayerco/285004.36332/17.918.263.673.99.296/figure-controller-and-forwarding-layers.webp)
![Figure 6: Steps when a new flow arrives at an OpenFlow switch [21]](https://thumb-eu.123doks.com/thumbv2/pdfplayerco/285004.36332/19.918.213.720.105.321/figure-steps-new-flow-arrives-openflow-switch.webp)
![Figure 9: Flow Table Entries [6]](https://thumb-eu.123doks.com/thumbv2/pdfplayerco/285004.36332/20.918.264.699.552.771/figure-flow-table-entries.webp)
![Figure 8: Path of packet via flow tables [4]](https://thumb-eu.123doks.com/thumbv2/pdfplayerco/285004.36332/20.918.187.760.277.454/figure-path-packet-flow-tables.webp)
![Figure 10: Examples of Flow Entries [6]](https://thumb-eu.123doks.com/thumbv2/pdfplayerco/285004.36332/21.918.243.707.113.591/figure-examples-of-flow-entries.webp)
![Figure 11: OpenFlow implementation [9]](https://thumb-eu.123doks.com/thumbv2/pdfplayerco/285004.36332/23.918.261.698.511.761/figure-openflow-implementation.webp)
![Figure 12: Network Functions Virtualization [11]](https://thumb-eu.123doks.com/thumbv2/pdfplayerco/285004.36332/25.918.281.621.99.351/figure-network-functions-virtualization.webp)
