I express my gratitude to my section leader Massimo Giovannozzi for his support during my research work. In addition, I express my gratitude to my friends Stella Tzioga, Georgia Kapnoulla for their support and encouragement during my internship.
CERN
Introduction to accelerator physics
Betatron tunes
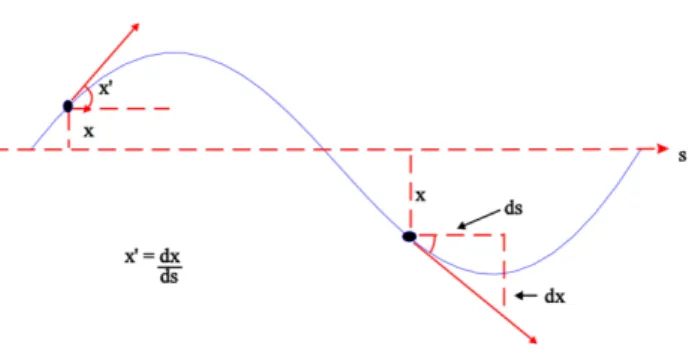
The transverse motion is represented on a "Phase Plot", points on the ellipse represent different spins of the particle. In an ideal storage ring, if there is no beam energy change, the area of the ellipse in phase space is constant.
Linear imperfections
In an accelerator to avoid additional beam losses (due to chromatic errors, which will be explained in the next chapter), dedicated skewed quadrupoles are installed to compensate for alignment errors. In general, the rotation of a quadrupole, although smaller, leads to coupling of the x and y planes, and finally the field contains a skewed component.
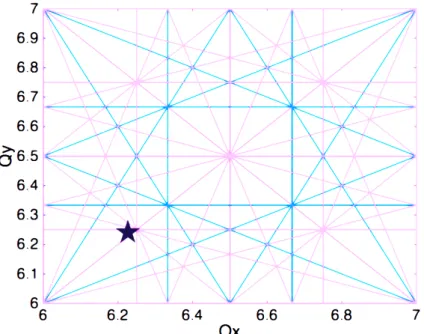
The working diagram and resonances
This has as an effect the change of the oscillation period, and thus the modification of the tune Q. To avoid resonance conditions, the frequency of the transverse movement must not be equal to (or an integer of) the revolution frequency.
Non-linearities
For example, to extract the beam in a long, slow leak, CERN scientists use third-order resonances. They also use 4th order resonances for the multi-turn extraction (MTE) scheme, which was invented to transfer the beam over 5 turns from the PS to the SPS at CERN with minimal losses.
Space charge
Resonant Multi-Turn Extraction (MTE) proposed in 2001 to reduce the losses (compared to what was observed in previous extraction schemes) in the transfer from PS to SPS. In addition to non-linear fields, there are also various collective effects that can lead to instability of particle beams.
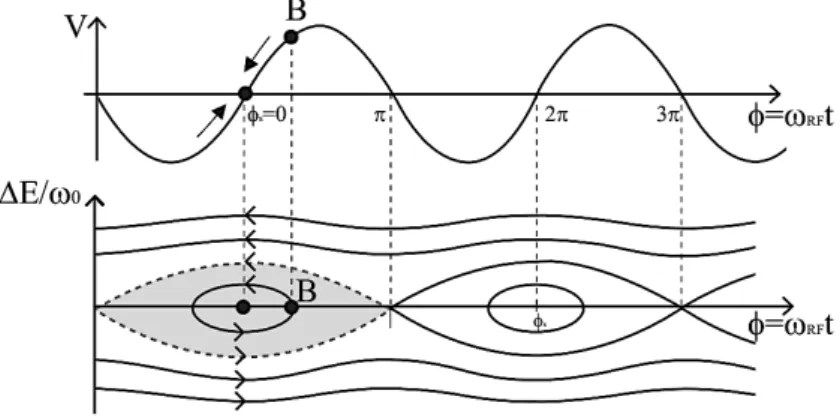
Longitudinal beam dynamics
Above transition energy (η < 0), particles with lower momentum have higher revolution frequency than that of the synchronous particle. Last but not least, the contribution of the PS to the LIU project will be discussed. In the PS, a multitude of particle beams with different properties are produced to meet the requirements of the physics users.
The reference point between the two poles corresponds to the location of the closed track. The time unit of the cycles is called basic period (BP), which corresponds to 1.2 s. The red curve is the beam intensity in number of protons and as a function of the harmonic number changed by the RF gymnastics.
After injecting both series, the beam is accelerated at the second plateau for RF gymnastics.
Beam instrumentation
The LHC Injectors Upgrade project
Motivation Goals and Outline for this thesis
To begin with the production of the LHC beams in the CERN Proton Synchrotron (PS). Experimental studies on PS have been carried out until the end of the second run in December. Repeating these measurements will provide detailed information on the magnetic stability of the machine and will thus clarify possible changes in resonance strength over time.
The thesis also aims to focus on the investigation of the resonances arising from the nonlinear magnets used for the MTE extraction. Collectively, these studies outline a crucial role for the knowledge of the existing resonances in the PS. There were a few reasons that led measurements to inevitably utilize PFW for operating point control.
In addition, tune-variation is performed exclusively with PFW due to the insufficient strength of LEQ to achieve -the desirable for the measurements - 2[GeV] energy.
![Figure 21: In a previous study done [1] experiments were carried out using the conditions de- de-scribed below.](https://thumb-eu.123doks.com/thumbv2/pdfplayerco/321411.48385/30.892.138.747.506.678/figure-previous-study-experiments-carried-using-conditions-scribed.webp)
Dynamic scans performed in 2018
- Measurement principle
- Emittance measurements
- Tune diagrams for standard configuration
- Tune diagrams for low chromaticity configuration
This limit is due to the limitation of the LEQ to reach more of the upper range, so the range of the tuning diagram is defined. Normalized lead values were calculated and then plotted to reproduce the melody diagram. In a different case, the results of the obtained data would not correspond to the characteristics of the same beam.
The final resulting tune diagram contained the mean values for the two cases described above. Loss maps would in this case contain all the resonance lines created from the measurement values. In the initial phase of the process, PFW was disabled for the scans, which were performed again in four different directions.
Finally, after data analysis, we observe the above melody diagrams. each generated from the average values of the four directions.).
Static scan at 1.4 GeV
Important remarks
Dealing with the remanence
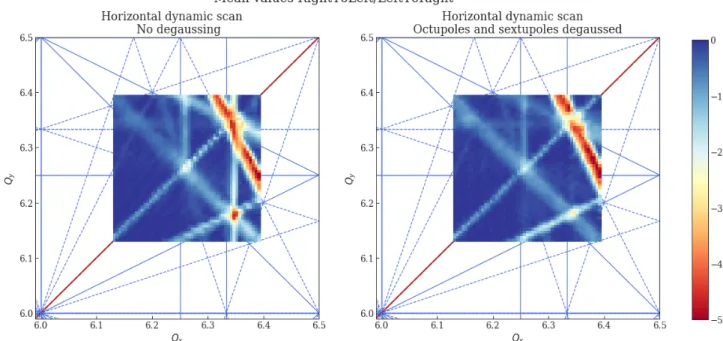
Impact of degaussing on resonances
A striking feature of the loss pattern was revealed after demagnetizing the octupoles and sex buds together. Each of the two diagrams was created from the mean values of the leads of four different directions. The data obtained from these loss map studies provide compelling evidence that the demagnetization of sextupoles, and especially octupoles, had a significant effect on the elimination of 3rd- and 4th-order resonances.
The graph relating to the amplitude of the skew resonance clearly proves that the losses after degaussing are eliminated. Only at the end of the resonance do we see some discrepancies between the two configurations. This can be reasonably assumed, since at that point demagnetization has not taken place to eliminate them, and thus they contribute to increasing the width of the skew resonance.
Unlike the coupling resonance amplitude, the FWHM maintains more or less the same value before and after degaussing.
Degaussing of the main magnets
Considerable attention needs to be paid by the time this setup would be launched as PFW comprises a large portion of PS and possible mismanagement of PFW flows could lead to problems in machine operation. In the initial phase of the process, the degaussing cycles were programmed according to the limitations of the current converter in terms of dI/dt. This was probably due to the difficulties in repeating the demagnetization many times due to limitations coming from the slopedI/dt.
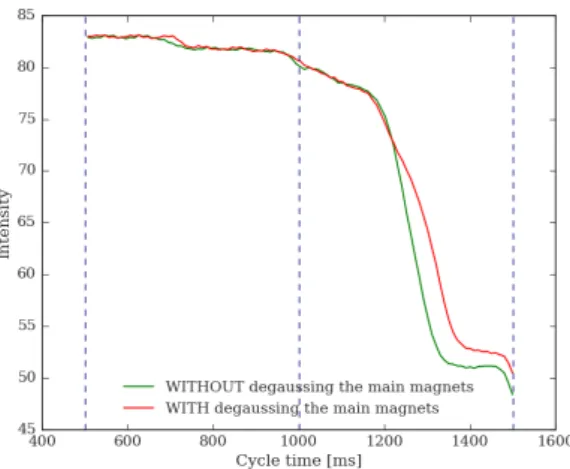
After applying the new current arrangement in the PFW, the experiment was relaunched. This means that each resonance line describes the losses that correspond to the residual intensity of the beam before it meets the resonance. Based on the evidence that the resonant excitation is different in the case of demagnetization, it seems reasonable to propose a detailed investigation of the intensity and derivative curves of losses separately.
While the observed decrease in the FWHM in the case of demagnetization, the main magnets can be interpreted as a result of the impact of the use of PFW.
Conclusion
Then either the horizontal or vertical tune in the PS varied dynamically with a constant slope so that the beam circulated around the PS for 1000[ms]. One could wonder what would be the after effects of a change in the slope of the melody ramp. To this end, dedicated tune scans were performed with the aim of investigating the effect of resonance crossing speed on the resulting tune diagrams.
To compare the behavior of the resonances, our steps proceed in the same way as the previous scans had done before. Finally, loss maps obtained from intensity derivative values in correlation with pitches, both horizontal and vertical. The vertical tuning is held constant in one plane while the horizontal pitch is dynamically changed during the cycle. Tuning scans were then performed aimed at observing the.
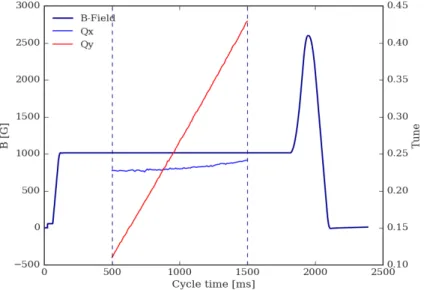
The derived values are normalized by the intensity value with the intensity value before each resonant transition.
![Figure 53: Measured magnetic field demonstrated in correlation with the three different configurations of horizontal tune scans (blue lines) against the cycle time[ms]](https://thumb-eu.123doks.com/thumbv2/pdfplayerco/321411.48385/58.892.155.488.774.1049/figure-measured-magnetic-demonstrated-correlation-different-configurations-horizontal.webp)
Correction of misalignement and closed orbit errors
As described in the previous section, the effect of wrong multipoles can lead to the reversal effect, i.e. to the appearance of additional order of resonances in each magnet. Beam orbit correction can eliminate some existing resonances, as they may arise due to return errors. It is interesting to note that the 3Qx= 1 resonance was detected excited as shown in Figure 55 (Right), while it was not observed in the left tuning diagram.
This result has further strengthened our hypothesis that the 3Qx = 1 resonance appears to be derived from the ODN magnets due to feed-down effects. These results provide indisputable evidence for the reduction of the third-order 3Qx= 1 resonance after orbit correction plus the elimination of the strength of the fourth-order 4Qx= 1 resonance.
Three different ramp durations
The voicing diagrams previously demonstrated relate to dedicated measurements which aimed to investigate the effect on resonances by changing the resonance crossing rate. Each pair of these loss maps corresponds to tune scans which have the same ramp duration. Left side plot generated from the loss rate of the derivative of intensity, while right side plot generated from the loss rate of the normalized derivatives.
We clearly observe that the tuning diagrams that are constructed from the normalized derivatives represent the resonance strength more clearly. In fact, if we compare for each configuration the two cases of tuning diagrams, we clearly see the difference in resonance intensity. From the graph that presents the derivatives, we can see that more losses occur when the resonant transition speed is faster.
![Figure 58: Here plots represent measurements in which horizontal and vertical tune scans last for 1500 [ms].](https://thumb-eu.123doks.com/thumbv2/pdfplayerco/321411.48385/63.892.174.726.223.466/figure-plots-represent-measurements-horizontal-vertical-tune-scans.webp)
Summary of the three different configurations
This Master thesis work was carried out at CERN in the framework of the LHC (Large Hadron Collider) Injector Upgrade (LIU) program and also supported by the National Technical University of Athens (NTUA). In other words this thesis focuses on the study of loss maps in the PS and gives an overview of the different resonant conditions. In this experiment, due to the nature of this resonance, much attention was paid to the main magnets, which make up the bulk of the PS.
Crossbeam splitting put into action: Key features of the multispin extraction at the CERN Proton Synchrotron. Crossbar splitting brought to life: Recent progress of the multispin extraction at the CERN proton synchrotron. Influence of the alignment of the main magnets on resonances in the CERN proton synchrotron.
This note provides information and analysis of the current status of the magnets installed at CERN's Proton Synchrotron (PSB), Proton Synchrotron (PS) and Super Proton Synchrotron (SPS) with respect to their possible performance over the next 25 years.