Focusing mainly on the influence of the C/N ratio of the system and the biodegradability of the substrates. /N ratio and substrate biodegradability are considered to be the two main factors affecting methane yield and production in the AD process.
The anaerobic digestion (AD) process
12 An important step of the anaerobic biodegradation process is the hydrolysis of the complex organic material. This method requires the organism to absorb on the surface of the particle (Angelidaki and Sanders 2004).
Conditions and parameters affecting the anaerobic digestion process
- Substrate and biodegradability
- Inoculum
- C/N ratio
- pH
- Temperature
- Inhibitors
On the other hand, a relatively small amount of inoculum can lead to overloading the process, resulting in acidification. The knowledge of the true bioavailable C/N ratio is crucial for the biological treatment of organic materials.
BioMethane Potential (BMP)
Practical determination of BioMethane Potential
The experimental determination of biomethane potential in this study was done according to the protocol for batch tests proposed by Angelidaki et al., (2009). Where the main purpose of this paper is to determine certain guidelines to researchers involved in such experiments, because nowadays anaerobic digestion technology is growing worldwide and a number of studies and research activities deal with the determination of the biogas potential of solid organic substrates.
Problems associated with practical determination of BMP
Estimation of theoretical methane potential
The ability of the method to accurately estimate biomethane yield primarily depends on two fundamental substrate properties, namely chemical composition and biodegradability. If the composition of the organic material is known and all material is converted into biogas, the theoretical methane yield potential can be calculated from eq.
Modelling of AD batch systems
Kinetics
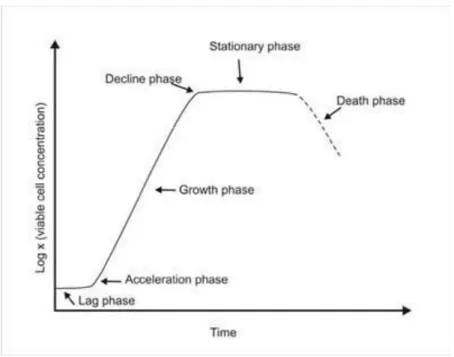
When microbes are robust and nutrient substrate is abundant, they follow a linear growth rate until substrate depletion. It is assumed that after a precise point, methanogens consume the total amount of acetate and the most degradable part of the substrate. While the lag phase in continuously fed systems is avoided, as the substrate and environmental conditions are already adapted to the feed, and the lag is dampened with hydraulics.
Furthermore, the two processes of death and respiration occur simultaneously and the rate of substrate uptake depends on substrate concentration, with kinetics similar to that of pure culture. Where 𝜇𝑥 is the growth rate of biomass X on substrate S and 𝜇𝑚𝑎𝑥,𝑋 is the maximum growth rate. However, for inhibition, the most recommended is to add each inhibition term to the basic Monod relation.
This function is commonly used to represent substrate inhibition as it allows Ks to be effectively reduced, which leads to the overall effect of causing low inhibition at low substrate concentrations and high inhibition at high substrate concentrations.
Physical-chemical equilibrium
BioModel
24 Characterization of the model follows the chain of reactions starting from the composition of the substrate and the VFA (volatile fatty acid) that are produced. This is immediately followed by inhibition of the acetogenic steps, resulting in the accumulation of propionate and butyrate (VFA accumulation). The process is self-regulating, unless the magnitude of the disturbance is greater than the system can handle.
As a result, LCFA-induced inhibition is also involved in all process steps except hydrolysis. In 1999 a more significant update was made by Angelidaki et al. (1999), including a total of two hydrolytic enzymatic steps (one for hydrolysis of indigestible carbohydrates and another for protein), eight bacterial steps (they are glucose-fermenting acidogens, lipolytic bacteria, amino acid-degrading acidogens, LCFA, propionic acid , butyric acid and valeric acid acetogens, and aceticlastic methanogens) and comprising 19 chemical compounds. Similar to the first version, however, hydrogen and glycerol conversion were not yet considered as separate elements of the model, because their conversion dynamics were different from those defined in the model.
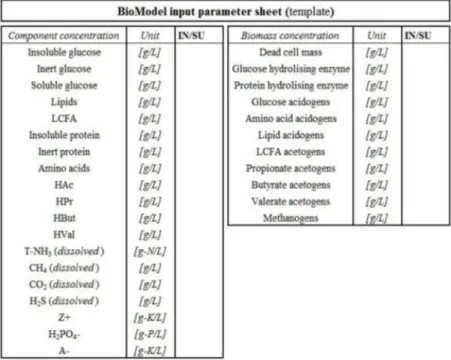
Another important aspect of the BioModel is that its parameters were expressed in grams of component per liter of substrate (g/L): the preferred way to characterize inhomogeneous substrates with high fiber and low water content (Lübken et al. 2007; Lindmark et al. . 2012).
Substrates and inoculum
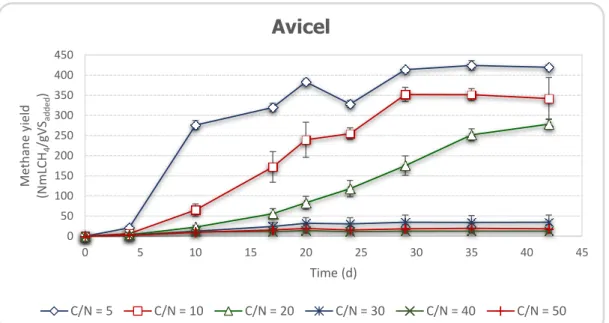
Avicel
Wheat straw
Following are the methane yield and methane production results for each case. In the case of digested fibers though the highest methane production is at the C/N ratio of 30. In this report the determination of the optimal C/N ratio is also made according to methane production and not yield.
It has been shown that in any case, by increasing the C/N ratio of the substrates, the biodegradability decreases. However, for the case of wheat straw, these had to be changed to 50% of the respective implementation. As shown in the figures, the biomodel predicts the Avicel case more satisfactorily, both for yield and methane production.
The following tables show the average values of the triplicates that were measured in each case.
Inoculum
Analytical methods
- Total solids (TS), volatile solids (VS) and ash contents
- Total Kjeldahl and inorganic nitrogen
- Protein determination
- Volatile fatty acids
- pH
- Total carbon (TC)
- Chemical oxygen demand (COD)
- Methane determination
In the next step, a FOSS Kjeltec™ 8100 distillation unit was used to extract ionized ammonia (NH4+) from both previously digested substrates and all untreated samples, as a means of determining their total nitrogen (ΤΚΝ) and inorganic nitrogen (TAN) ) to define. content, respectively. Quantification of the nitrogen content of the different sample extracts – temporarily bound in the form of ammonium borate – was carried out by back titration, using a 0.1 M hydrochloric acid (HCl) solution. In the BioModel, the insoluble protein fraction must be determined, so the true protein content of samples was estimated using an average default factor of 5.6 taken from literature (Mariotti et al, 2008) and according to the following equation.
In the case of modeling, although the total VFA concentration is calculated by summing acetate, propionate, butyrate and valerate, other alcohol concentrations are not considered due to their low importance. The SO2 is trapped and the carbon is then measured as carbon dioxide in the IR carbon cell. The purpose of the accelerator is to ignite the sample in order to oxidize the carbon and sulfur in the sample in a relatively short period of time.
It is worth noting that first dilution was followed to approach the appropriate COD range, we work on detecting the high range (100-600 mg COD/L).
BMP assays
Experimental set up 1
The first experimental setup was performed due to the need for experimental results to estimate the parameters for the biomodel. In this case, triplicates of each substrate, control and blank were added to 320 ml bottles. In this setup, we used the same amount of VS (substrate) and inoculum in each case.
As a result, the same organic load (4 gVS/L) was obtained, but to also have the same C/N ratio in each case, a small and different amount of NH4Cl had to be added. At this point, it is noteworthy that if the C/N ratio will be calculated only according to the substrates used is 30, but if it will be calculated according to the whole system (using equation (4.3.1) is almost 5 for all cases.
Experimental set up 2
BioModel implementation for batch processes
Nevertheless, the values of Lipids, LCFA, CO2 H2S, H2PO4, Z+ and A- were excluded from this work and were estimated from the literature. Since the units of the model are based on g VS/L, using equation (4.4.1) it is possible to determine values that are likely to be missing in experimental analyses, as in this case Lipids and LCFA. However, the determination of the insoluble, inert and soluble part of glucose plays a decisive role in the results.
BMP assay results
Experimental set up 1
Experimental set up 2
39 In this study, as already mentioned, the C/N ratio of the inoculum was taken into consideration in the calculation of the total C/N ratio of the system. It has also been reported that it is being determined without considering the inoculation ratio, for example in the study conducted by Nurliyana et.al., (2015). While in the report of Yoon et al. 2014), where the S/I ratio was tested for different pig slaughterhouse wastes, different S/I also lead to different C/N ratio of the system, methane production and methane yield figures did not follow the order.
In the case of dissolved fibers, however, the results are seen as more logical and quite expected, since for this substrate a low yield of methane (already dissolved) was expected, and in methane production apparently when the system is at a C/N ratio of 30 .seems to be more productive. But in the case of soluble fibers, where the pH is also in the optimal range, the VFA concentrations were significantly lower. In this case, this may lead to the conclusion that the low methane yields that have been observed are mainly due to the low biodegradability of the substrate.
Under these conditions, it is apparently not possible and reliable to compare the biodegradability of the substrates.
BioModel bacth results
Parameter estimation
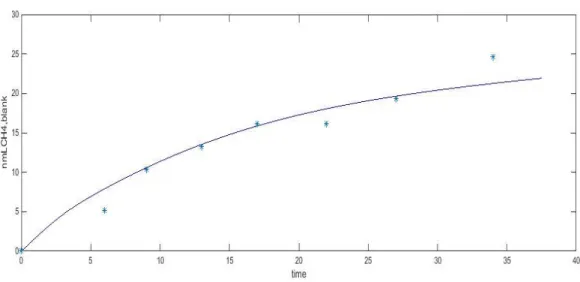
43 First, figure 11 shows the graph of the blank (the case with only inoculum) which is further subtracted from the mixture (inoculum + substrate) to get the pure methane yield and production of each case. Next, the figures of methane yield and methane production for avicel, wheat straw and digested fibers are followed. Moving to the next case where a substrate with medium biodegradability was checked, the wheat straw, as can be seen, the fit is good, but with an overestimation of the model in the stationary phase.
While in the third case, where a low biodegradable substrate was simulated, the biomodel showed less satisfactory results, especially in the lag phase prediction.
Experimental
BioModel
Promising results that may lead to a future use of the model instead of BMP tests. Assessment of the anaerobic biodegradability of macropollutants. Re/Views in Environmental Science and Bio/Technology. In the second phase of the process, the enzymatic degradation (yellow circles) of carbohydrates and proteins into either inert material or soluble glucose and amino acids is introduced.
53 In this phase, the model has an important aspect of the extent of conversion in the hydrolysis step described earlier. In contrast to the degradation of the VFAs, H2 is converted to methane (CH4) faster, which is why this step was merged with the VFA degradation in the equations describing the model. The total butyrate-degrading acetogenic step, which is derived from the combination of the butyrate step and the hydrogen utilization step.
The updated version of the BioModel in matlab follows almost strictly all the equations used in the first version of the complex model. According to Angelidaki et al, 1993, the pH of the procedure is first calculated by the ionic equilibrium of the components present in the liquid: C02, NH3, HAc, HPr, HBut, H2PO4 and Z+, An-, which represent cations and anions . respectively. To keep all results in the model, a matrix is created containing the results of the derivation and all components change according to the flow coefficient table.