Characterization of the molecular networks controlling pathogenic T cell-driven responses in multiple sclerosis using RNA-seq analysis software. EXAMINATION COMMITTEE Georgina Xanthou, researcher, assistant professor level, Biomedical Research Foundation at the Academy of Athens (BRFAA).
INTRODUCTION
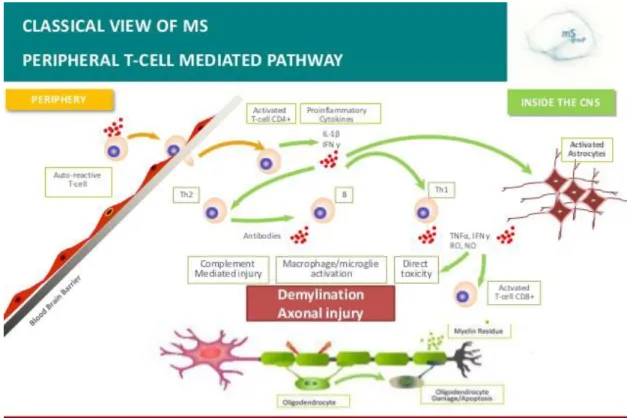
- Pathology of Multiple Sclerosis and immune mechanisms involved
- Regulatory Networks and Transcription Factors involved in Th17 cell Differentiation
- Th17 cell mediated responses in autoimmunity
- Activin-A and its role in autoimmune diseases
- Aim of the thesis: Identification of molecular mechanisms (pathways) through which activin-
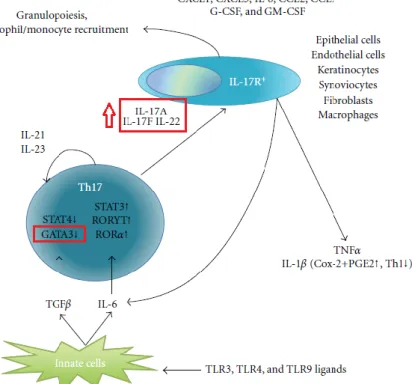
IL-1β plus IL-6 has been shown to be important in enhancing the amplification of Th17 cells and the production of IL-23 maintains the integrity of Th17 cell responses. Considering that Th17 cells have a central pathogenic role in autoimmune diseases, identifying the molecular pathways involved in suppressing their response is essential for the development of new treatments for MS.
METHODS
In vitro experiment: Creating our samples
On the other hand, control-treated (PBS-treated) T cells were used as the negative control sample. After the preparation and the RNA-sequencing analysis, the resulting data were analyzed for differential gene expression using the software presented in the following chapters.
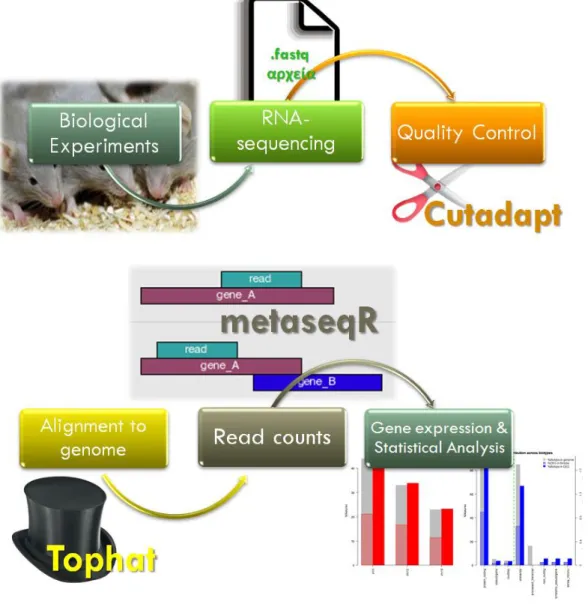
Analysis of the RNA-seq data
- Data Preparation
- RNA sequencing
- Quality Control: FastQC & Cutadapt
- Alignment with genome using Tophat2
- Differential Gene Expression by MetaseqR
- Creation of MATLAB program to identify immune relevant genes
- Ingenuity Pathway Analysis & Cytoscape for functional annotation
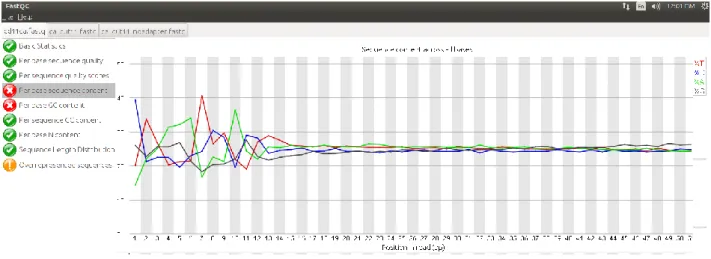
Another hint about the problematic area exists in the following image, which shows an abnormal "per base GC content", the percentage of nitrogenous bases that are either guanine or cytosine. It also provides many diagnostic figures and a list of references according to the algorithms used in the pipeline. In the picture we can see the results of this step for gene IL5RA.
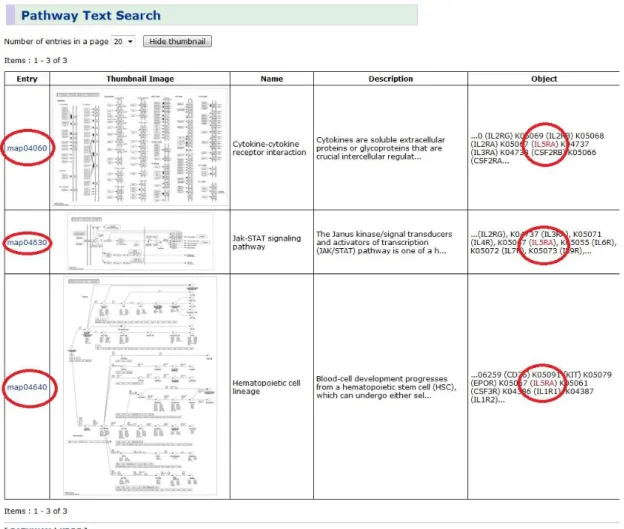
After this, the program automatically searches again for the disease word in the card description. We used the information provided to focus on the genes relevant to immunity and inflammation. The connections seem complex, but will be analyzed in depth in the next chapter.

RESULTS
Quality Assessment: Validating the results with two distinct methods
- Pairwise Comparison plot
- Biotype Detection counts
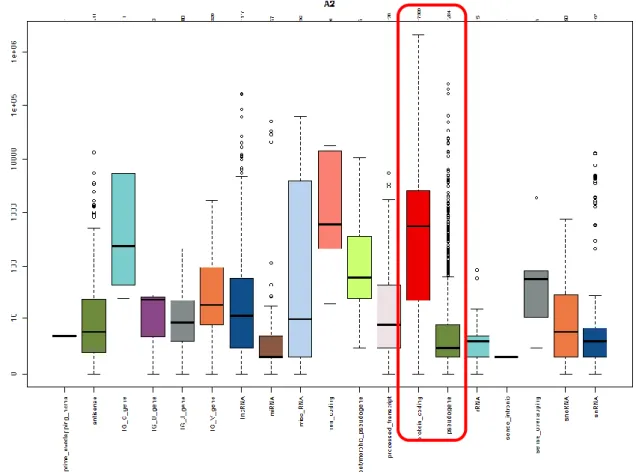
The Biotype Detection Scores boxplots are a set of quality control charts that depict both the biological classification for the detected features and the actual distribution of the read counts for each biological type. The boxplot consists of a way of summarizing the read count distribution of a sample in the form of a bar with extended lines, as a commonly used way of graphically representing groups of numerical data. A boxplot also indicates which observations, if any, may be considered outliers and is able to visually show different types of populations, without making any assumptions about the underlying statistical distribution.
Spacing between different parts of the frame helps show variance, asymmetry and identify outliers. The thick line within the colored box is the median of the observations, while the box spans the interquartile range of the observations. Unexpected results (eg, protein-coding read count distribution similar to pseudogene read count distribution) indicate poor sample quality.
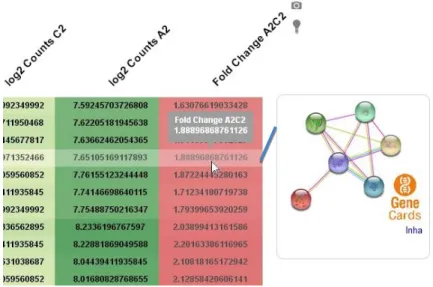
Using Heatmaps to identify the gene count and fold change distribution
On the left side of the heatmap, a tree grouping appears that groups the observations that are more similar than others. The grouping is necessary for easier comparison between observations, because similar values are grouped in the same part of the heatmap. This is also evident from the comparable staining of the cells belonging to the same group.
The user can zoom in and out on the different areas of the heatmap and move the mouse over the rows to see which gene belongs to that row. Using heatmaps we can easily identify the overall overview of the gene count analysis outcome. In this heatmap, it is clear that most genes are upregulated (fold change above zero) in activin-A treated Th17 cells, compared to control treated Th17 cells, as most of the cells with fold change in the last column are colored dark red are.
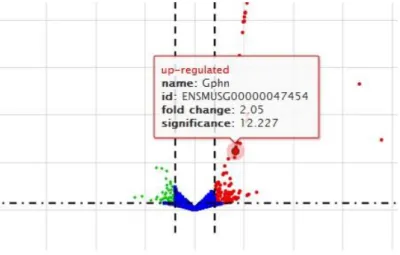
Volcano plots: A quick analysis outlook
In the following figure, we show the genes that have high up- and down-regulation values. The two genes in the orange circle were excluded from the analysis due to the extremely high fold change compared to the other values. However, the classification of the genes in an ascending/descending sort is not always obvious in a volcano plot, and therefore a heatmap is also necessary for a more complete visualization of the results.
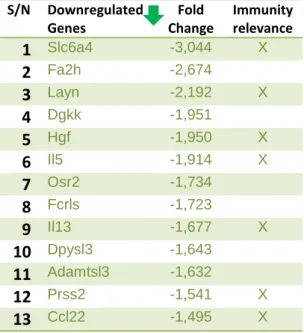
The following tables contain the differentially expressed genes from our RNA-seq analysis in two different groups: Upregulated and Downregulated. To concentrate in a smaller group of genes, we chose a cut-off in Fold Change of 1.5 for up-regulated genes and -1.5 for the down-regulated genes. Along with the name of the gene and its fold change (analysis score), we also added our evaluation of its immunological relevance, based on our research on the existing scientific literature.
Gene Connection diagrams reveal a key role for certain differentially expressed genes in the
- First network
- Second network
Abnormal functioning of these two groups is involved in the pathogenesis of Th17 cell-driven responses and consequent autoimmunity. However, if we were to analyze the up- and down-regulated genes individually and try to determine the direct relationship between them, the following figure would be more useful. Pink squares: Genes that were not expressed in our analysis associated with the Th17 lineage As we can see, 3 enzymes (GNB2, UBC FN1), 2 transcriptional regulators (RELA, SP1) and one kinase (JNK1) connect three or more differentially expressed genes from each other.
HLA-E is expressed on the cell surface and produces either an inhibitory effect on the cytotoxic activity of the NK cell to prevent cell lysis, or the activation of NK cells, depending on the receptor to which it binds. The design is the same as before, and we can observe that the only genes common to more than two differentially expressed genes are a Kinase (MAPK9), a transmembrane receptor (ITGB4) and a transcriptional regulator, RELA, which are also connected . to the Th17 cell pathway (colored pink in the figure) and needs to be further investigated in our experimental setup. Some of the intermediate genes connecting the differentially expressed genes in our project belong to groups (antigens, cytokines, kinases, etc.) that have strong immunological relevance.

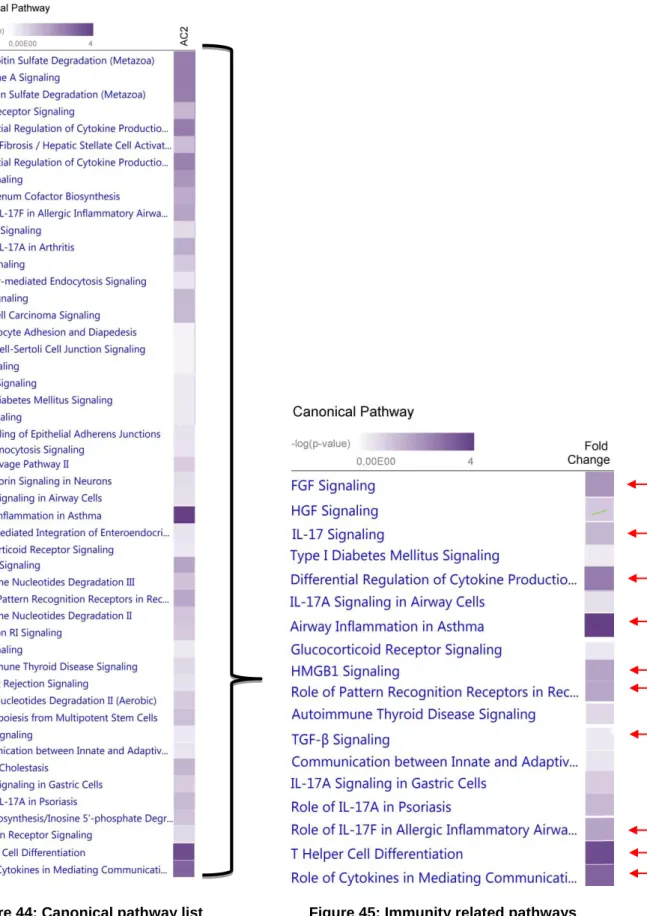
Immunological Pathways
The purpose of this heatmap is to show the researcher how many differentially expressed genes are involved in each pathway. The darker the color of the blue/purple square next to the pathway, the higher the percentage of participating genes that exist. The number of our differentially expressed genes ranges from 1 to 4 genes, but the percentage considers the total number of genes. genes involved in each pathway.
In this way, it is possible for one participating gene to score higher in smaller pathways than four genes in a large pathway. We filtered out the canonical pathways related to immunity (top image) and we see that the “Airway inflammation in asthma” pathway scored higher (very dark square on the heat map). Therefore, it is important that they are differentially expressed in this analysis, as they may help us discover new genes involved in Th17 cell differentiation.
Cell functions related to the differentially expressed genes
The next figure contains in detail a list of the mechanisms and the genes associated with them. It is clear that treatment of Th17 cells with activin-A altered the expression of several autoimmune-related genes. Various environmental factors and microbial pathogens in particular have an impact on the regulation/expression of genes involved in autoimmune processes.[7] Therefore, disruption of the normal function of an antimicrobial response may be part of autoimmune reactions.
For example, it is possible that microbes produce molecules that mimic self-antigens, which activate T cells against self-antigens, thereby contributing to tissue damage and autoimmune responses. Histone proteins associated with DNA (histone modifications) regulate heritable changes in gene activity and expression that occur without change in DNA sequence and they play a major role in Th17 differentiation. The upregulation of histones may be another clue that activin-A may regulate the Th17 differentiation in MS.
Molecular networks related to the genes identified in the analysis
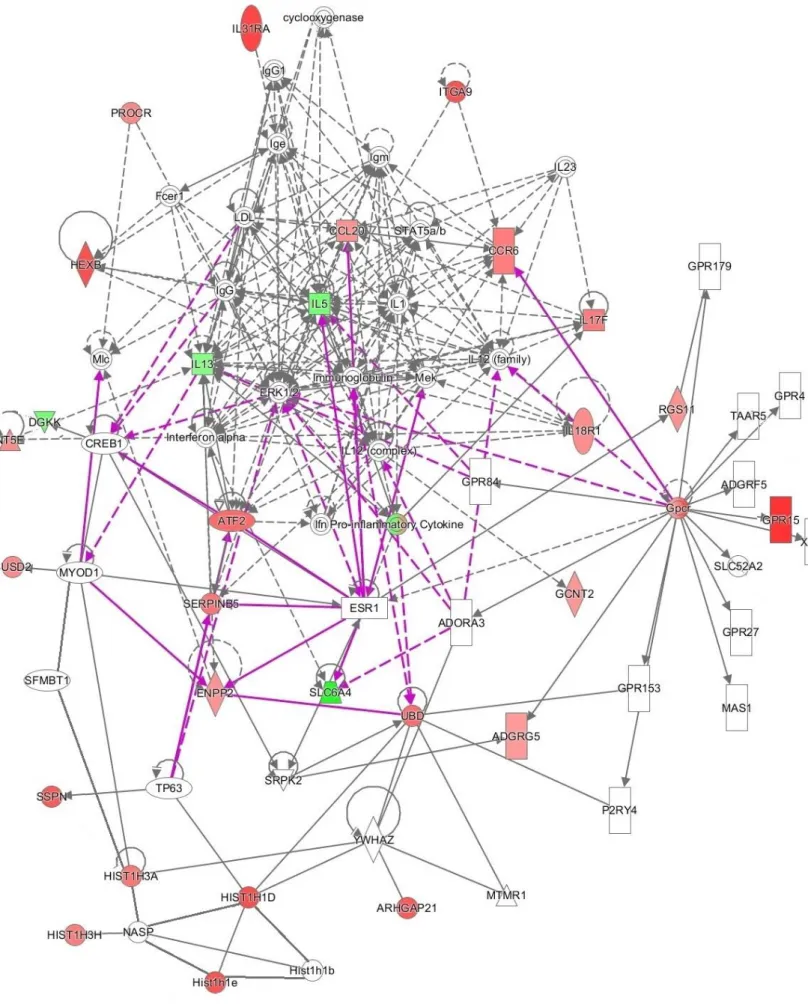
In this network we can see different sets of genes participating in the same process. Interleukins (IL1, IL5, IL13 etc.) and chemokines (CCL20, CCR6) were expected to be expressed in this network, but as we can see, activin-A also affected the expression of other genes, such as COX and GCNT2 neurotransmitters, such as SLC6A4 . , which was unexpected and gives us new data for further investigation.
Activin-A treated T cells exhibit a Th17 associated gene signature profile
Gene pathway analysis reveals activated genes with possible inhibitory effects on Th17 cell
It was expected that interleukins (IL1, IL5, IL13 etc.), histones (HIST1H3A, HIST1H1E etc.) and chemokines (CCL20, CCR6) would be differentially expressed in this network and have a great significance in Th17 cell differentiation. Our data show that activin-A inhibits Th17 cell responses possibly by regulating these gene networks. Most of them are also differentially expressed, suggesting the potential involvement of histones in mediating the inhibitory effects of activin-A on Th17 cell differentiation.
Genes such as SLC6A4, which is downregulated, have a critical position showing involvement in autoimmune diseases and may indicate a newly recognized role in Th17 cell-related pathways. The appendix details the differentially expressed genes between control samples of activin-A-treated Th17 cells in terms of their biological function in general and their immunological properties. We also discuss their possible implications for the inhibitory effects of activin-A on Th17 cell responses.
CONCLUSIONS
In general, autoimmune diseases depend on the mobility of the Th cells (cell movement functions) that cause inflammation in the tissue. Inflammatory response mechanisms are a central process in the pathogenesis of autoimmune diseases, such as MS. This means that the involvement of activin-A in the process may influence central pathways involved in Th17 differentiation.
Th17 cytokines IL-17A and IL-17F play a critical role in the activation and recruitment of neutrophils mainly through the induction of CXC chemokines. It also plays a major role in the regulation of eosinophil formation, maturation, recruitment and survival. It has been shown that GPR15 plays a major role in T-cell localization and function in the colon.
There was a positive correlation between higher numbers of SERT(+) and IL-17(+) cells in the lupoid type, while lower numbers of SERT(+) cells were significantly related to lower percentages of CD25(+) cells in usual type of leishmaniasis. These results may indicate a role for SERT, Th17 and Tregs in the pathogenesis of lupoid leishmaniasis.