The first chapter is a bibliographic overview of research and data on the sweetener stevia, as well as the analysis of the beverage industry in Europe and Greece. It also looks at the total demand for soft drinks and the supply of soft drinks, in particular the structure and structure of the sector, as well as the distribution networks through which the products are offered to consumers. 120 consumers from different regions of Greece participated in the study and were given a suitable questionnaire to investigate the consumption of stevia drinks and the consumption of beverages by Greek consumers.
Presentation of the Dissertation Subject
Objectives and contribution of the dissertation
Which brands do Greek consumers prefer among the companies that sell soft drinks in Greece? The findings and results of the present thesis will contribute to the knowledge of scientific research in the soft drinks sector in Greece.
Methodology used throughout the dissertation and Limitations
The research tool of this study was the questionnaire in printed and electronic form, since the collection of a large amount of information and observations from a large number of people is achieved in a short time. On the other hand, the disadvantage is the fact that in closed questions the respondent's choice and freedom of expression are limited to a minimum, and the answers provided cannot be exhaustive in terms of covering the topic. Educational evaluation is used when the examinee is evaluated with a scale formulation (how well) is the evaluator's satisfaction with the way the examinee performed a task that he was asked to perform.
Literature Review
Introduction
General Characteristics of the Beverage Branch
Significant changes in the beverage market came from the introduction of isotonic soft drinks in the early 1990s, and at the end of the same decade energy drinks appeared. These two categories have been major innovations in the beverage industry, have been accepted by the consumer community and are one of the most developing beverage markets. At the same time, companies in the industry have in the last few years invested a larger selection of soft drinks in the market to try to attract more consumers.
Stevia Background
- What is stevia plant
- Use of Stevia and its Benefits
- Future of Stevia in global market
The climate of the region, the eating habits of consumers and the modern lifestyle are some of the factors that play an important role in the demand for soft drinks. The most fundamental characteristic that determines the demand for soft drinks is seasonality. In which months of the year do Greek consumers buy more soft drinks, as previously mentioned, from April to October, the consumption of soft drinks is much higher in Greece due to the high temperatures, especially in summer.
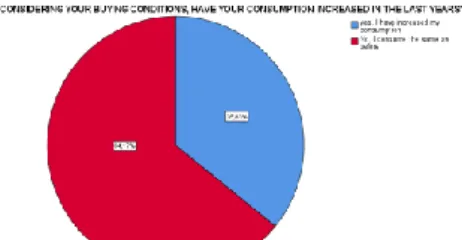
Only 8% of the participants answered that they are most likely to order refreshments with stevia. Also, regarding whether the consumption of soft drinks in Greece has increased or decreased, we observe that only 35% of the participants answered that they have increased the consumption of soft drinks.
Stevia Characteristics
Trends and developments
- The Movements Of Competitive Companies In The Sector Of Soft Drinks In Greece 22
- What do the 2015 balance sheets
- The financial figures of the industry
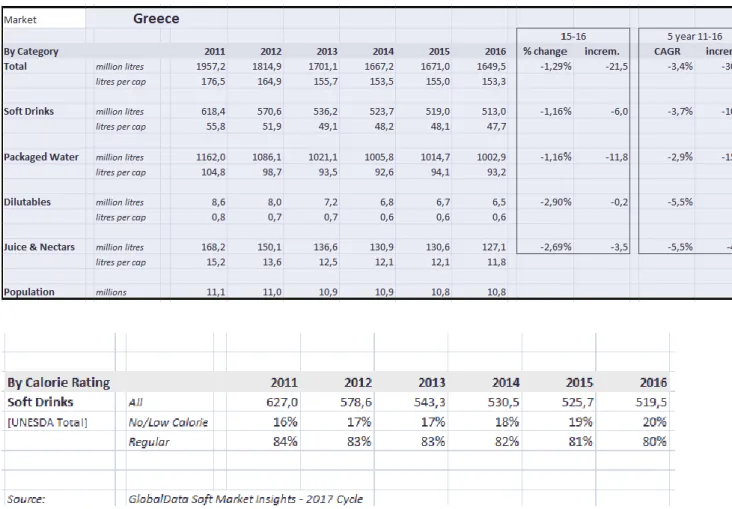
- Consumption of soft drinks in Greece (2011-2016)
Stabilization of sales and improvement of the loss-making pre-tax effect was recorded by the industry in 2015. Trade flows (import and export) of non-alcoholic beverages are a small part of the domestic market, as the production of non-alcoholic beverages and the bottling industry have a local development in European level. The analysis of the economic consequences showed that the sector of non-alcoholic beverages (except bottled water) production and distribution of non-alcoholic beverages is estimated at 2.243 million. EUR.
Characteristics of the Branch of Soft Drinks
An equally important role in the quality and taste of the drink is played by the quality of the water used in its production, since about 85% of its ingredients are water. In the early 1990s, there was a big change in the beverage industry, as isotonic sports drinks were introduced to the Greek market, and a similar change was introduced at the beginning of the next decade with the introduction of energy drinks to the market. In addition, in the past few years, industrial companies have increased the availability of light soft drinks in the market to attract more consumers.
Market Description
- Factors influencing demand
- Problems faced by the industry
- Offer
Finally, a major factor contributing to the increase in demand for soft drinks during the summer months is the increase in tourist traffic. Due to the large number of tourists arriving in the country, the demand in the juice soft fruit sector is growing as there is an increase in the number of potential consumers of these products. Www.icap.gr) All soft drinks have indisputably entered the consumption habits of the population through intensive advertising and promotional efforts for these products.
The total number of municipalities selected in the survey amounted to 337 and the settlements in 360. The survey shows that in relation to the previous survey (2015) there is a decrease in the monthly expenses in euros for mineral water, soft drinks and juices of the order of -3.6%, At the same time in the 2015 food distribution survey, juices occupy 3.9%, while in 2015 the survey shows a slight decrease of 0.2%. Businesses expect sales growth in the summer months, but both tourists and Greek consumers have significantly reduced their costs due to the economic crisis and the resulting decrease in purchasing power.
In addition, sales of carbonated soft drinks fell by 13%, while sales of soft drinks fell very slightly, in the order of 0.1%. Finally, in light of the general economic climate, consumers are increasing their trust in private label products, which are sold at lower prices than branded products (Rivard et al, 2012). In addition, the availability of private label products by major retailers increases competition in the industry due to the low price of these products.
Companies in the soft drink industry cannot sell their products to anyone because every consumer has different tastes and different ways of satisfying their needs.
Market segmentation
For these reasons, it is necessary to segment the market, which separates the market into distinct customer segments, which themselves follow similar behaviors (Abdullateef, 2012).
Demographic Segmentation
Research Design
- Introduction
- Execution & Limitations
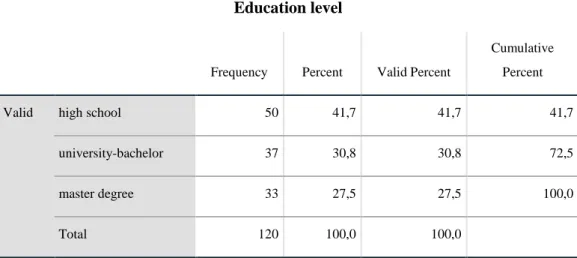
- Characteristics of the sample
- Research Method
- Questionnaire
The questionnaire asked to complete the sample is listed at the end of the work in Appendix A. The main factor in choosing sampling instead of inventory is that it is inappropriate to make an inventory either for objective reasons, or for reasons of. because the cost of an investigation is usually proportional to the number of cases under consideration. Precisely because it is aimed at fewer people, it is possible to collect information about many more characteristics of the respondent population.
As strange as possible, it is possible to get more accurate results with a sample survey. If the value of the characteristic we are measuring becomes very small and very high, the extreme cases must be isolated and studied separately, because otherwise our conclusions will be completely wrong. Therefore, an appropriate questionnaire was designed and quantitative method was chosen to apply in the survey.
It is based on numerical data or characteristics of cases or subjects that show the connection between social reality and theory. The questionnaire was designed to investigate the consumption of soft drinks in Greece, and in particular the soft drinks containing stevia. With this question, we will draw useful conclusions about the total costs per month that Greek consumers spend to buy soft drinks.
As it is known, advertisements have a great effect on consumers, especially advertisements shown on television.
Presentation Of Results and Data Analysis
A minor consumption is also observed in the soft drinks of the brand “Loux”, EPSA and VIKOS. This is also confirmed by our research, as 50% of participants drink 2-3 times a week, and 20% of participants drink soda more than 3 times a week, while another 13% drink once a month. 43% of Greek consumers choose soft drinks with stevia to reduce sugar consumption.
Less important reasons of stevia preference in soft drinks are that they believe that stevia is part of a healthier diet or that they just see it as an alternative drink. 40% of participants consume soft drinks with stevia, and another 40% consume normal types of soft drinks. An important part of the participants (47%) buy soft drinks once a week, 31% buy soft drinks once in 15 days, while 20% buy soft drinks once a month.
The majority of Greek consumers (51%) prefer to buy soft drinks in supermarkets, while 34% buy soft drinks in mini markets. The majority of Greek consumers (77) think that soft drinks in places like cafes or bars are expensive. As for the association between gender and frequency of soft drink consumption, it is not significant.
Regarding the type of soft drink consumption, there is a slight significance, as women consume soft drinks more often compared to men. As expected, it seems that consumers who know the difference between the glycantic substances that soft drinks contain prefer the most of soft drinks with stevia, while consumers who do not know the differences in substances prefer more normal types of soft drinks, as the table below provides . In our survey, this is confirmed, as Woman said that advertisements of soft drinks affect them more than men.

Conclusion and Suggestions for Further Work
More specifically, green cola, coca-cola zero, coca-cola light and stevia cocacola are at the top of Greek consumers' preferences. Coca-Cola Hellenic Bottling Co SA and PepsiCo IVI SA remain the main soft drinks multinationals in Greece, with the former also being the leading player. It is also interesting that 95% of the correspondents consume at least one brand of soft drink.
Regarding the frequency of refreshment consumption in Greece, as expected from other past research, we find that 50% of participants consume 2-3 times per week, and 20% of participants consume more than 3 times per week. drinks soft drinks every week. another 13% consume once a month. When answering the third survey question about the type of soft drinks (regular, stevia, other sweeteners) preferred by Greek consumers, 40% of participants consume soft drinks with stevia, and the other 40% consume normal soft drinks. The above is also confirmed by official surveys showing that the number of soft drinks in Greece decreased between 2011 and 2016.
Finally, the main reason why Greek consumers drink soft drinks with stevia is that they want to reduce sugar (43%) and 16%. Comparative study with other studies related to consumption of soft drinks in other countries. Jamie Zoellner, Erin Krzeski, Samantha Harden, Emily Cook, Kacie Allen, Paul A.(2012) Estabrooks, Qualitative Application of the Theory of Planned Behavior to Understand Beverage Consumption Behaviors among Adults, Journal of the Academy of Nutrition and Dietetics.
My name is Ilias Skokos and in the context of the completion of my postdoctoral thesis entitled "Drinking Beverages in Greece" from the Department of Social Sciences of the Open University of Greece, I would like to request you to dedicate 5 minutes of your time to complete the following questionnaire.