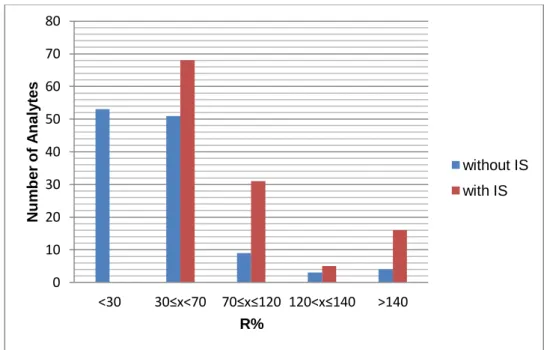
In terms of accuracy, positive ionization with LC-ESI-QTOF and GC-APCI-QTOF proved to be equivalent. 110 Figure 5.4: Comparison of recovery percentages using IS or not in GC-APCI-QTOF.
PESTICIDES
Introduction
The use of pesticides, especially synthetic ones, despite the benefits of improving agricultural productivity, protection of crop losses, vector-borne disease control (e.g. malaria), poses risks to non-target organisms, including humans, but also has an impact on the environment of surface water pollution, groundwater pollution, soil pollution and air pollution [4][5]. Therefore, strict legislation and other measures regarding the protection of public health have been promoted by national and international authorities.
History of Pesticide Use
The fungicide families triazole, morpholine, imidazole, pyrimidine and dicarboxamide were also introduced during this period. Many of the new agrochemicals can be used in grams rather than kilograms per hectare.
Classification of Pesticides
- Based on their Action on Target Organisms
- Based on their Chemical Group
- Based on their biochemical Mode of Action (MoA)
- Based on their hazzard
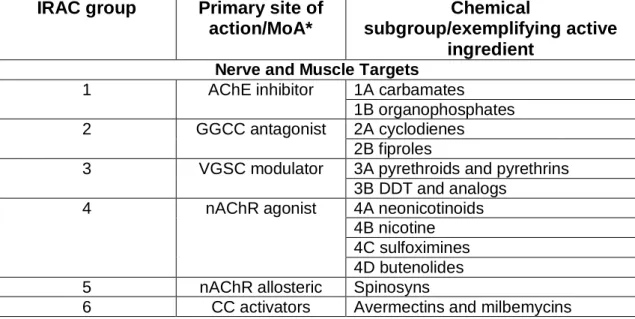
The MOA Classification Scheme (Table 1.2) is based primarily on the target site, and secondarily on the novelty of the chemistry, differential action at the same target site, and/or susceptibility to metabolic resistance mechanisms. Likewise, compounds that act at different sites on the same target are also placed in different groups.
Consequences
- On Human-beings
- Acute toxicity
- Long-Term Health Effects
- On Environment
- Water Contamination
- Soil Environment
- Atmosphere
- Nontarget Organisms
Residues of these pesticides have been detected in the food chain and in various biological media in humans. A large fraction of the pesticides used for agriculture and other purposes accumulate in the soil.
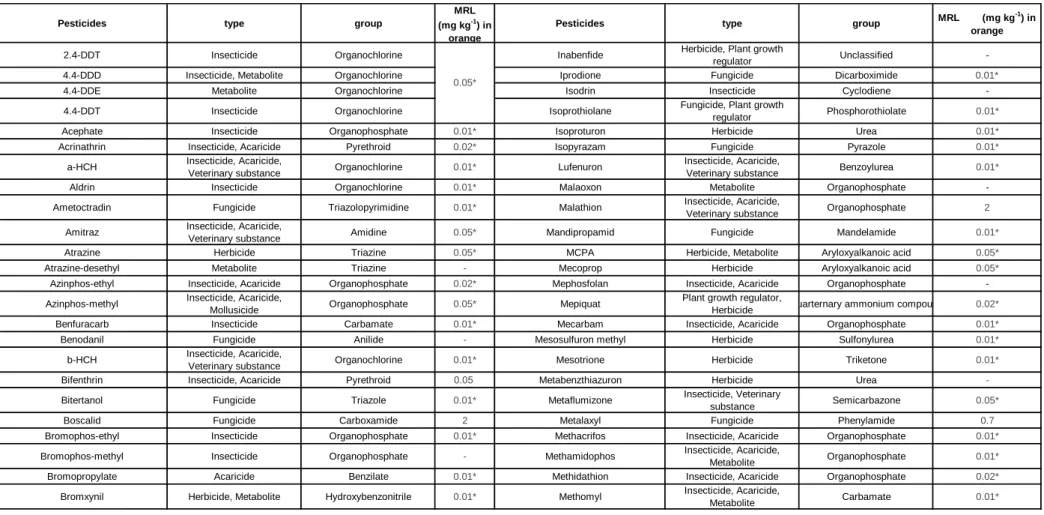
Legislation
For crops grown outside the European Union, MRLs are established at the request of the exporting country [18]. Regulation (EC) No 396/2005 of the European Parliament, on MRLs of pesticides in or on food and feed of plant and animal origin and amending Directive 91/414/EEC of the Council and its implementing regulations,.
Method Validation
- Chromatographic Separation and Determination
- Identification using Mass Spectrometry
- Analytical method validation and performance criteria
- Linearity
- Estimation of Matrix Effect
- Limit of Detection (LOD) and Limit of Quantification (LOQ)
- Trueness
- Precision
- Specificity
Reference spectra for the analyte should be generated using the same instruments and conditions used to analyze the samples. Extracts of blank matrix, preferably of the same type as the sample, should be used for calibration.
Determination of Pesticides in Oranges
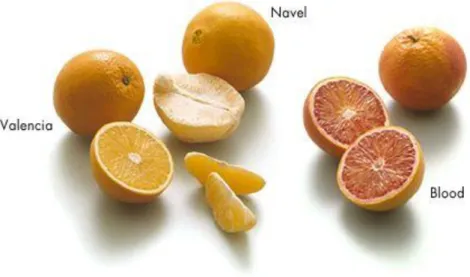
In general, the Orange
Oranges can be eaten fresh or as a dessert fruit that can be eaten out of hand. Also as processed products such as juice (fresh, chilled, frozen, canned, mixed or concentrated), syrup and juice, segments and peel oil, or essence. After the juice is extracted, residues remain that can be a source material from which valuable by-products can be produced.
The production of fruit syrups and juices, jams, jellies, marmalades, chutneys and sauces are traditional methods of preservation. Choline helps with sleep, muscle movement, learning and memory and maintains the structure of cellular membranes, aids in the transmission of nerve impulses, aids in the absorption of fat and reduces chronic inflammation.
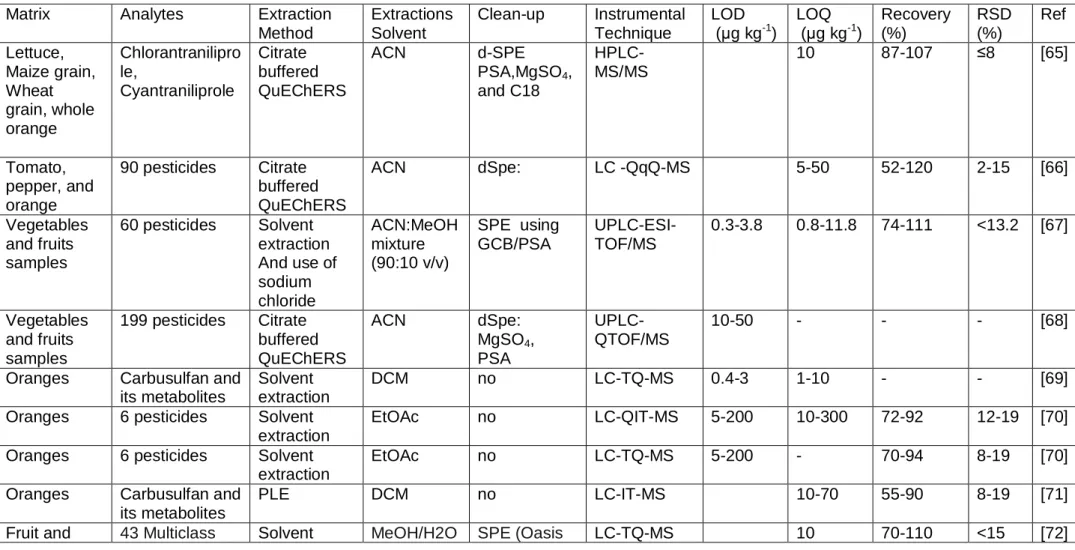
Sample Preparation Techniques
- Solvent Extraction
- Solid Phase Extraction (SPE)
- Quechers
SPE (Solid Phase Extraction) is one of the most used procedures for the purification, extraction and preconcentration of pesticide residues from different samples. The original procedure consists of extracting the homogenized sample by hand squeezing or vortex mixing with an equal amount of acetonitrile to provide a final extract sufficiently concentrated to remove the need for solvent evaporation. Gram quantities of salts, such as sodium chloride and magnesium sulfate, are then added to the sample, with mixing, to promote partitioning of the analytes between the aqueous residue and the solvent.
After simple vortex mixing and centrifugation, resulting in perfect physical separation of the phases, purification and removal of residual water is performed simultaneously using a rapid procedure, called dispersive solid phase extraction (dSPE), in which a. The main disadvantage of QuEChERS is that for one gram of sample per milliliter of final extract, the concentration of the extract is lower than for concentrated extracts obtained using most traditional procedures [45][46].

Chromatographic Techniques
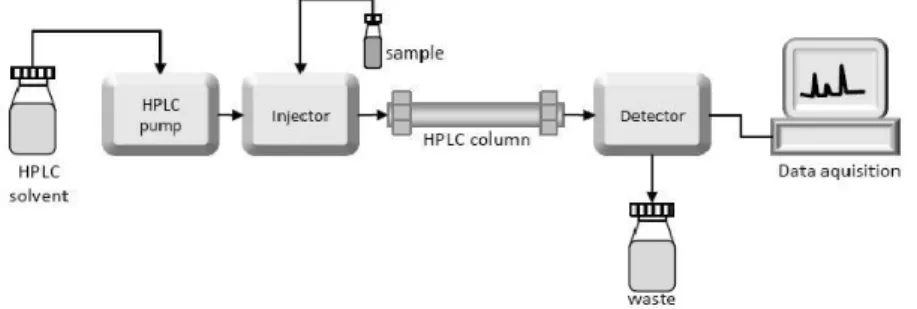
- Principles of HPLC and Instrumentation
- RP-UPLC
- Principles of GC and Instrumentation
- GLC
In RPLC, the stationary phase (Figure 2.4) is less polar than the mobile phase and the interaction between analyte and stationary phase is predominantly hydrophobic (non-polar). The most commonly used stationary phase in RPLC is silica gel containing octadecyl silica chains. The liquid stationary phase is coated on the inner wall of the capillary column and the inert mobile phase flows through the hollow tube.
Wall-coated columns consist of a capillary tube, the walls of which are coated with liquid stationary phase. The chemical nature of the stationary phase has a great influence on the quality of the separation.
Mass Spectrometry
- Ionization Techniques
- Electron Impact Ionization (EI)
- Chemical Ionization (CI)
- Atmospheric Pressure Chemical Ionization (APCI)
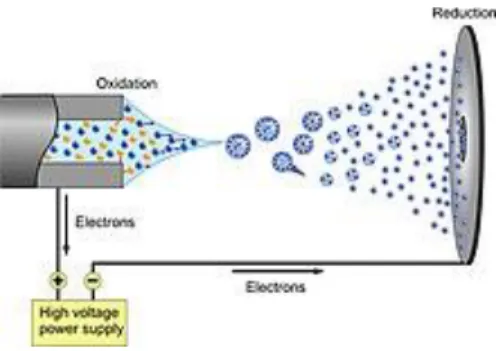
- Electro Spray Ionization (ESI)
- LRMS
- Quadrupole (Q)
- Triple Quadrupole (TQ or QqQ)
- Ion Trap (IT)
- HRMS
- TOF
- Orbitrap
- Hybrid Instruments
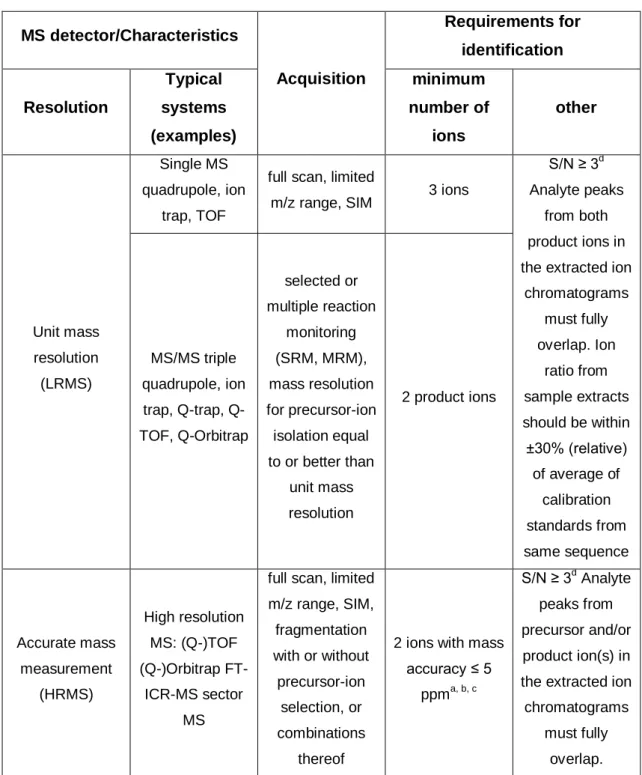
The high collision frequency results in a high ionization efficiency and thermalization of the analyte ions. LRMS measurements provide information about the nominal mass of the analyte, i.e., the m/z for each ion is measured in single-digit mass units. HRMS provides information about the exact mass of the analyte, i.e., the m/z of each ion is measured to four to six decimal places.
This cycle is repeated with a repetition rate depending on the flight time of the highest mass to be recorded. Due to this phenomenon, the ions with the same m/z value with different initial energies hit the detector almost simultaneously.
Acquisition Modes in HRMS
- Data Dependent Acquisition (DDA)
- Data Independent Acquisition (DIA)
This recording mode can be considered as a simple and generic mode which is based on non-specific CID. This acquisition provides accurate mass data for parent compounds and fragment ions in a single run using two alternating scans, one at low and one at high collision energy. A full-scan spectrum is obtained, providing information on the parent ion (the (de)-protonated molecule) and, in some cases, the adducts and in-source fragments.
Using high energy (HE) in a collision cell, fragmentation is performed and a spectrum similar to MS/MS experiments is obtained.
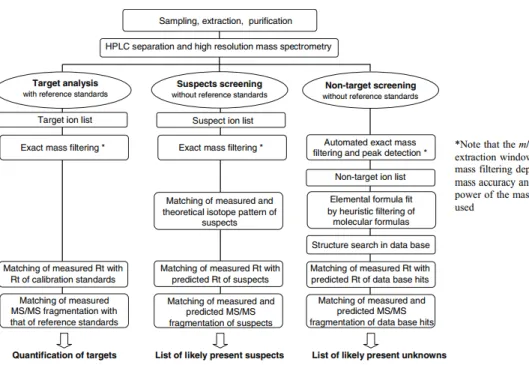
Data Analysis Workflows in HRMS
- Target screening
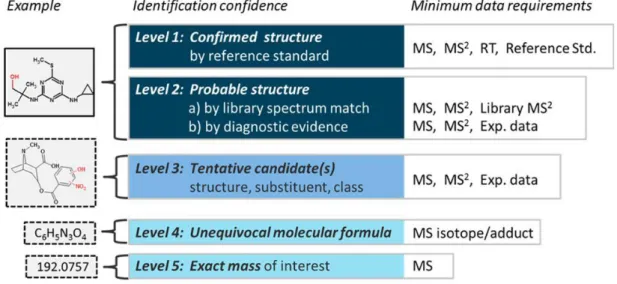
Confidence in the identification procedure
- Confidence in target screening
Methods for pesticide analysis have made considerable progress in recent years, largely due to developments in chromatographic instrumentation. The extraction process is the first and main limiting step in pesticide residue analysis. The most commonly used GC detectors are element selective detectors such as ECD, NPD, FPD face matrix related interference issues while ELSD, FID, TSD, AED find limited use.
Most studies to date on the determination of pesticides in fruit have used LRMS such as Q, TQ and IT analysers. HRMS analyzers such as TOF, Orbitrap or hybrid systems such as QTOF have not been widely explored for target screening, but have been used more for suspect and non-target screening [45][64].
Scope and Objectives
Development of a multi-residue method for the determination of pesticide residues in orange based on Quechers AOAC using UPLC-ESI-QToF, GC-APCI-QToF techniques. The target screening in a representative number of orange samples to investigate whether pesticide residues are below legal limits.
Materials and Methods
- Chemicals and Reagents
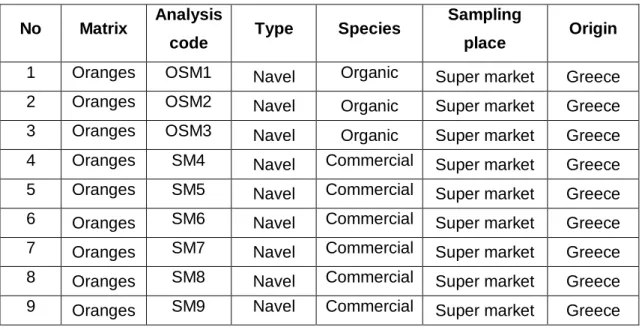
- Sampling and Storage
- Sample Preparation
- HRMS Analysis
- UHPLC-ESI-QTOF
- GC-APCI-QTOF
- Method Validation
- Target screening of Orange Samples
- Development of a GC-APCI-QTOF database
- Qualification
- Quantification
For the positive ionization mode (PI), the mobile phases are water:methanol 90:10 (solvent A) and methanol (solvent B), both modified with 5 mM ammonium formate and 0.01% formic acid.
Results and Discussion
General Observations
Internal Standard
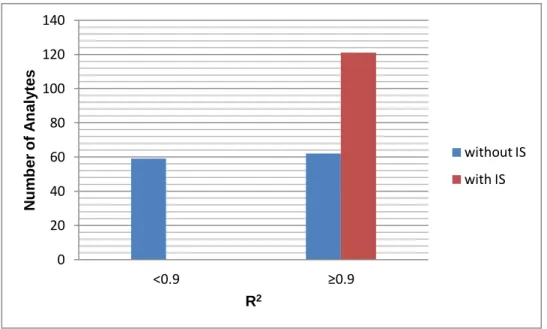
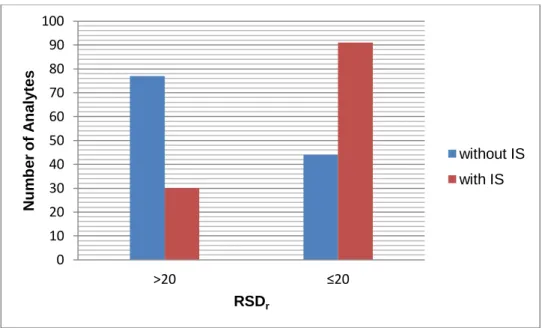
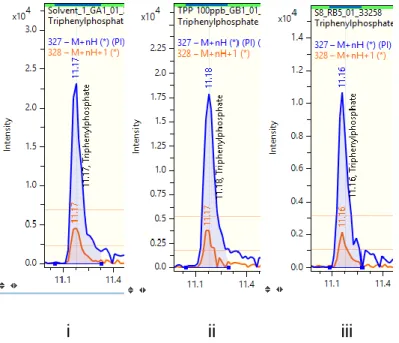
However, in LC-ESI-QTOF it was observed that TEC had contaminated the system Figure 5.1 as in the solvent samples (not with TPP drops) there were peak areas for TEC that agreed in all identification criteria. Moreover, the carryover was much greater than the amount we noted in the sample. i ii iii. The result was that all analytes improved the coefficient of determination in their curves using relative areas. In the repeatability test, the relative standard deviation (RSDr) for the spiked sample at the level of 10 μg Κg-1 is compared.
However, not using IS the percentage of recoveries above 140% is only 3% of the analyzes while the use of TPP increases to 13%. In conclusion, TPP can be used as an internal standard in GC-APCI-QTOF analysis because it improves recovery and repeatability criteria for most analytes and linearity for all analytes.
Method Validation
- Retention Time (Rt)
- Linearity of Calibration Curves
- Matrix Effects
- Method Accuracy
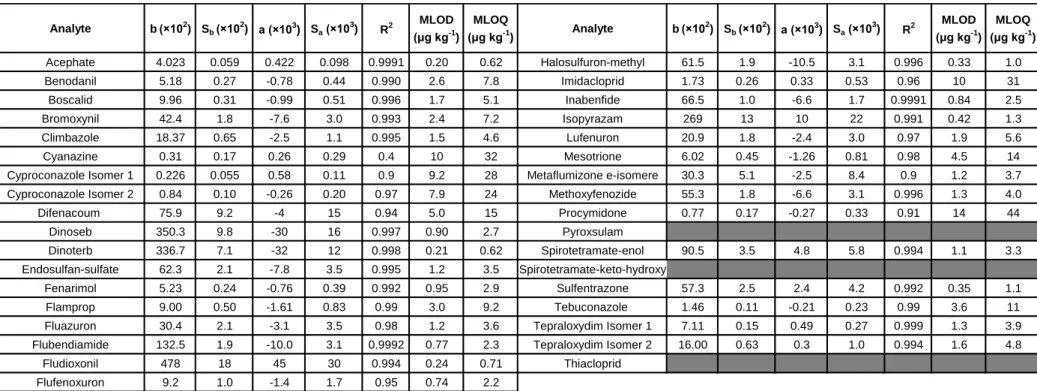
- Limits of Detection and Quantification
- Precision
- Repeatability
- Intra-laboratory Reproducibility
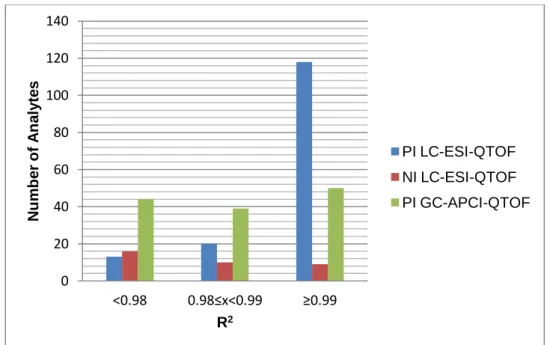
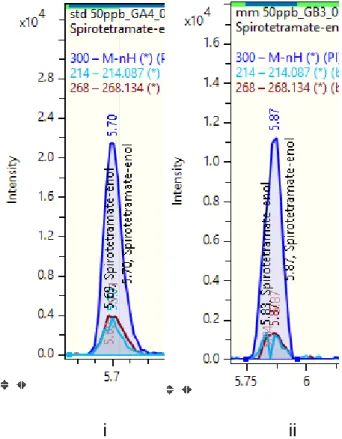
Some of the analytes are proton acceptors (more sensitive in positive ionization) while others are proton donors (more sensitive in negative ionization). More specifically, the MLOQs below 10 μg kg-1 of the analytes were for the analytes in positive and negative ionization with LC-ESI-QTOF and positive ionization with GC-APCI-QTOF, respectively. For the level of 10μg kg-1, 90% of the analytes' RSDr analyzed with positive ionization with LC-ESI-QTOF is below 20%.
For negative ionization by LC-ESI-QTOF and positive ionization by GC-APCI-QTOF, the percentages were 75% and 74% of analytes, respectively. Specifically, 96%, 84%, and 91% are the percentages of analytes that have RSDr below 20% for positive and negative ionization by LC-ESI-QTOF and positive ionization by GC-APCI-QTOF.
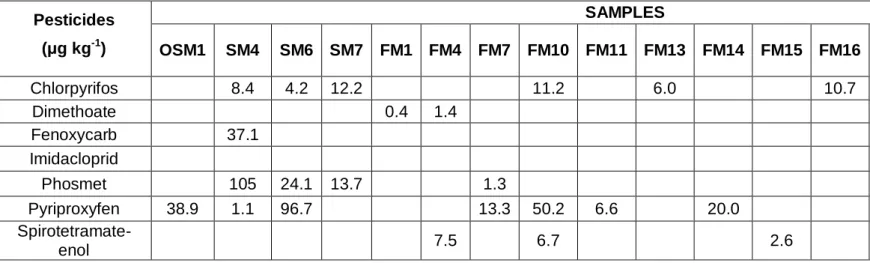
Application of target screening in Real Samples
Compartment dependent concentration of pesticides
From the first piece of each orange, we cut the peel, collect them and homogenize. After target screening data analysis, the results were that the concentration of Chlorpyrifos is not equally distributed in the individual parts of the orange. In Figure 5.23, it is observed that there is most of Chlorpyrifos in peel.
The concentration in the peel is approximately twice the concentration in the whole mass. This happens because the total concentration is diluted as in the edible part and the juice concentration of Chlorpyrifos is very low.
CONCLUSIONS
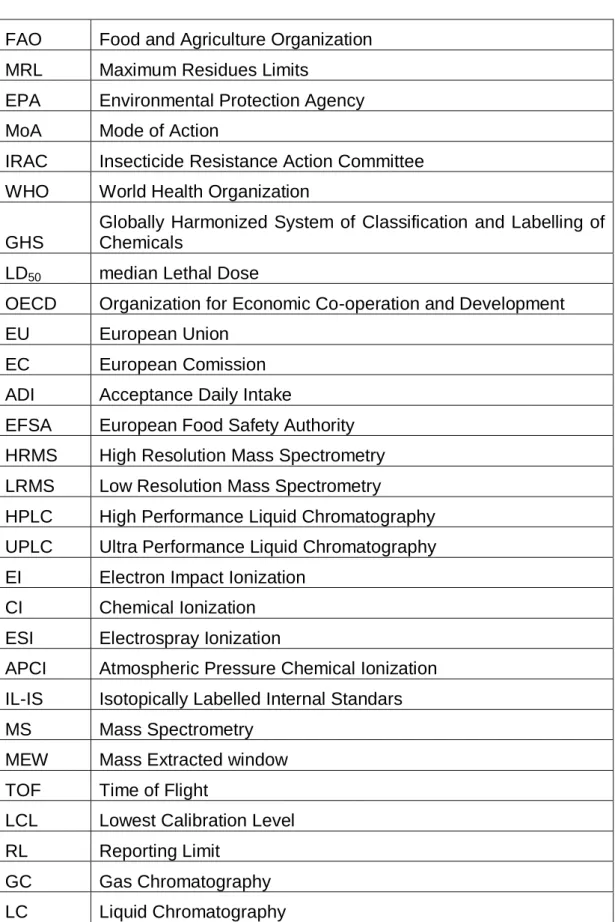
EFSA European Food Safety Agency HRMS High Resolution Mass Spectrometry LRMS Low Resolution Mass Spectrometry. LOQ Limit of Quantification RSD Relative Standard Deviation SPE Solid Phase Extraction LLE Liquid Liquid Extraction.
Economou, Mass spectrometry for the analysis of pesticide residues and their metabolites, John Wiley & Sons, 2015, pp.131-160. Riddhi, Rapid determination of pesticide residues in fruits and vegetables, using ultra-high performance liquid. Zupan, Multiresidue method for the determination of 90 pesticides in fresh fruits and vegetables using solid phase extraction and gas chromatography-mass spectrometry, Journal of Chromatography A, vol.
Hori, Determination of Neonicotinoid Pesticide Residues in Chromatography Mass Spectrometry, Journal of Agricultural and Food Chemistry, 2003, pp. Cannavan, Validation of an efficient method for the determination of pesticide residues in fruits and vegetables using ethyl acetate for extraction, Journal of Environmental Science and Health, 2007, p.