31 4.1 On the left is a drawing of the raw recording, and on the right is the for. In recent years, the amount of data has increased in almost all modern sciences.

Neuronal Electrophysiology
- Neurons
- Action potential
- Bursting
- Local field potential
Extracellular recorded action potentials are called spikes (the terms "action potential" and "spike" are sometimes used interchangeably). The combined LFP and action potential analysis provides a powerful framework for studying the input-output relationships of neural networks.

Overview
This signal is usually of low enough bandwidth that it can be filtered out by nerve action potentials. The effect of the detected potential on a microelectrode depends on the size and distance from the recording site [31].
Noise and SNR
The main components of the MEA recording and stimulation system diagram as shown in Fig. This "biological noise" is the largest source of noise in a neural recording, with amplitudes approaching unit activity.

Applications of MEA
Multimodal CMOS MEA
- Ground truth data
- Non-Gaussian Noise
- Non-Stationarities
- Spike overlaps
- Duplicates
In the first step, a review is made of all the challenges arising from the use of MEAs. Reading this volume of data from the hard disk into memory for analysis can be a major hurdle even before starting point sorting.
![Figure 2.3: Multy electrode array [1].](https://thumb-eu.123doks.com/thumbv2/pdfplayerco/316387.46456/21.893.254.607.152.349/figure-2-3-multy-electrode-array-1.webp)
Preprocess of the Raw data
Filtering
Given that our recorded signal is the sum of signals from several nearby neurons that are assumed to ring independently. Thus, it is possible for two different neurons to fire at or around the same time, so that their spikes in the recorded signal overlap with each other. At best, conventional spike classification methods can recognize such a detection as an outlier and therefore classify it as noise.
Ideally, we would like to be able to detect when an overlap occurs and to determine which neurons the overlapping spikes came from. This makes the use of classical spike sorting algorithms impossible, as they perform spike sorting on single channels, which is no longer appropriate. Although it is possible to remove duplicates, this becomes more challenging if nearby neurons start firing with high synchrony.
After Filtering
To estimate this noise covariance, we can first remove the detected spikes or find a time period where no spikes have been detected. Whitening filter for the entire time series matrix, which is essential to separate neighboring clusters [52]. These types of artifacts are difficult to detect and look like spikes or a burst, so they need to be removed.
The most common way is to set the mean value of the signal to a portion of the signals after the stimulation or during the period when the experimenter knows that the artifact exists. To remove these artifacts, values below or above the threshold are set to the mean value of the signal. The threshold used is estimated automatically using the lower and upper 0.1 percentiles of the signal with the largest deviation from the median, or it can be specified.
![Figure 3.2: Example cross-correlation matrix across channels before whitening [51].](https://thumb-eu.123doks.com/thumbv2/pdfplayerco/316387.46456/29.893.299.583.152.446/figure-example-cross-correlation-matrix-channels-whitening-51.webp)
Spike detection
Dealing with duplicates
The main problem with this is that the computational complexity increases with the number of duplicates and the misclassification increases, since duplicate points must be classified in the same cluster. To identify and avoid duplicates, two methods have been proposed, but with the assumption that the same event will have identical peak timing in nearby electrodes. One simple method to remove duplicates is to consider a radius for each peak and remove all but the largest amplitude arrows each time.
A more rigorous method of duplicate removal involves keeping the largest amplitude peaks and removing all peaks in a radius that have decreased in amplitude [58].
Feature Extraction
Thus, a different projection can be used to calculate a small number of features for each event and actually obtain better results in the clustering step. When peak detection is performed in the digital domain, when the voltage signal exceeds a threshold, a window is applied and a peak waveform is captured. At this point, each point essentially lines up with the point of the threshold transition.
The most common temporal alignment method is to align each spike to the point of its maximum amplitude (Fig. Alignment to the point of maximum slope has also been proposed [60], which is intuitive because the increasing slope of the action potential has a biological PCA is a dimensionality reduction technique, transforms the data into a new coordinate system, so that the maximum variance of a scalar data projection lies on the first coordinate, the second maximum variance on the second coordinate, and so on [61].
![Figure 3.3: Examples of two di ff erent alignment methods. Left: alignment to maxi- maxi-mum amplitude, Right: alignment to maximaxi-mum slope [59].](https://thumb-eu.123doks.com/thumbv2/pdfplayerco/316387.46456/32.893.185.698.468.724/figure-examples-alignment-methods-alignment-amplitude-alignment-maximaxi.webp)
Clustering
Extracellular spikes can be well summarized by just 3–4 principal components, a manageable dimensionality for most clustering algorithms [ 62 ]. Then the second step is to assign all events to the most likely template or combination of templates in the case of temporally overlapping events. This makes it very suitable for recordings with high firing rates and correlations between nearby neurons.
The successful separation of the nearby neurons is allowed because a two-dimensional density map can be clustered very efficiently and by combining locations and waveform features through dimensionality reduction. Density-based clustering algorithms have been successfully employed to solve this task: DPClus, based on the identification of density peaks [42], ISO-SPLIT to grow uni-modal clusters from small seeds [52] and Average Shift, which fits data points . to high-density areas [54]. Usually, locations and spatiotemporal waveform features exhibit significant redundancy [ 54 ], making this approach most suitable for very large arrays.
Evaluation
The first step is to find all possible templates with a pass over the data, each package follows a different strategy for this. Template matching detects peaks based on the similarity of the peak waveform, and not on the basis of amplitude or absolute voltage threshold exceedance. Another approach to evaluating the performance of spike sorting is to use post-processing techniques, based on our knowledge of the statistical properties of firing neurons.
A sharp drop in the amplitude distribution, caused by the detection threshold, means that the latter has introduced an artificial bias. Abundant, sharp interfaces between clusters mean that the properties of each neuron's spikes overlap in the selected feature space. If this happens, there will be a theoretical minimum of false positives and negatives due to the misassignment of events to the wrong cluster.
Outlook
Problems in detection and sorting can affect the electrophysiological analysis of the neuronal signals [9], so manual curation is often necessary to ensure data quality. No step in the peak sorting pipeline is completely solved and no peak sorter can be used for all applications. However, recent developments have made great strides in improving the accuracy, automation, and speed of the peak sorting pipeline.
For example, to quickly check if and where you have activity in your recordings and/or if you are only interested in the macroscopic activity of your tissue. We should note that for some scientific questions, peak classification may not be necessary, such as when you want to check network-level activity in diseases like Parkinson's or epilepsy. For the non-causal filter we used a Matalab function called 'filtfilt', which filters the data in the forward and reverse directions, thus giving a zero phase delay.
Spike detection
Problem with this method
This method assumes that the recording is homogeneous, if we have higher noise for a part of the recording (ie in the actual stimulation) then the mean absolute also becomes high. This means that the threshold is also high, so many points will be lost. One possible solution is to detect the parts of the recording with high noise and exclude them.
There is a similar problem also if we have zero signal for some parts of the recording.
Visualizations
Overview plots
Due to the large number of electrodes, it is difficult to check the activity of each electrode by plotting its recording. So there is a need for plots that can give you an insight into the overall activity of the MEA. With the "summary" plots, you can see all the channels and make some conclusions about the neuronal culture.
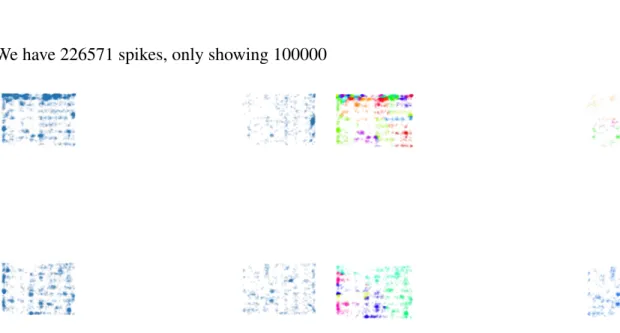
A spike grid (Fig. 4.3) shows the spike activity of a group of neurons over time (see this page for more information). In neurophysiology, the peristimulus time histogram and the poststimulus time histogram, both abbreviated PSTH or PST histogram, are histograms of the times at which neurons fire. To get an overview of the recording, you need to view all the peaks at once.

Spike detection results
Spike detection and localization
Thus, both the peaks and the information about their location are detected in the same step. Peaks are detected using a threshold-based method where the running baseline and noise estimate were calculated as a percentile of the signal. This method ensures that the overlapping peaks are detected as long as they have a clear spatial footprint.
The locations of the source for each spike were estimated for each event by considering that the signal from each neuron is spatially distributed over a neighborhood of electrodes. Note that the variability measure is not variance, but a percentile which is much better suited to the highly non-Gaussian noise in the data.
Combined Spatial and Shape-Based Clustering
If cluster_subset is used to limit the number of data points used to form clusters, this can be set to False.
Parameters for Spike Interface
Cluster_subset=200000 important for performance, can be set to 200,000 or so so only a subset of events will be used to form clusters.
Spyking Circus
- Pre-processing
- Filtering and spike detection
- Whitening
- Basis estimation (PCA)
- Clustering
- Masking
- Pre-clustering of the spikes
- Clustering by search of local density peaks and
- Template estimation
- Template matching
- Automated merging
- Parameters in spike interface
It then calculates the Covariance Matrix for the noise Cspatial and onds without spikes. The clustering step is followed by template matching, so there is no need to perform clustering on all the vertices. This approach is called divide and conquer and is suitable for parallelizing the problem [77] [78].
To overcome this problem, template matching is performed as the next step of the algorithm. To automate the clustering process, two factors are evaluated, firstly the similarity between the templates and the drop in the cross-correlogram. B A look at the features that led to this proposal C A look at the amplitudes over time.
Most of the time, the results need to be improved after the automatic conic classification of the recordings. In this thesis, we investigated spike sorting in HD-MEA and electrophysiological properties of neuronal extracellular recording.
