In addition, the behavior of the cores was studied in relation to different workloads placed on them with different performance measures. The first phase was conducting experiments and collecting data. The next stage was to analyze the collected data for both Intel x86 microprocessor chips.
INTRODUCTION
Evolution of Architectural Design Paths
A Way to Reduce Power Consumption
Taking into account the increasing effects of the Dennard scaling discontinuity, the effects of process variation are even greater, as it means that as transistors get smaller, the age of dark silicon is closer than ever. In summary, Dennard's failure to scale in conjunction with process variation leads to excessive power consumption to avoid reliability issues in each of the cores. It is also crucial to note that the effects of process variation are different between cores of the same multi-core chips not only due to the abnormality of the manufacturing process, but also due to the characteristics of the application running on different cores (workload dependency).
Thesis Concept
It is safe to say that guardbands ensure the reliability of the microprocessor, but as a trade-off, the frequency must be reduced, thereby degrading the performance. Voltage speculation differs from DVFS in that it only reduces the voltage and not the microprocessor chip frequencies. By examining the results, we can see that there are large differences between the cores of the same chip.
MACHINE CHECK ARCHITECTURE (MCA)
- Definitions and Mechanisms
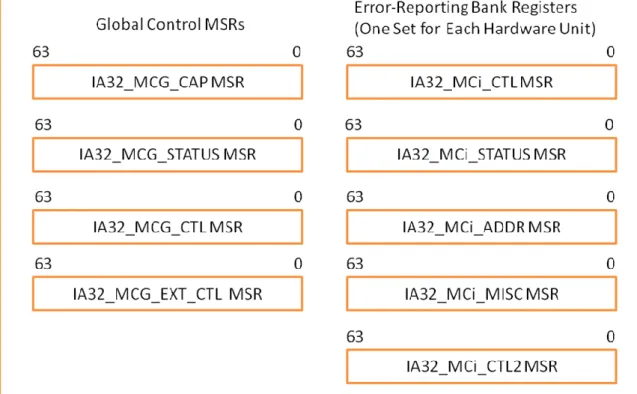
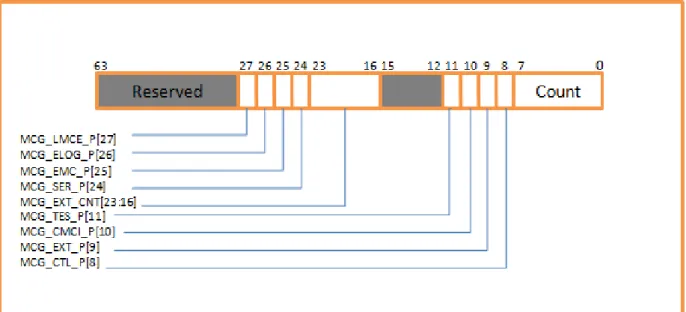
- Global Control Machine-Check Registers
- Error-Reporting Register Banks
- Enhancements to Previous Versions
- Uncorrected Error (UC) classification
- MCA error Code Interpretation
- Examples of MCA Error Codes Interpretation
- Handling MCEs from OS
- MCELOG
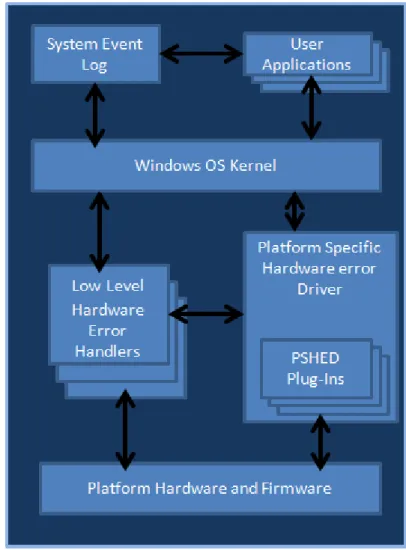
- Windows Hardware Error Architecture (WHEA)
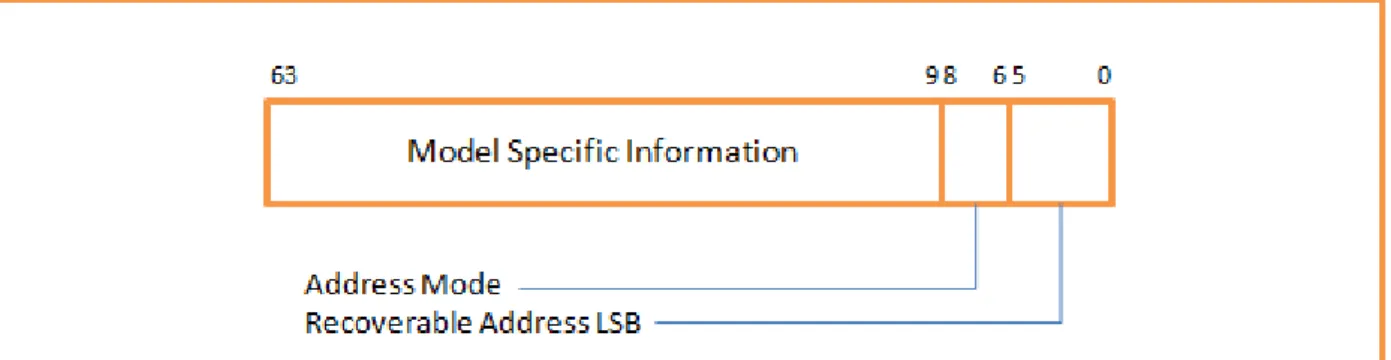
In addition, it indicates whether it is possible for the microprocessor to signal that an uncorrected, recoverable error has occurred and what actions must be taken to correct the error to the software. Last but not least, this registry informs us whether or not the above statement is responsible for the occurrence of the error. The number of available register banks is known through the global machine-specific registers.
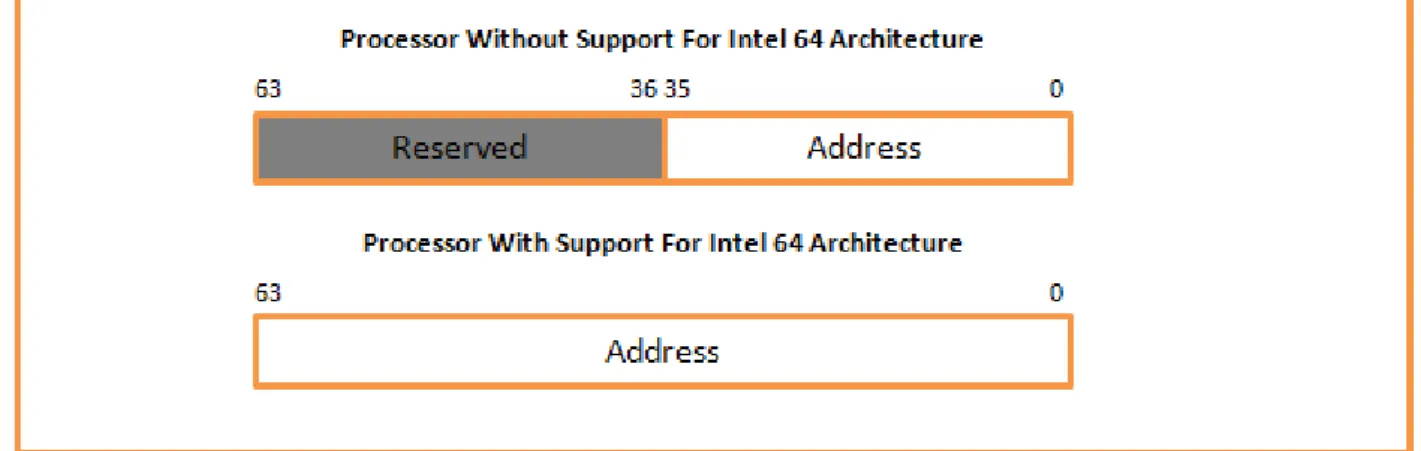
If the contents are valid, this register indicates the address of the data or instruction where the error occurred. When the MCA error code is interpreted, one can understand the type of error that occurred. The MCA error code can be found at the 16 least significant bits of an IA32_MCi_STATUS register in the bank reporting the error.
The following table describes the interpretation of MCA error codes in relation to simple errors. When the microprocessor cannot decide which of the two it is, the generic value is used. As an example of the implementation of a compound error, assume that the value of the IA32_MCi_STATUS register of the bank that reported the error is OxBE.
If we look at the Request Field Interpretation Table (RRRR), we can see that this is interpreted as fetching an instruction. More specifically, WHEA provides a standard error data record format, making it easier to trace the source of the error. The PSHED is used to take advantage of the platform-specific information about the error that occurred.

MICROARCHITECTURES DESCRIPTION
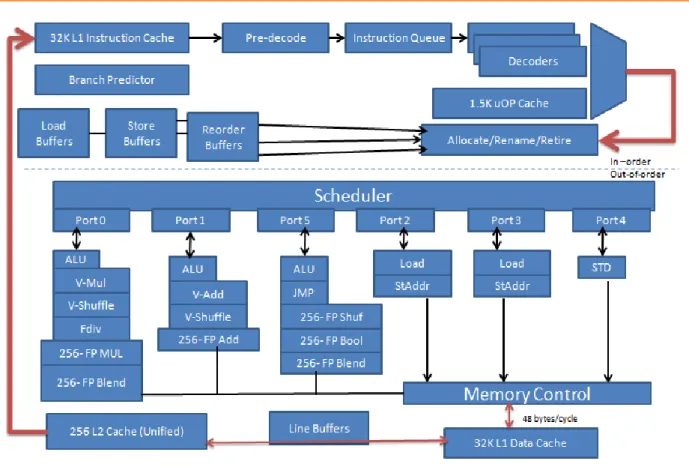
Main Pipeline Features on Sandy Bridge and Haswell Microarchitectures
- Sandy Bridge-E Details
- Haswell Details
Additionally, in the Sandy Bridge microarchitecture, if Hyper-Threading is available for a chip based on that microarchitecture, then L1Dcache is shared between two threads of the chip. In short, the microarchitectural changes introduced by Sandy Bridge are aimed at improving power consumption rather than improving performance. Haswell microarchitecture, also known as (fourth generation microarchitecture), is built on the successful Sandy Bridge and Ivy Bridge.
It is clear that there are not many changes compared to the Sandy Bridge pipeline. On the front end, a big difference between Sandy Bridge and Haswell is that not only is the L1DCache shared between threads, but also the decrypted L1ICache. The main difference between the Sandy Bridge microarchitecture and Haswell, in terms of the back end, is that the programmer can now send up to 8 micro-options for execution at the same time, in contrast to the 6 that could be sent before.
Furthermore, the execution core can handle twice the number of simultaneous floating-point operations compared to Sandy Bridge. The out-of-order engine in Haswell microarchitecture can handle 192 microarchitectures, while the Sandy Bridge microarchitecture can only handle 168. Regarding the cache architecture, the only difference between the two microarchitectures is that some configurations of the Haswell microarchitecture include a level 4 cache.
The level 3 cache (LLC) is the same as that described for the Sandy Bridge microarchitecture.
P-States and Turbo-Boost 2.0
The power consumption of a Haswell-based chip is 41% lower compared to the power consumption of an Ivy Bridge chip, as it has dropped from 17 W to 10 W. With the Haswell microarchitecture, microprocessors switch between power modes 25% faster than those based on Ivy Bridge. In this way, the battery life of all portable devices using such microprocessors is increased while the cooling requirement is reduced at the same time. This frequency was also achieved under the same conditions with the high performance mentioned above.
Intel Hyper-Threading
EXPERIMENT DESCRIPTION AND RESULTS
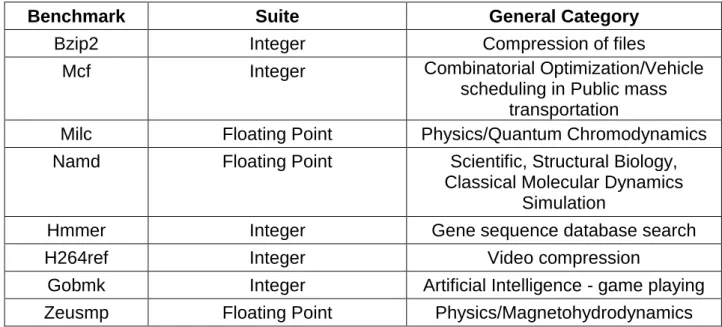
Microprocessors, Tools and Method
- Bzip2
- Mcf
- Milc
- Namd
- Hmmer
- H264ref
- Gobmk
- Zeusmp
- Conclusions for i5-4200U
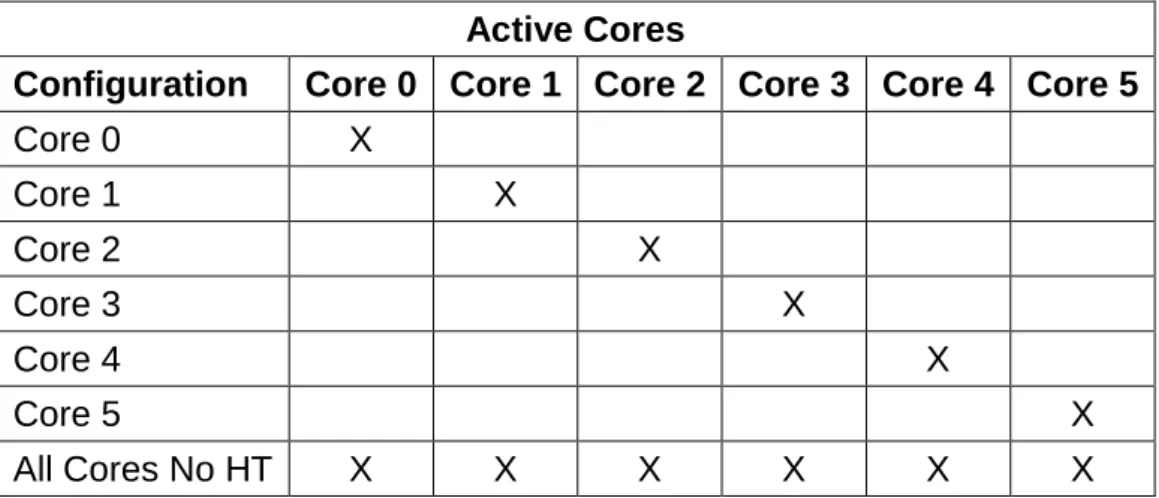
In the tables below, the error rate is normalized and refers to a ten minute run time of the benchmark with the corresponding configuration. When we focus on the Hyper-Threading (HT) behavior of the two physical cores, it is noticeable that they are significantly different. The last two columns concern the simultaneous execution of the benchmark on the two physical cores.
Regarding the all-core configuration, it can be observed that the error rate is higher than in the other configurations, a fact that can be explained due to the stress of the microprocessor (100% CPU utilization). When we examine the results of the last experiment (All cores without HT), we can see that the error rate is lower than in the configurations based on execution on Core 0 and Core 2 combined. As observed when the benchmark runs separately on the threads of the first physical core, no errors were observed that occurred on these cores.
On the other hand, we can again see a significant error rate when running the benchmark on the Core 2. Additionally, we can see a lower error rate on the Core 3 as well, but not to the same extent as that of the Core 2 When we delve into the benchmark results on the Core 2 and Core 3, we can see that the error rates of these two kernels are very close.
It is important to note that the error rate is almost half of the error rates of the previous two benchmarks on the Core 2 configuration. The results of the All Cores configuration are consistent with the results of the corresponding configurations on other benchmarks. Namd is a benchmark whose experiment results differ from the results of the other benchmarks on Core 2 in terms of error rates, as can be seen in Table 10.
Study on Intel Core i7-3970X Sandy Bridge-E Microprocessor
- Bzip2
- Mcf
- Milc
- Namd
- Hmmer
- H264ref
- Gobmk
- Zeusmp
- Conclusions for i7-3970X
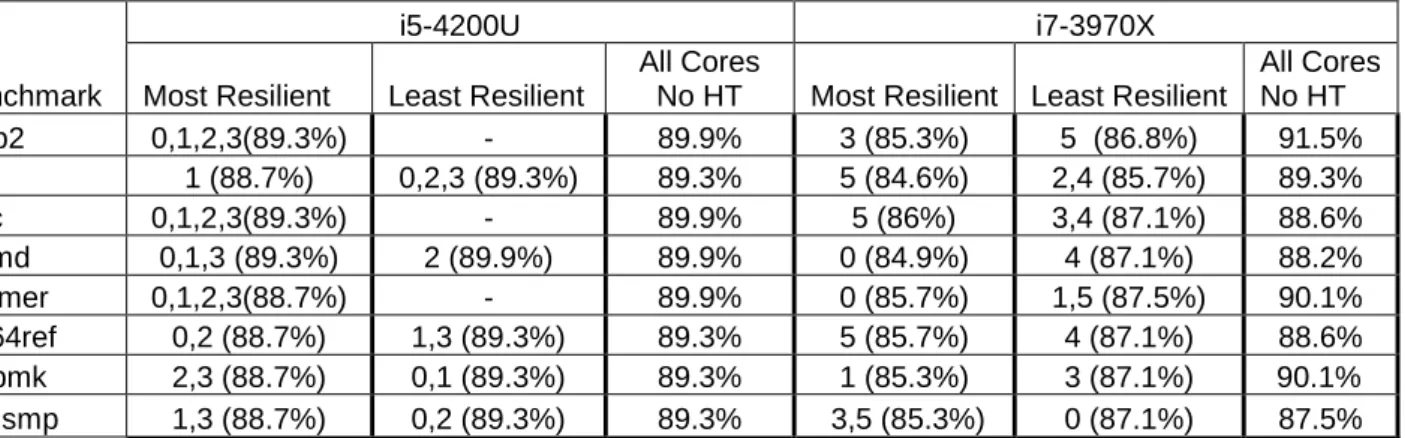
The greater the distance from the top of the chart, the more resilient a configuration has proven to be as far as this benchmark is concerned. It is clear from the diagram that the most resilient configuration is the one where a single instance of the benchmark ran on Core 3 and the rest of the processes ran on another core (more specifically on Core 5). Compared to the most resilient core for this benchmark, which is core 0, the difference is 3.4%, as core 0 withstood an undervoltage of 200mV (14.7% of the starting voltage) before an uncorrected fault occurred.
Regarding the power consumption, an average of 17.5% reduction was observed on the executions of the benchmark at the lowest voltage before the system collapsed compared to the executions at the starting nominal voltage. As with all the previous benchmarks, the least resilient is the All Cores No HT configuration where an instance of the benchmark is executed simultaneously on all the physical cores and after each execution the voltage is reduced by 5mV until the system crashes due to the appearance. Regarding the average temperature reduction for running the benchmark on a single physical core operating at the lowest safe voltage level, it was found to be 18.8% while the corresponding power consumption reduction is 16%.
Again, it is clear that the least flexible configuration is one where all physical microprocessor cores run an instance of the H264ref benchmark. As for the least flexible configuration, it has been shown to withstand a 10.9% (150 mV) drop in nominal voltage. A single benchmark run on a single core running at the lowest safe voltage showed an average temperature reduction of 20.4% and power consumption of 16%.
This is the only benchmark whose undervoltage resistance when the microprocessor is fully loaded can be directly compared to that of other configurations.
Comparison between the Microprocessors
In terms of all cores without the HT configuration, the i5 endured a 10% underclocking while the i7 endured a mere 8% underclocking. In terms of all cores, no HT configuration involved, the microprocessor was very under voltage at 10.6% when the crash occurred. The first three cores endured an undervoltage of 10.6% while on the other hand core 2 endured an undervoltage of exactly 10% (5mV ago) and in line with the stability of all cores without HT configuration.
The all cores no HT endured less than the least resilient core by 15mV (11.3% reduction from the starting voltage). All the threads endured an undervoltage of 11.2%, while the corresponding percentage across the all cores no HT configuration is 10%. The performance of the all cores no HT configuration is again worse than the performance of the other cores and one of the worst among all benchmarks (9.5%).
The all-cores no HT configuration comes in line with cores 1 and 3 in terms of endurance. Again, the all-cores no HT configuration is the least resilient, withstanding a 10.9% reduction before an uncorrected error occurred. More specifically, this was the benchmark for which the configuration with all cores and no HT suffered the most (12%).
All cores without HT configuration are again compatible with weaker cores.
CONCLUSION
SRAR software recoverable action required SRAO software recoverable action Optional UCNA uncorrected No action (required) MSR machine specific register. WHEA Windows Hardware Error Architecture LLHEH Low Level Hardware Error Handler PSHED Platform Specific Hardware Error Handler ETW Event Tracing for Windows.