Naturally, the integration of the Hydroelectric Project into the energy system in Greece is limited. Based on the above, this thesis investigates the contribution of the hydroelectric projects to benefit society, economy and environment and energy efficiency in Greece and more specifically in Evrytania Prefecture.
Summary of the the project
Energy and HP
Moreover, the liberalization of electricity markets and the breaking of monopolies in the European Union paved the way for greater exploitation of the country's water resources through private investment in small or large hydropower projects. Thus, through the production of electricity from hydropower plants, we can ensure the reduction of CO2 emissions and decrease the dependence on imported energy.
Structure of the work
The seventh chapter is an analysis of the establishment organization and general costs. In the ninth chapter, we try to make a term plan of the investment program using Gantt diagrams.
Aim, description and significance of the project
14 environmental performance of the company, but also to increase economic benefits and increase competitive advantage. In general, HPPs ensure voltage and frequency regulation of the electrical system, optimize thermal energy production and increase reliability.
Analysis of the market for renewable energy sources and Marketing
Types of renewable energy sources
- Wind Energy
- Small Hydroelectric Projects
- Biomass
- Solar Energy
- Biofuel
- Photovoltaics
The use of the small hydropower potential of thousands of SHP in the mountainous areas of Greece depends on the construction of decentralized ones, which will stimulate local development and at the same time can meet water supply, irrigation and other local needs. Production of energy in agricultural industries: Biomass for energy production is used by agricultural industries, where biomass is produced in significant quantities as a residue or by-product of the production process and as.
Advantages of renewable energy sources
Ethanol can be used as a fuel for vehicles in its pure form, but it is usually used as a gasoline additive to increase octane and improve vehicle emissions. Biodiesel can be used as a fuel for vehicles in its pure form, but it is usually used as a diesel additive to reduce the levels of particulates, carbon monoxide and hydrocarbons from diesel-powered vehicles.
Μarket analysis of electricity from renewable energy sources
They are domestic sources of energy and contribute to increasing energy independence and security of energy supply at the national level. They offer opportunities for the rational use of energy resources because they cover a wide range of users' energy needs.
Production and consumption of electricity-Participation rate of RES in Greece
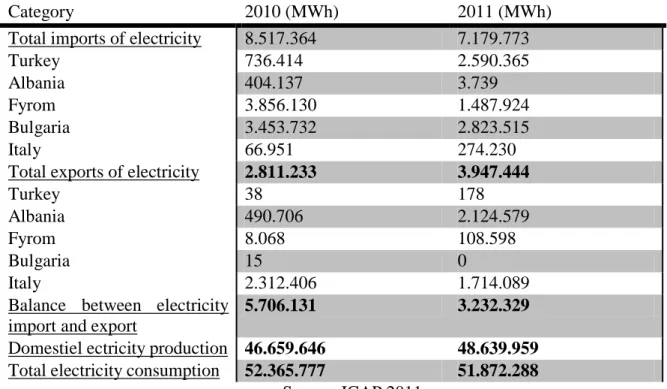
The total demand for electricity was formed at 51.9 TWh in 2011 slightly decreased compared to the previous year. Bulgaria, Albania, Italy, Turkey and Macedonia are the only countries with which Greece conducts electricity transactions. Most of the electricity imports were covered by Bulgaria in the total amount) followed by Turkey with 36.1%. On the other hand, Albania and Italy are the main countries that extract electricity from Greece.
Hydropower (<10MW)
- The contribution of small hydro power stations to the electricity generation in
- Advantages of hydropower
Large hydropower plants require the construction of dams and huge reservoirs with a large impact on the environment. The construction of dams restricts the movement of fish, wild animals and affects the entire ecosystem. On the other hand, small hydropower plants are usually located near rivers or canals and their function represents a minor disturbance. When a small hydroelectric plant is operating, part of the river flow is led to a turbine to produce mechanical energy and thus electricity through a generator. The used water then flows back to the natural reservoir.
Operation mode
Environmental interference in the direction of the use of hydropower plants is a major issue in terms of wider social acceptance. By the word environmental intervention we mean the effect they have on the installations and functioning of different ecosystems. When dealing with hydropower plants with a capacity of less than 10 MW, these environmental interventions are limited due to the limited installation work required.
Operating entities of electricity market in Greece
- Regulatory Authority for Energy (RAE)
- Independent Power Transmission Operator (IPTO or Independent
- CRES (Centre for renewable energy sources and savings)
30 3.8.2 Independent Electricity Transmission Operator (IPTO or Independent. Electricity Transmission Operators) S.A.- Operation of the electricity market (LAGIE SA). The Renewable Energy Sector is a dynamically developing part of global energy policy.
RES in Greece
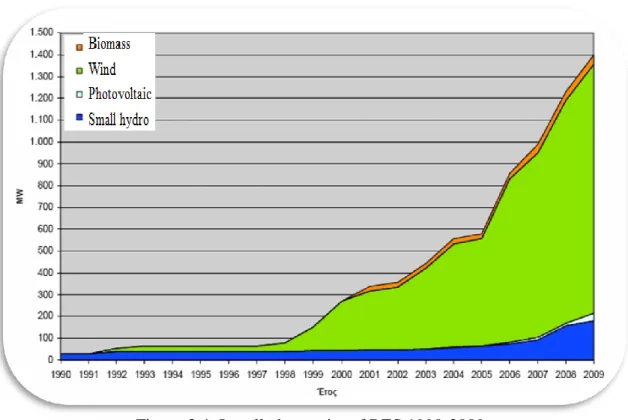
34 of installed capacity, which mainly consists of wind power plants (2500 MW). Nevertheless, the installed capacity of RE in Greece at the end of 2010 was equal to 1736 MW. The latest legislation in relation to RES is N.3851/2010, which accelerates the development of renewable energy and gives great attention to climate protection through the promotion of electricity production. The law also aims to minimize the permit period.
State for authorization evolution of RES - Ability power absorbed by the
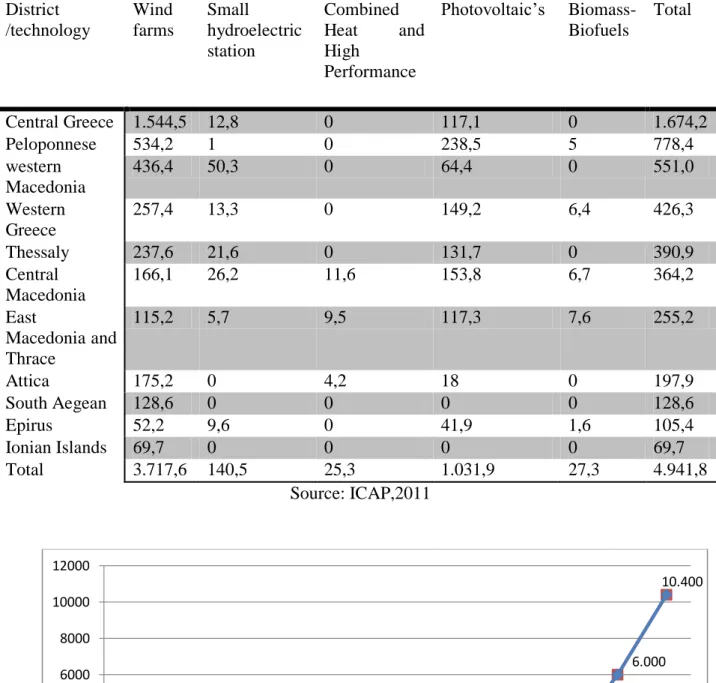
These problems have not been alleviated, despite the implementation of the Special Spatial Plan for renewables by 2008. Much of the power belongs to the Interconnected System with 2,052 MW in 2011. Diagrams show the power distribution depending on the region and technology.
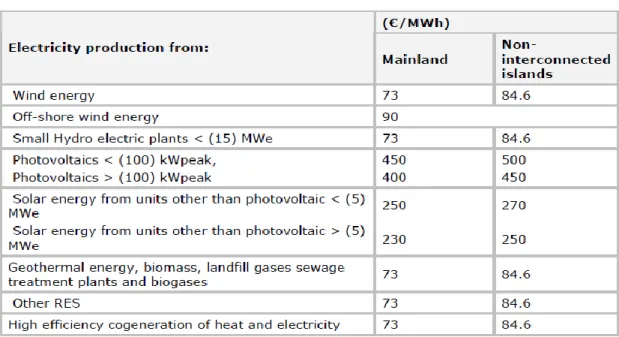
Sales value of electricity from RES
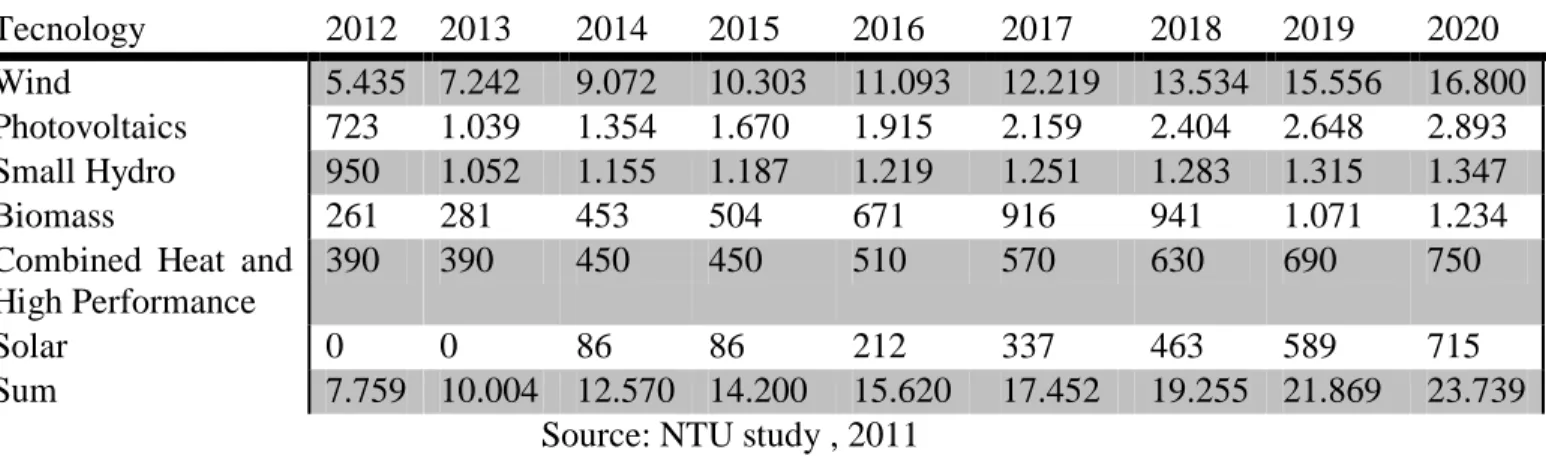
According to a study by the National Technical University, the estimated production in 2020 increased by approximately 23.7 TWh. Thus, the estimated value of the energy provided in 2020 will be 2.96 billion euros.
Market Shares of Companies in electricity production from RES
Conclusions
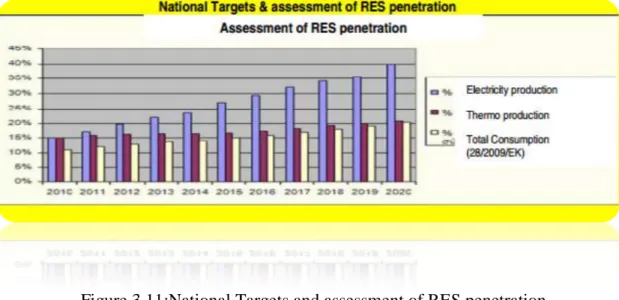
44 Figure 3.13: Forecasts of the share of renewable energy sources in the final consumption of the three most important sectors (electricity, heating and cooling, transport) and the total share of renewable energy sources.
Legal framework for the production of electricity from RES
- Legal framework at an International Level
- Legislative framework at European Level
- Legislative framework at national level
The Law on Accelerating the Development of Renewable Energy Sources to Deal with Climate Change and other regulations dealing with matters under the authority of the Ministry of Environment, Energy and Climate Change”. At the same time, it imposed a fee of 2% on renewable energy revenues for the benefit of relevant local government organizations.
License to produce electricity from RES or Combined Electricity and Heat with
In the event that the system operator decides to limit RE production, producers are compensated for up to 30% of the curtailment. 54 installations RES, as these areas are delineated in a specific and concrete, as well as provisions for control of carrying capacity in the areas that are permitted RES to ensure the principle of environmental protection. i) The compatibility of the project with the national action plan to achieve the objectives in Article 1, paragraph 3 2010.
Procedure for licencing
Hydro plant that we study
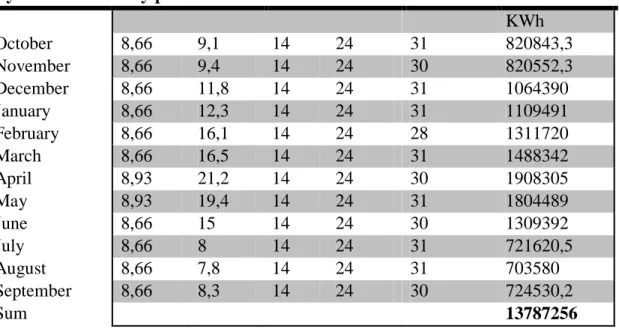
56 The amount of energy generated during different daily hours and/or different seasons of the year are the main issues worth investigating in the reservoir type of HPP studies. We believe that the energy production of 15 MW per year remains constant, while the company's revenues are revalued by 3.5% for inflation, as shown in the following table.
SWOT analysis
- SWOT Analysis
The exclusion from the scheme of the development law of production and/or R of P/V systems.
Raw materials and other supplies
Characteristics of raw materials and other supplies
- Raw materials
- Supplies of a hydropower plant
Characteristics of raw materials and supplies
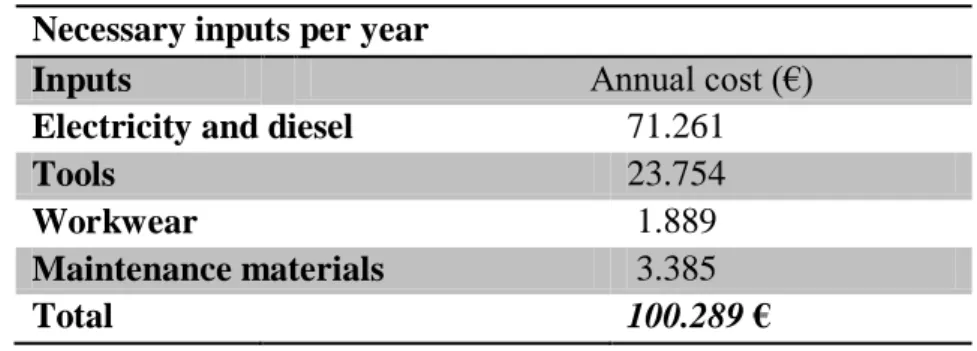
61 For the smooth daily operation of the hydroelectric plant, it is necessary to make a standard supply budget and quantify the needs of the hydroelectric plant.
Availability of raw materials and supplier selection
- Availability of materials
- Minimizing cost
- Selection and evaluation of suppliers
- Cost of raw materials and other supplies
The cost of raw materials and other supplies is a key component to the success of the investment and must be determined specifically based on the unit cost of each input and the quantities required. The cost of raw materials and other supplies will be adjusted every year by 3.5% as an inflation rate, as shown in the table below.
Engineering and technology
- Program and production capacity of the plant
- Technology selection criteria
- Supplier selection
- Required technology
- Description of the main components of a hydroelectric plant
- Technical description of civil engineering
- Costing of civil engineering
- Electromechanical equipment
- Overview - Types of hydroturbines
- Costing of Electromechanical equipment
- Ancillary equipment
- Costing of ancillary equipment
- Maintenance
- Total cost Estimation
The station is located in the right shoulder and borders the foot of the barrier. Adequate relays will be installed to protect the units as per PPC requirements.

Organization of the establishment and general expenses
Introduction
Business management and organization
The finance department (1 external partner) will be responsible for the salaries of the employees and the cost and accounting management. The legal department (1 external partner) will be responsible for writing all the necessary documents and contracts for the proper operation of the project.
General expenses
The overhead costs will be adjusted every year by 3.5% as the rate of inflation as shown in the table below.
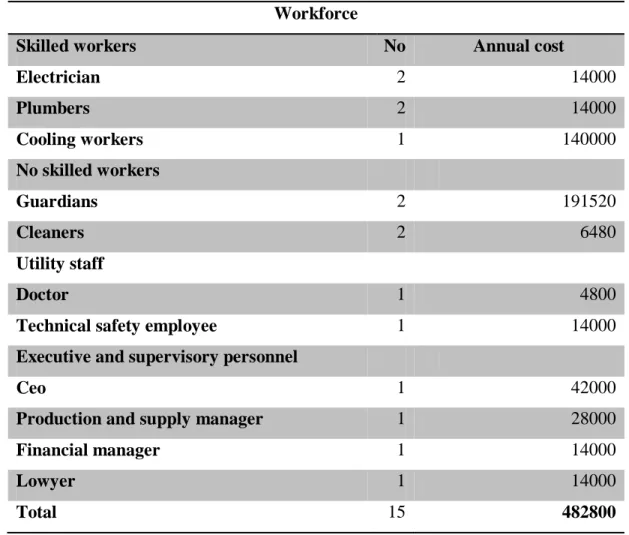
Human resources
- Introduction
- Organizational chart and job descriptions
- Job reward
- Attracting Candidates
- Selection of Candidates
- Direct Salary
- Additional Benefits and Other Obligations of the Employer
- Human Resource Programming
Rewards are the main components of the exchange relationship between employee and employer (Armstrong, 2010; Cropanzano & Mitchell, 2005; White & Drucker, 2000). Applicant offer: Direct offer of employment to the candidate, taking his job.
- Estimates of needs of the new plant in places
- Browse location and site selection criteria
- Essential requirements for site selection
- Characteristic features of Alternative Locations
- Evaluation of Alternative Locations
- Selecting the installation site
- History
- Geography
- Transport
- Tourism
- Fauna
- Soil and climate data
- Rivers
- Description of the installation environment
- Assessment and environmental impact assessment
- Basic studies to address the environmental impacts
- Financial data of the project
Whenever life in the valley became difficult, the mountains of Evrytania provided shelter for the exalted warriors. Building a dam and an artificial lake causes disruption to the natural environment because the accumulated water builds up pressure in the subsurface. The water, in addition to the humidity and pressure, causes landslides.

Time scheduling of the investment program
- Introduction
- Small hydro projects - the steps of a study
- General
- Types of studies
- Procedures for the inspection of micro / pico hydro installation
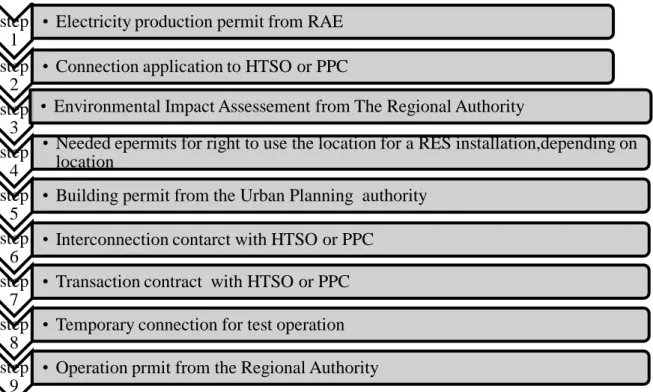
- Authorization and installation of hydro plants
- Estimated Cost of Program Execution
At this stage it is not yet possible to complete the technical and economic analysis of the installation. The term will last from one (1) to three (3) months, depending on the workload in the region.
LCA of the Small Hydro plant
Introduction
Goal and Scope Definition
- General applicable data for Life cycle assessment (LCA)
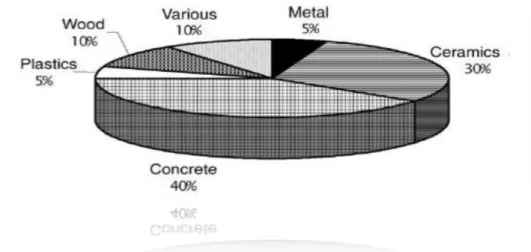
Most of the construction waste consists of concrete, masonry (brick, mortar), asphalt, glass, wood, plastic, steel, aluminum, etc. The products of construction waste recycling already successfully used in many countries, in many applications.

Concrete
In the concrete product life cycle, the main source of carbon emissions is the cement manufacturing process (cement is added to aggregates to make concrete). The cement content in concrete cannot be separated and reused or recycled sustainably. Fly ash, slag and silica fume can be used as cementitious materials by reducing the cement content.
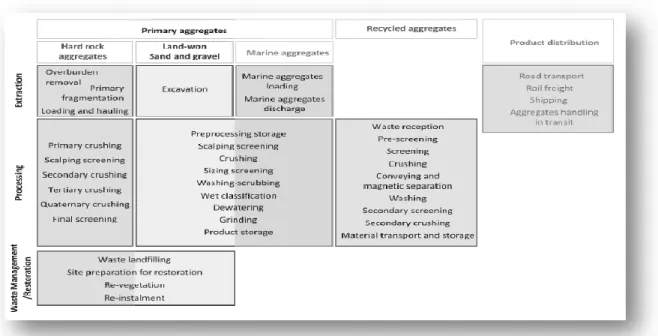
Aggregates
- Demand for aggregates
- LCA of Aggregeates
- Key assumptions and limitations
150 CO2, Particulate Matter etc.) and will quantify the relevant environmental impacts at each phase in the product life cycle. The LCA system will provide the facility to consider the relative proximity of sources of primary aggregates and recycled aggregates to the marketplace, as well as disposal options for inert construction and demolition waste.
Recycled aggregates
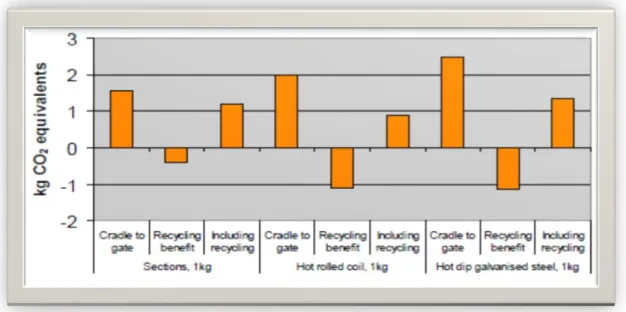
LCA of steel (Kaplan turbin)
As shown in Figure 10.12, the system boundaries for the LCI for steel products include the activities of the steel manufacturing sites and the production and transport of raw material inputs, energy sources and other consumables (diesel for internal transport, oxygen, nitrogen, etc.). For the cradle-to-gate data for each of the three products shown above, more than 97% of demand is from non-renewable resources, with the majority attributable to hard coal consumption, see Figure 10.15 below.
LCA for the hydro plant
- Sanitary landfills
- Emissions from landfills
The design of the landfill must include bottom and boundary sealing, a water collection system and also a gas collection system due to the biologically reactive nature of the waste. The duration of this phase depends on the acid-neutralizing capacity of the landfill material and can last thousands of years.
Conclusions
Financial analysis and evaluation of the investment
Total Investment Cost
- Net working capital
- Fixed assets
170 Due to the size and nature of the investment, almost all the data that make up the working capital (receivables, credit inventories) are not created at any stage of this investment. The only factor that has a rudimentary amount of cash in the red, which covers the meager operational needs of the unit.
Total Investment Cost
A fixed asset is an asset that is not consumed or sold in the normal course of business, such as land, buildings, equipment, machinery, vehicles, leasehold improvements, and other such items. In bookkeeping, real does not necessarily mean real property; any asset that is expected to last or be in use for more than one year is considered a fixed asset.
Financing Program
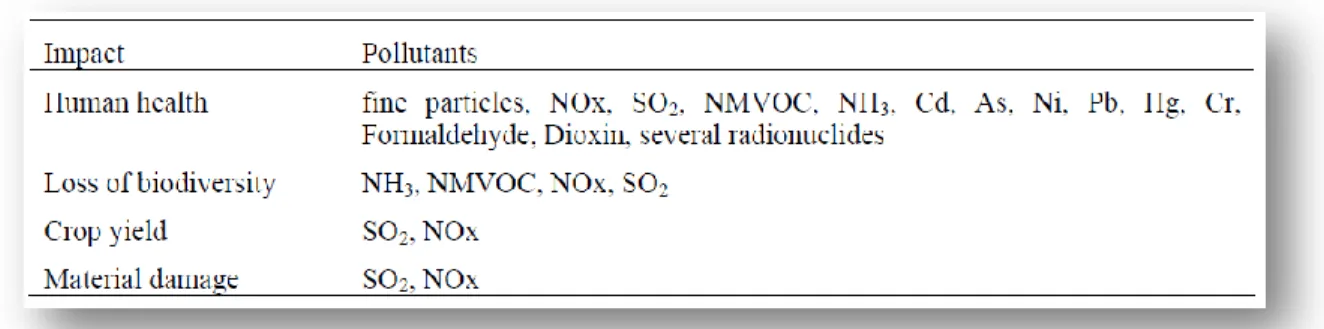
The unit damage costs used to quantify externalities of some air pollutants are summarized in Table 11.3. 173 Table 11.4: Marginal damage costs of greenhouse gas emissions in €/t (Values for average 1% cut off, discounted to 2005, 1% pure rate of time preference, without equity weight and with equity weight normalized to Western European average . per capita income, 1.35 $ per
Amortization Liabilities
- Loan features
Sales Revenue
Cost of Production
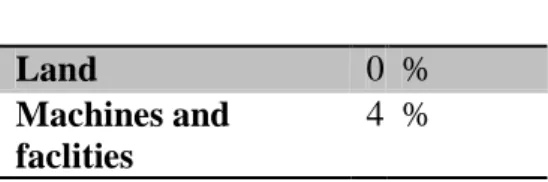
For the production plant's production plant, the lowest depreciation rate is five percent (4%) and above seven percent (6%). The transportation costs for production equipment increase the acquisition cost of equipment and are therefore consolidated with the cost of production equipment.
Production Cost
Financial Review
- Performance Period Capital (Payback Period)
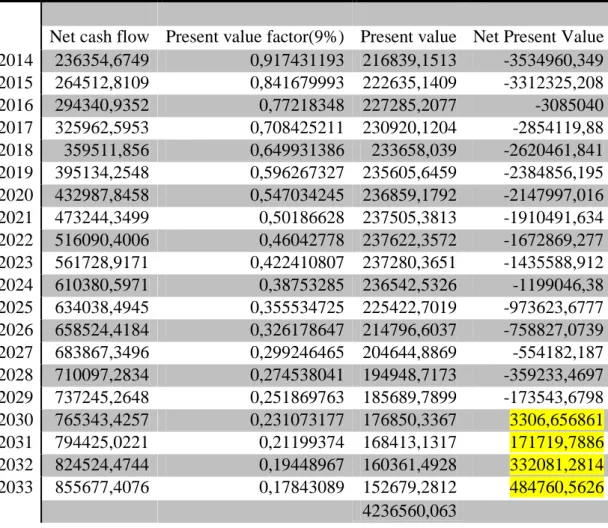
- Net Present Value
- Internal Rate of Return (IRR)
- Return on investment (ROI)
Calculate the cash flows as was done in the present value calculation. In this case, the performance period of the fund is 7 to 8 years, which is considered a good performance period for the fund.
Conclusions