Green polymeric materials: On the dynamic homogeneity and miscibility of furan- based polyester blends
Niki Poulopoulou, Achilleas Pipertzis, Nejib Kasmi, Dimitrios N. Bikiaris, Dimitrios G.
Papageorgiou, George Floudas, George Z. Papageorgiou
PII: S0032-3861(19)30385-4
DOI: https://doi.org/10.1016/j.polymer.2019.04.058 Reference: JPOL 21441
To appear in: Polymer Received Date: 9 March 2019 Revised Date: 13 April 2019 Accepted Date: 24 April 2019
Please cite this article as: Poulopoulou N, Pipertzis A, Kasmi N, Bikiaris DN, Papageorgiou DG, Floudas G, Papageorgiou GZ, Green polymeric materials: On the dynamic homogeneity and miscibility of furan- based polyester blends, Polymer (2019), doi: https://doi.org/10.1016/j.polymer.2019.04.058.
This is a PDF file of an unedited manuscript that has been accepted for publication. As a service to our customers we are providing this early version of the manuscript. The manuscript will undergo copyediting, typesetting, and review of the resulting proof before it is published in its final form. Please note that during the production process errors may be discovered which could affect the content, and all legal disclaimers that apply to the journal pertain.
M AN US CR IP T
AC CE PT ED
M AN US CR IP T
AC CE PT ED
Green polymeric materials: On the dynamic homogeneity and miscibility of furan-based polyester blends
Niki Poulopoulou1, Achilleas Pipertzis2, Nejib Kasmi3, Dimitrios N. Bikiaris3, Dimitrios G.
Papageorgiou4, George Floudas2 and George Z. Papageorgiou1*
1Chemistry Department, University of Ioannina, P.O. Box 1186, 45110 Ioannina, Greece
2Department of Physics, University of Ioannina, 451 10 Ioannina, Greece
3Laboratory of Polymer Chemistry and Technology, Department of Chemistry, Aristotle University of Thessaloniki, GR-541 24, Thessaloniki, Macedonia, Greece
4School of Materials and National Graphene Institute, University of Manchester, Oxford Road, Manchester M13 9PL, UK
Corresponding Author: George Z. Papageorgiou; E-mail: gzpap@uoi.gr
ABSTRACT
Polyesters from 2,5-furandicarboxylic acid are considered as biobased alternatives to their terephthalate counterparts. This work is focused on polymer blends comprised of furan-based polyesters differing by one or two methylene groups in their repeat units. Blends of Poly(ethylene 2,5-furandicarboxylate) (PEF) and poly(propylene 2,5-furandicarboxylate) (PPF) displayed a single composition-dependent glass temperature (Tg) revealing the miscibility of the polymers. Dielectric spectroscopy results revealed dynamically homogeneous mixtures when the backbones differ by a single methylene unit and dynamically heterogeneous mixtures when they differ by two methylene units. The most interesting finding was the single segmental dynamics in the PEF-PPF and poly(butylene furanoate)-poly(propylene furanoate) (PBF-PPF) blends. For
M AN US CR IP T
AC CE PT ED
comparison, homologous terephthalate blends were also investigated. Finally, reactive blending was applied in PEF-PBF blends and enhanced compatibility was achieved even after short times due to transesterification reactions at elevated temperatures. With increasing duration of melt- mixing the thermodynamic miscibility between PEF and PBF increased and ultimately a random copolymer was obtained.
KEYWORDS: 2,5-furandicarboxylic acid; poly(ethylene furanoate); blends.
I. INTRODUCTION
The depletion of fossil resources and the growing environmental concerns have led to an increased interest in polymers from renewable resources [1]. The latter polymers can be categorized in two classes [2]. The first includes substitutes of fossil-based plastics, synthesized by using biomass derived monomers, e.g. bio-polyethylene, (bio-PE), bio-poly(ethylene terephthalate) (bio-PET) [3, 4]. The second category comprises of novel polymers from biomass, with favorable properties, that can be used as alternatives to fossil-based plastics [5, 6]. 2,5- Furandicarboxylic acid (FDCA) has emerged as an important monomer that can be obtained through oxidation of 5-hydroxymethylfurfural which in turn can be derived from sugars like fructose by dehydration [7-9]. Polyesters based on FDCA show beneficial gas barrier, mechanical and thermal properties and are considered as the biobased alternatives to the fossil- based terephthalate polyesters (such as the giant of the polyester market, poly(ethylene terephthalate) (PET)) [10, 11]. Poly(ethylene 2,5-furandicarboxylate) (PEF) displays superior gas barrier properties, while its thermal and mechanical properties are comparable to PET properties. As such it can be used in applications as in food-packaging or in fiber production, effectively replacing PET [12, 13]. Industrial production of PEF is an example of green chemistry application, considering the low carbon-footprint and reduced non-renewable energy
M AN US CR IP T
AC CE PT ED
consumption [14]. The synthesis of PEF has been reported long ago, however, reports concerning aspects of its synthesis as well as its properties, the modification of its structure by copolymerization, the enhancement of its solid structure with addition of nanofillers and the crystallization kinetics appeared only recently [15-21]. The segmental dynamics in PEF were first addressed by Dimitriadis et al. [22] and the α-process was discussed in detail in both the quenched amorphous and semicrystalline states. More recently, Bourdet et al. [23] investigated the dielectric properties of PEFs and the authors found that PEFs with an assymetrical position of the carbonyl group on the furan ring, display higher relaxation times compared to their symmetrical counterparts. In addition, dielectric spectroscopy investigations on poly(butylene 2,5-furandicarboxylate) (PBF) and poly(propylene 2,5-furandicarboxylate) (PPF), respectively, by Soccio et al. [24] and Genovese et al. [25] focused on the sub-glass processes. The synthesis and some properties of PBF and PPF or poly(trimethylene 2,5-furandicarboxylate) (PTF) were additionally studied [26-31]. A few studies also focused on fast crystallizing furan-based polyesters, such as poly(hexamethylene 2,5-furdicarboxylate) (PHeF) and poly(1,4- cyclohexandimethylene 2,5-furandicarboxylate), or on high glass temperature (Tg) furanoates, i.e., poly(isosorbide 2,5-furandicarboxylate) [32-35]. Although glassy amorphous PEF and PPF
show acceptable gas barrier and mechanical properties, these characteristics can be substantially improved by inducing partial crystallinity in the resins [36, 37]. Unfortunately, both PEF and PPF are slowly crystallizing polyesters. Finding an appropriate practical method for increasing the rate of crystallization and the final degree of crystallinity in the corresponding materials is a challenge [38, 39]. Three methods have been reported to arrive to tailor-made materials;
synthesis of novel polymers, modification of the structure of existing materials, and blending [40]. The latter has been proved to be a useful tool for tailor-made polymers with desirable and balanced properties. Polymers of the same homologue series which differ by a methylene or methyl unit may become immiscible, especially in the absence of polar forces and interactions
M AN US CR IP T
AC CE PT ED
between the blend components. In general, slight differences in the chemical structures of the blend constituents, including isomeric states, may lead from homogeneous mixtures to phase separated blends. Furthermore, blends where both components are crystallizable are less studied as compared to the ones composed of amorphous/crystalline components [41].
Reactive blending is a method that promotes thermodynamic miscibility. The method involves heating and mixing of the blend components in an extruder, at a temperature well above their melting temperatures for specific duration of time [42]. Chain scission but also recombination of the polyester chain fragments through transesterification reactions, results in the formation of block copolymers at the first stage of reactive blending, while random copolymers are expected to form after prolonged melt-mixing [43]. Reactive blending has also been applied for the production of biobased PBF-Poly(lactic acid) (PLA) blends [44, 45] and also for the formulation of different furan-based blends [43].
In the present work, the phase state and thermal behavior of a series of binary blends comprising from furanoate- or terephthalate-based semicrystalline engineering polyesters that differ by one or two methylene groups in the repeating units, were studied. Three different series of furan-based polyester blends were prepared, with an extra focus on blends of PEF or PPF with (the fast-crystallizing) PBF aiming to accelerate the crystallization rates of the former ones. The dynamic homogeneity and miscibility were studied by means of differential scanning calorimetry (DSC) and dielectric spectroscopy (DS). Wide angle X-ray diffraction (WAXD) was also used to evaluate the crystallization behavior of the components in the blends. The corresponding terephthalate polyester blends were prepared and studied for comparison reasons. Finally, reactive blending was tested as a method for improving miscibility of the components in PEF- PBF blends.
II. EXPERIMENTAL SECTION
M AN US CR IP T
AC CE PT ED
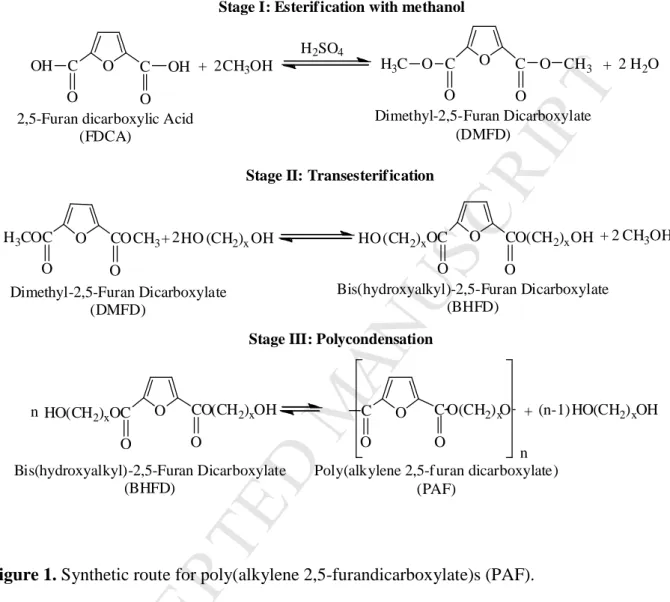
Synthesis of polyesters. A series of high molecular weight poly(alkylene furanoate) (PAF) samples were synthesized by applying melt polycondensation, using 2,5-furandicarboxylc acid or terephthalic acid as described in our previous studies [37, 46]. 1,2-Ethylene glycol, 1,3- propanediol and 1,4-butanediol were also used as diols for polyester synthesis. Solid state polycondensation was subsequently applied to reach polymers of high molecular weight as described in detail in previous studies from our group [47-50]. The reaction path for the synthesis of the polyesters is shown in Figure 1.
Preparation of polymer blends. Polymer blends of the thermoplastic polyesters were prepared by dissolving the corresponding polymer pairs in a mixture of trifluoroacetic acid and chloroform 4/1 v/v. Typically, 2g of polyesters mixture, 5mL of CF3COOH and 20 mL of CHCl3
were used for the preparation of each blend. The solutions were poured in an excess of methanol and the blends were obtained as the precipitate. The solution mixing as a method of blend preparation was selected prior to avoid any possible transesterification reactions occurring at elevated temperatures during melt mixing.
Intrinsic viscosity measurements. Intrinsic viscosity [η] measurements were performed using an Ubbelohde viscometer at 303 K in a mixture of phenol/1,1,2,2-tetrachloroethane (60/40 w/w).
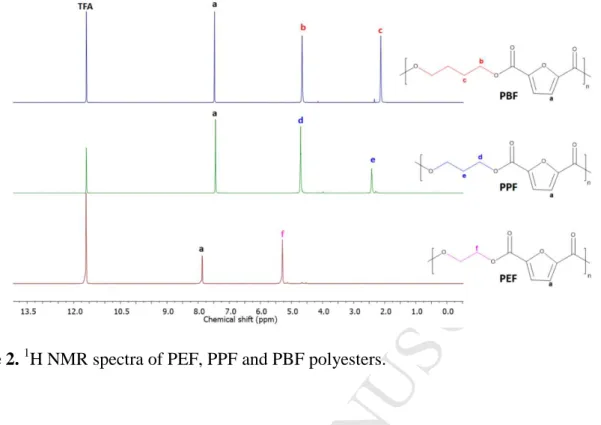
Nuclear Magnetic Resonance (NMR). 1H NMR spectra of the neat PEF and PBF as well as PEF.PBF 50/50 were recorded using a 500 MHz Bruker NMR spectrometer. Deuterated trifluoroacetic acid was used as solvent to prepare solution of 5% w/v. The number of scans was 16, and the sweep width was 6 kHz.
Differential scanning calorimetry. The thermal behavior of the blends was studied using a Perkin Elmer Diamond DSC updated to DSC 8500 level, combined with an Intracooler IIP cooling system. Samples of about 5 mg were used. The blends were first heated at 20 K/min up to 30 K above the higher melting temperature and then quenched to 243 K, before reheating at a rate of 20 K/min, to observe the glass transition, cold-crystallization and melting of the
M AN US CR IP T
AC CE PT ED
amorphous samples. For polyesters, reactive blending is an industrial process that involves melt- mixing in an extruder/internal mixer, at temperatures higher than the melting temperatures of all constituents. To simulate reactive blending, the blends were initially prepared from solution, as described above, and were subsequently melt-mixed, within the DSC pans. More specifically, for reactive blending experiments, the blends were scanned at a rate of 20 K/min up to a predetermined temperature (well above the melting points of both components), where they were held for a specific time in each test, before quenching to 234 K. The quenched samples were subsequently heated at 20 K/min, starting from a temperature at least 30 K below the lower Tg of the polymers. For the evaluation of the glass temperature, tangents were drawn carefully on the heat flow curve at temperatures above and below the glass temperature and the Tg was obtained as the point of intersection of the bisector of the angle between the tangents with the heat flow curve. The intersection of these tangents with that of the part corresponding to the transition were used as Tg,onset and Tg,end.
X-Ray diffraction. X-ray diffraction measurements of the samples after grinding were performed using a SIEMENS Diffract 500 system employing CuKα radiation (λ=1.5418 Å).
Dielectric Spectroscopy.
The sample cell consisted of two electrodes, 20 mm in diameter and a thickness of 100 µm maintained by Teflon spacers. DS measurements were made with a Novocontrol Alpha frequency analyzer. Measurements were performed at different temperatures in the range from 273 K to 433 K in steps of 5 K for frequencies in the frequency range from 10−2 to 107 Hz. The complex dielectric permittivity ε* = ε′ − iε″, where ε′ is the real and ε″ is the imaginary part, was obtained as a function of frequency, ω, and temperature T, and in general pressure P, ε*= ε*(ω, T, P) [51-53]. The analysis was made using the empirical equation of Havriliak and Negami
(HN) [54]:
∗ , = +
∙ + (1)
M AN US CR IP T
AC CE PT ED
where is the high-frequency permittivity, ! is the characteristic relaxation time in this equation, " = # $ − is the relaxation strength, m, n (with limits 0 <m, mn≤ 1) describe, respectively, the symmetrical and asymmetrical broadening of the distribution of relaxation times, σ0 is the dc conductivity, and & is the permittivity of free space. From! , the relaxation time at maximum loss, τmax, was obtained analytically following
1/ 1/
max sin sin
2(1 ) 2(1 )
m m
HN
m mn
n n
π π
τ =τ ⋅ − ⋅
+ +
(2)
In the temperature range where two relaxation processes contribute to ε* there are two ways of representing the data. The first one, followed here, is based on the addition of two HN functions and assumes statistical independence in the frequency domain. The second one, proposed by Williams and Watts, is a molecular theory for the dipole moment time-correlation function Cµ(t).
III. RESULTS AND DISCUSSION
The PEF, PPF and PBF samples were synthesized following a three-stage synthetic route, starting from 2,5-furan dicarboxylic acid (FDCA) and the corresponding diol. In Stage I, FDCA reacted with methanol and the dimethyl-2,5-furan dicarboxylate (DMFD) was obtained. In Stage II, DMFD reacted with 1,2-ethyleneglycol or 1,3-propanediol or 1,4-butanediol to arrive to the bis(hydroxyalkyl-2,5-furan dicarboxylate) (BHFD). During Stage III, polycondensation of BHFD with removal of diol molecules, led to the formation of poly(alkylene 2,5-furan dicarboxylate) (PAF). The obtained samples were purified by dissolving them in a CF3COOH/CHCl3 mixture and precipitating in cold methanol. Molecular characterization of the polymers followed, including intrinsic viscosity (IV) measurements, end-group measurements, and collection of 1H NMR spectra. The 1H NMR spectra confirmed the structures of the
M AN US CR IP T
AC CE PT ED
polyesters (Figure 2). The intrinsic viscosity values [n] of the prepared polyesters samples and their blends was measured and the results are listed inTable 1.
C O
O C
O n
C O
O C
O
OH OH + C
O
O C
O
O O
H3C CH3
H2SO4 CH3OH
2 + 2 H2O
C O
O C
O
O O
H3C CH3+ 2HO (CH2)xOH C
O
O C
O
O O(CH2)x (CH2)x
HO OH + 2 CH3OH
C O
O C
O
O O(CH2)x (CH2)x
HO OH
n O(CH2)xO + (n-1) HO(CH2)xOH
Dimethyl-2,5-Furan Dicarboxylate (DMFD)
2,5-Furan dicarboxylic Acid (FDCA)
Dimethyl-2,5-Furan Dicarboxylate (DMFD)
Bis(hydroxyalkyl)-2,5-Furan Dicarboxylate (BHFD)
Bis(hydroxyalkyl)-2,5-Furan Dicarboxylate (BHFD)
Poly(alkylene 2,5-f uran dicarboxylate) (PAF)
Stage I: Esterif ication with methanol
Stage II: Transesterif ication
Stage III: Polycondensation
Figure 1. Synthetic route for poly(alkylene 2,5-furandicarboxylate)s (PAF).
M AN US CR IP T
AC CE PT ED
Figure 2. 1H NMR spectra of PEF, PPF and PBF polyesters.
Table 1. Intrinsic viscosity [η] values of furanoate and terephthalate-based homopolyesters and their corresponding polymer blends.
Polyester samples [η] (dL/g)
PEF 0.62
PPF 0.50
PBF 0.68
PEF-PBF 50-50 0.64 PEF-PPF 50-50 0.55 PBF-PPF 50-50 0.57
PET 0.76
PPT 0.80
PBT 1.06
PET-PPT 50-50 0.77 PBT-PPT 50-50 0.89 PET-PBT 50-50 0.87
M AN US CR IP T
AC CE PT ED
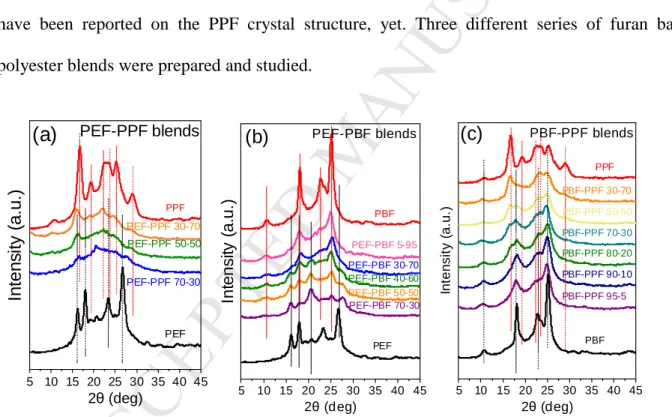
The WAXD patterns for the three series of blends are shown in Figure 3. Peaks corresponding to crystals of both components can be observed in every case. As for the crystal structure of PEF, Mao et al. reported that the space group is P21, and the unit cell is monoclinic where a = 5.784 Å, b = 6.780 Å, c = 20.296 Å, and γ = 103.3ο [16]. Maini et al. have reported the crystal structures of the three crystal modifications of PEF. Τhey found that α-PEF is triclinic with a = 5.729 Å, b = 7.89 Å, c = 9.62 Å, α = 98.1ο, β = 65.1ο, γ = 101.3ο; α΄-PEF is monoclinic with a = 5.912 Å, b = 6.91 Å, c = 19.73 Å, γ = 104.41ο; and β-PEF is monoclinic with a = 5.953 Å, b = 6.60 Å, c = 10.52 Å, β = 107.0ο [19]. For PBF a triclinic unit cell was determined with a = 4.78 Å, b = 6.03 Å, c = 12.3 Å, α = 110.1°, β = 121.1°, γ = 100.6° [55]. Unfortunately, no data have been reported on the PPF crystal structure, yet. Three different series of furan based polyester blends were prepared and studied.
5 10 15 20 25 30 35 40 45
(a)
PEF-PPF 30-70 PEF-PPF 50-50
Intensity (a.u.)
2θ (deg)
PEF PEF-PPF 70-30
PPF
PEF-PPF blends
5 10 15 20 25 30 35 40 45
(b)
PBF
PEF-PBF 5-95
PEF-PBF 30-70 PEF-PBF 40-60 PEF-PBF 50-50
Intensity (a.u.)
2θ (deg)
PEF PEF-PBF 70-30
PEF-PBF blends
5 10 15 20 25 30 35 40 45
(c)
PBF-PPF 95-5 PBF-PPF 90-10 PBF-PPF 80-20 PBF-PPF 70-30 PBF-PPF 50-50
Intensity (a.u.)
2θ (deg)
PBF-PPF blends
PBF PBF-PPF 30-70
PPF
Figure 3. WAXD patterns of as prepared a) PEF-PPF, b) PEF-PBF and c) PBF-PPF blends.
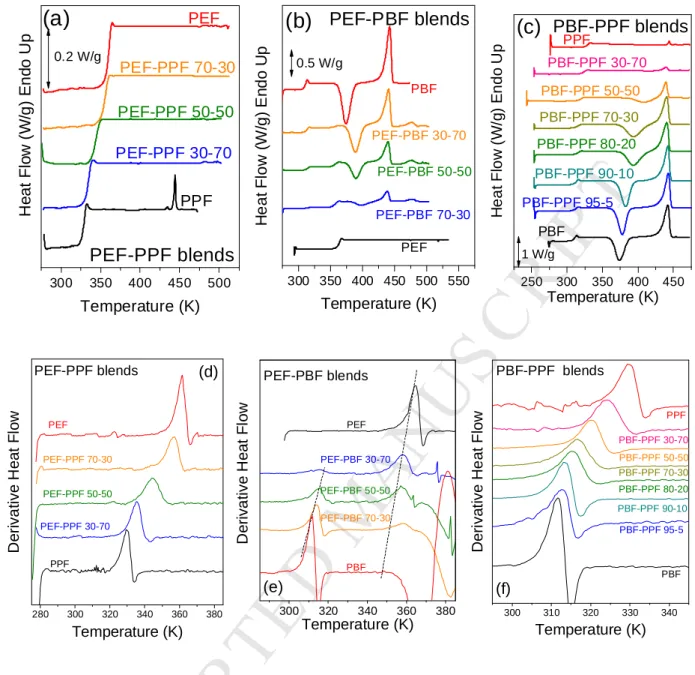
The thermodynamic properties of the blends were investigated by DSC and the results are shown in Figure 4a for melt-quenched PEF-PPF blends with different compositions. Both polymers are characterized by slow crystallization rates, especially for high molecular weight samples such as the ones used for the preparation of the blends. A single glass temperature was
M AN US CR IP T
AC CE PT ED
recorded in the DSC traces (also confirmed from the derivative of heat flow in Figure 4d) and there was no evidence for cold-crystallization or melting. In contrast, for the PEF-PBF blends (Figure 4b), dual glass temperatures were observed at every composition as it can be realized from the double peak in the derivative heat flow (Figure 4e). In addition, a cold-crystallization peak appeared at higher temperatures with increasing PEF content. Strikingly, two melting peaks, a lower one corresponding to PBF and another one at higher temperatures, corresponding to PEF, were observed at each blend composition, with the peak matching the melting of PBF being the main one, independently of the blend composition. Evidently, PBF triggers the crystallization of PEF in the blends, accelerating the crystallization phenomenon, a fact that can be considered highly desirable in terms of applications. In addition, for the PEF-PBF blends, a slight shift of the two Tgs to intermediate temperatures was shown in the derivative heat flow curves of Figure 4b, together with some peak broadening. Broadening was also observed in the glass region.
The DSC results for the PBF-PPF blends showed a single composition dependent Tg following quenching (Figure 4c), along with a (single) melting temperature depression. Both PBF and PPF melt at about the same temperature. However, it is clear from the decreasing heat of fusion with increasing PPF content, that the crystallizing component is always the PBF, while it cannot be totally precluded that PPF crystallization can also occur in a small extent. The single glass temperature in the PEF-PPF blends was also verified by the derivative of heat flow (Figure 4f). Nevertheless, peak broadening was evidenced in case of the PEF-PPF 50-50 sample.
Observation of a single Tg (by DSC) in a blend of two polymers having quite different Tgs, is an indication that the system is dynamically homogeneous, i.e. the two segments relax with identical rates. Then, the breadth of Tg can be considered as a measure of the extent of miscibility [56].
M AN US CR IP T
AC CE PT ED
300 350 400 450 500
(a)
PEF-PPF 70-30 PEF-PPF 50-50
Heat Flow (W/g) Endo Up
Temperature (K) PPF PEF-PPF 30-70
PEF
PEF-PPF blends
0.2 W/g
300 350 400 450 500 550
(b)
PEF-PBF 30-70 PEF-PBF 50-50
Heat Flow (W/g) Endo Up
Temperature (K) PEF PEF-PBF 70-30
PBF
PEF-PBF blends
0.5 W/g
250 300 350 400 450
(c)
PPFPBF-PPF 30-70 PBF-PPF 50-50 PBF-PPF 70-30 PBF-PPF 80-20 PBF-PPF 90-10
Heat Flow (W/g) Endo Up
Temperature (K)
PBF-PPF blends
PBF PBF-PPF 95-5
1 W/g
280 300 320 340 360 380
(d)
PEF-PPF 30-70
PEF-PPF blends
Derivative Heat Flow
Temperature (K)
PEF
PEF-PPF 70-30
PEF-PPF 50-50
PPF
300 320 340 360 380
(e)
PBF PEF-PBF 70-30 PEF-PBF 50-50
Derivative Heat Flow
Temperature (K) PEF-PBF blends
PEF
PEF-PBF 30-70
300 310 320 330 340
(f)
PBF-PPF 30-70 PBF-PPF 50-50 PBF-PPF 70-30 PBF-PPF 80-20 PBF-PPF 90-10
Derivative Heat Flow
Temperature (K) PBF-PPF blends
PBF PBF-PPF 95-5
PPF
Figure 4. Upper Row: DSC heating traces for quenched samples of a) PEF-PPF b) PEF-PBF and c) PBF-PPF blends. The heating rate was 20 oC/min. Bottom Row: Derivative of heat flow for the heating traces for quenched samples of d) PEF-PPF e) PEF-PBF and f) PBF-PPF blends.
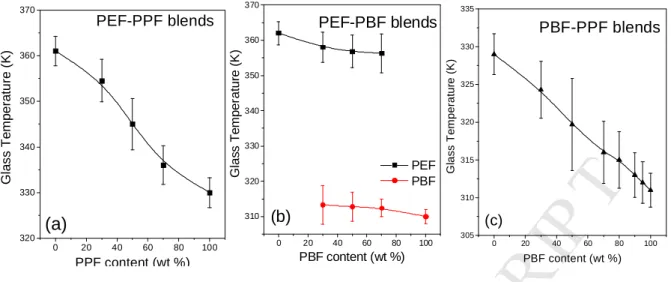
The variation of the Tg values for the blends can be seen in Figure 5. An almost S-shaped curve is observed for the variation of the glass temperature with composition for the PEF-PPF blends (Figure 5a). In Figure 5c, the variation of the Tg values for PBF-PPF blends is almost linear, with a slight positive deviation. It is important that the blends crystallized upon heating.
M AN US CR IP T
AC CE PT ED
0 20 40 60 80 100
320 330 340 350 360 370
(a)
PEF-PPF blends
Glass Temperature (K)
PPF content (wt %)
0 20 40 60 80 100
310 320 330 340 350 360
Glass Temperature (K)
(b)
PEF PBF
PEF-PBF blends
PBF content (wt %)
0 20 40 60 80 100
305 310 315 320 325 330
(c)
PBF-PPF blends
Glass Temperature (K)
PBF content (wt %)
Figure 5. Dependence of the glass temperature a) of PEF-PPF blends on the PPF content, b) of PEF and PBF on the PBF content in PEF-PBF blends and c) of PBF-PPF blends on the PBF content.
The segmental dynamics of the three blends (PEF-PBF, PEF-PPF and PBF-PPF) can be studied by means of DS over a broad temperature range. The samples were first heated to 513 K and subsequently quenched to liquid nitrogen. The dynamics of the homopolymers PEF, PBF and PPF when studied on heating display a fast β process, a more intense αa process and a αc process with reduced dielectric strength, owing to the cold crystallization. Dielectric data for the PBF and PPF homopolymers are presented in Figure S1 - Supporting Information. The differences in glass temperatures of the homopolymers (∆Tgs) are 50 K, 35 K and 18 K for PEF- PBF, PEF-PPF and PBF-PPF blends, respectively. Dielectric spectroscopy is a technique sensitive to the presence of different rate relaxing amorphous phases in multicomponent systems.
Even thermodynamically miscible systems exhibit two glass temperatures because of chain connectivity [56]. Examples include the poly(vinylethylene)-polyisoprene (PVE-PI) system [57]
and even polystyrene homopolymer blends consisting of low and high molecular weights [58].
As shown in Figure 6a, for the PEF-PBF blend there exist two segmental processes, termed αa and two αc that correspond to the pure components (αa1 and αc1 refer to the segmental
M AN US CR IP T
AC CE PT ED
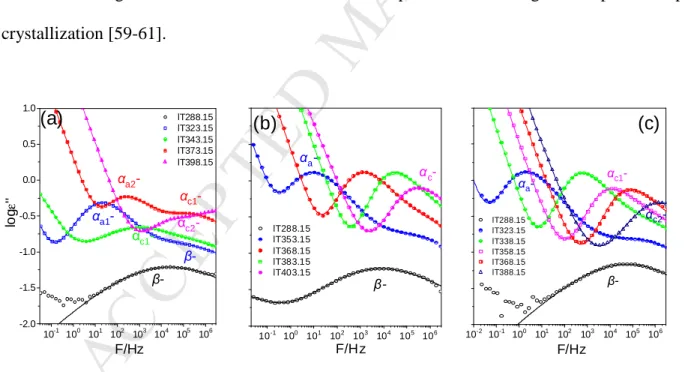
dynamics of PBF in the blend within the completely amorphous segments whereas the latter to segments within the amorphous domains of the semicrystalline polymer; similarly, αa2 and αc2 refer to the corresponding processes of PEF in the blend). At lower temperatures a single β- process exists despite the slightly different β-processes in the homopolymers. However, the β- process is very broad reflecting the heterogeneous dynamics of the glassy state. The dielectric loss curves of PEF-PBF blend are fitted at different temperatures in order to visualize the different fitting contribution to the total relaxation (Figure S2-Supporting Information). On the other hand, the PEF-PPF blend exhibits only one αa, and hence one αc as well as a single β process, as depicted in Figure 6b. In the PBF-PPF blend there is again a single αa, that on crystallization transforms to the αc process and again a single β processes (Figure 6c). The dual αc processes in PEF-PBF and the single αc process in PEF-PPF and in PBF-PPF have reduced dielectric strengths that reflect the restrictions imposed on the segmental process upon crystallization [59-61].
10-1 100 101 102 103 104 105 106 -2.0
-1.5 -1.0 -0.5 0.0 0.5 1.0
lT288.15 lT323.15 lT343.15 lT373.15 lT398.15
αc2- αc1- αa2-
αc1-
β-
logε''
F/Hz β- αa1-
(a)
10-1 100 101 102 103 104 105 106 lT288.15
lT353.15 lT368.15 lT383.15 lT403.15
αc-
F/Hz αa-
β-
(b)
10-2 10-1 100 101 102 103 104 105 106 lT288.15
lT323.15 lT338.15 lT358.15 lT368.15 lT388.15
αc2- αc1-
F/Hz β- αa-
(c)
Figure 6. Representative dielectric loss curves as a function of frequency for (a) PEF-PBF 50-50 (temperatures in the range from 288 to 398 K), (b) PEF-PPF 50-50 (temperatures in the range from 288 to 403 K) and (c) PBF-PPF 50-50 (temperatures in the range from 288 to 368 K). The solid lines represent fits to a summation of Havriliak−Negami functions in addition to the dc-
M AN US CR IP T
AC CE PT ED
conductivity contribution at lower frequencies. Both, the low temperature β-process and the segmental αa and αc processes are shown.
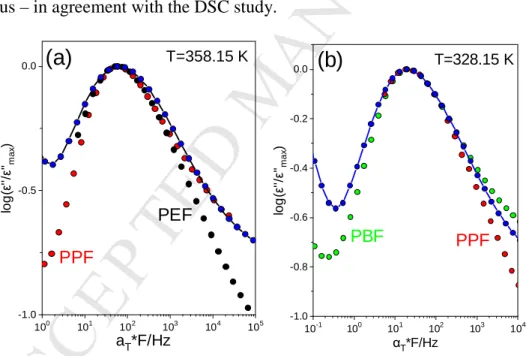
Concerning the shape of loss curves for the αa process, peak broadening, especially from the low frequency side, was observed in the blends showing a single Tg (PEF-PPF, PBF-PPF) in comparison to the respective homopolymers, as depicted in Figure 7. This implies that these blends are dynamically homogeneous but with a broader distribution of relaxation times than the respective homopolymers. This finding is in agreement with the single Tg found by DSC and provides additional information on the distribution not easily accessible by the latter method. On the contrary, the PEF-PBF blend with the dual segmental dynamics is clearly dynamically heterogeneous – in agreement with the DSC study.
100 101 102 103 104 105 -1.0
-0.5 0.0
log(ε''/ε''max)
aT*F/Hz
T=358.15 K
(a)
PEF PPF
10-1 100 101 102 103 104 -1.0
-0.8 -0.6 -0.4 -0.2
0.0
(b)
log(ε''/ε''max)
αΤ*F/Hz
T=328.15 K
PBF PPF
Figure 7. Comparison of the shifted dielectric loss curves for (a) PEF (black circles), PPF (red circles) and PEF-PPF blend (blue circles) with composition 50-50 at 358.15 K and (b) PBF (green circles), PPF (red circles) and PBF-PPF blend (blue circles) at 328.15 K. The data have been vertically and horizontally shifted so as to coincide at the maximum of the dielectric loss peak.
M AN US CR IP T
AC CE PT ED
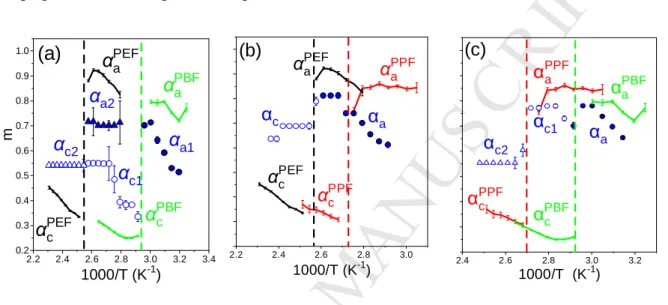
The low- and high- frequency slopes of the dielectric loss curves for the αa and αc
processes in all homopolymers and their respective blends can better be discussed with respect to Figure 8. A broadening in the distribution of relaxation times is revealed, especially from the low frequency side, for the amorphous part and rather surprisingly, a narrowing in the distribution of relaxation times for the semi-crystalline part. Furthermore, the low frequency shape parameter is temperature dependent in all blends.
2.2 2.4 2.6 2.8 3.0 3.2 3.4 0.2
0.3 0.4 0.5 0.6 0.7 0.8 0.9 1.0
αPEFc αPBFc αPEFa
αPBFa
αc2
αc1 αa2
αa1
m
1000/T (K-1)
(a)
2.2 2.4 2.6 2.8 3.0
αPPFa αPEFa
αPEFc αPPFc αc
1000/T (K-1)
(b)
αa
2.4 2.6 2.8 3.0 3.2
αPPF
a
αPPF
c αPBF
c
αc2
αc1
1000/T (K-1)
(c)
αa
αPBF
a
Figure 8. Inverse temperature dependence of the low-frequency HN shape parameter (m) of the αa (filled symbols) and αc (open symbols) for the different blends (blue symbols) with composition 50-50; (a) PEF-PBF- α1 process (circles) and α2 process (up-triangles), (b) PEF-PPF and (c) PBF-PPF, and the respective homopolymers; PEF (black lines), PPF (red lines) and PBF (green lines). The vertical dashed lines indicate the cold crystallization temperatures of the homopolymers.
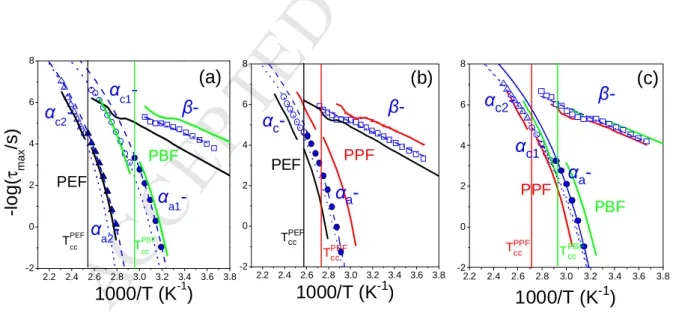
Precise information of the dynamic homogeneity/heterogeneity can be obtained by following the segmental dynamics (and local) as a function of temperature. The corresponding relaxation times are depicted in Figure 9 in the usual activation diagram. The β- process conforms to an Arrhenius T-dependence as
! = !#'() *+
M AN US CR IP T
AC CE PT ED
where τo (= 10 s) is the relaxation time in the limit of very high temperatures and E is the activation energy. Both the αa and αc processes conform to the Vogel-Fulcher-Tammann (VFT) dependence as
! = !#'() .
− #
Here, τo is the relaxation time at very high temperatures, B is the activation parameter and To is the “ideal” glass temperature located below the conventional glass temperature. The activation energies amount to 55±1 kJ/mol, 55.2±0.3 kJ/mol and 51.6±0.9 kJ/mol for the PEF-PBF, PEF- PPF and PBF-PPF blends, respectively (respective values of το= 5.6x10⁻¹⁵ s, 1.2x10⁻¹⁴ s and 8.5x10⁻¹⁵ s). Values of these parameters, as well as the TgDS
(defined as the temperature where the segmental relaxation time is at 100 s) and the TgDSC, for all blends with composition 50-50 are listed in Table 2. The segmental relaxation times corresponding to the αc process are slower as compared to the (extrapolated) times from the αa process, i.e, there is discontinuous change at the cold crystallization temperature as was observed previously [59-61].
2.2 2.4 2.6 2.8 3.0 3.2 3.4 3.6 3.8 -2
0 2 4 6 8
TPBFcc
αc2-
αa2- αc1-
αa1- -log(τ max/s)
1000/T (K-1) β-
PEF
PBF
(a)
TPEFcc
2.2 2.4 2.6 2.8 3.0 3.2 3.4 3.6 3.8 -2
0 2 4 6 8
TPPFcc TPEFcc
PEF
1000/T (K-1) αc-
αa- β-
PPF
(b)
2.2 2.4 2.6 2.8 3.0 3.2 3.4 3.6 3.8 -2
0 2 4 6 8
TPBFcc
αc2-
1000/T (K-1) αa- αc1-
β-
PPF
PBF
(c)
TPPFcc
Figure 9. Relaxation map of the αa and αc processes for (a) PEF-PBF 50-50, (b) PEF-PPF 50-50 and (c) PBF-PPF 50-50. Solid lines represent the relaxation times of PEF (black line), PPF (red line) and PBF (green line) homopolymers. Dashed and dotted lines are fits to the VFT equation
M AN US CR IP T
AC CE PT ED
for the β process. The vertical lines indicate the cold-crystallization temperatures of the homopolymers.
M AN US CR IP T
AC CE PT ED
Table 2. Vogel - Fulcher - Tammann (VFT) parameters of the αa and αc process for the amorphous furanoate blends and the glass temperatures.
Sample code -log(τmax/s)a B (K) T0 (K) Tg (K)b PEF-PBF 50-50 (αa1) 14 2100 ± 50 252±2 309±2 PEF-PBF 50-50 (αa2) 14 2380 ± 40 284±1 349 ± 1
PEF-PPF 50-50 14 2290 ± 50 278± 2 340± 2
PBF-PPF 50-50 14 2130 ± 70 256± 2 314±2
PEF-PBF 50-50 (αc1) 14 2300 ± 30 252±2 314 ± 2 PEF-PBF 50-50 (αc2) 14 2200 ±
100
300 ±5 359±5
PEF-PPF 50-50 14 2570 ± 70 272± 4 342± 4
PBF-PPF 50-50 (αc1) 14 2560 ± 50 246± 2 316± 5 PBF-PPF 50-50 (αc2) 14 2560 ± 60 245± 3 315± 3
a
Value held fixed. bfrom DS at τ =100s.
In conclusion, the dynamic investigation of the three blends revealed dynamically homogeneous mixtures when the backbones differ by a single methylene unit and dynamically heterogeneous mixtures when they differ by two methylene units. The latter display dual segmental relaxations as anticipated by the respective homopolymers. The most interesting finding was the single segmental dynamics in the PEF-PPF and PBF-PPF blends despite the appreciable difference of the glass temperatures in the homopolymers. This together with the Tg(φ) dependence calls for specific interactions between these homopolymers that effectively
“homogenize” the dynamic response at the segmental level.
M AN US CR IP T
AC CE PT ED
- Terephtalate-based Blends
In the previous parts, the effect of the length of the aliphatic diol segments on the miscibility and dynamic homogeneity of alipharomatic polyesters’ pairs was studied. To evaluate the effect of the geometry and mobility of the aromatic rigid segment a second set of blends, consisting of terephthalate-based polyesters was also studied. Terephthalate-based polyesters are of special importance due to their wide range of applications, while furanoates are considered the biobased counterparts to fossil-based terephthalates. The main difference between 2,5- furandicarboxylic acid and terephthalic acid is that the p-phenyl connection in TA lead to the carboxylic acid carbons displaying and angle of 180o, while the relevant angle in FCDA is 129.4o, as a result of the nonlinear structure of FCDA [62]. Also, furan ring-flipping is greatly suppressed in furanoates compared to the active phenyl ring-flipping mechanism in terephthalates [62].
As can be seen in Figure 10a and Figure S3a (SI), a single composition dependent glass temperature appeared at every composition for PET-PPT blends. This is in agreement with the findings of Woo et al. [41]. PPT crystallizes faster from the amorphous state compared to PET, resulting in a sharp cold-crystallization peak. Both blend components crystallized during the heating of the essentially amorphous materials. PBT on the other hand, is a very fast crystallizing polymer that cannot be obtained in the amorphous state (Figure 10b,c-Figrue S3b,c / SI). Both PBT-PPT and PET-PBT blends with high PPT or PET content respectively, showed a clear glass temperature, in accordance with literature [63]. In any case, a single composition-dependent Tg
appeared, though a significant amount of crystallinity was generated upon quenching for the blends with high PBT content. This was also demonstrated by the derivative heat flow curves with temperature (Figure S3b,c / SI).
M AN US CR IP T
AC CE PT ED
The Tg values decrease linearly for the case of the PET-PPT blends (Figure 11a). For the PBT-PPT and PET-PBT blends deviations from linearity were observed for large PBT contents (Figures 11b and c), but this is because the samples were in fact semicrystalline, so the measured Tgs were higher than the expected for amorphous specimens. Finally, melting point depression can be observed for PET-PPT and PBT-PPT blends, while it is absent in case of PET-PBT mixtures. PET and PPT differ by a single methylene group in the repeating units. The same holds for PPT and PBT. The respective difference between PET and PBT is two methylene groups. So, it was expected that the PET-PPT and PBT-PPT blends would show increased miscibility due to the similarities in the structure of their components. This however is not the case for PET-PBT blends, despite the single glass temperature. It is important here to note that for respective furanoate-based PEF-PBF blends, dual glass temperatures were observed, since the dynamics of these polymers are quite different. The existence of the furan ring instead of the benzene one, causes restrictions in mobility, which combined with the differences in the repeating units of the furan-based polyesters result in differences in the dynamics of the glassy polymers.
250 300 350 400 450 500 550 PPT
PET-PPT 25-75
PET-PPT 50-50
Heat Flow (W/g) Endo Up
Temperature (K) PET
PET-PPT 75-25
PET-PPT blends (a)
2 W/g
250 300 350 400 450 500 550
(b)
PBT-PPT 75-25
PBT-PPT 50-50
Heat Flow (W/g) Endo Up
Temperature (K)
PBT-PPT blends
PPT PBT-PPT 25-75
1.5 W/g PBT
300 350 400 450 500 550
(c) PET-PBT blends
PBT PET-PBT 25-75 PET-PBT 50-50
Heat Flow (W/g) Endo Up
Temperature (K) PET PET-PBT 75-25
1 W/g
Figure 10. a) DSC heating traces for quenched samples of a) PET-PPT b) PET-PBT and c) PBT- PPT blends.
M AN US CR IP T
AC CE PT ED
-10 0 10 20 30 40 50 60 70 80 90 100 110 315
320 325 330 335 340 345 350 355 360
Glass Temperature (K)
PPT content (wt %) PET-PPT blends
(a)
-10 0 10 20 30 40 50 60 70 80 90 100 110 304
306 308 310 312 314 316 318 320 322 324
Glass Temperature (K)
PPT content (wt %) PBT-PPT blends
Semicrystalline
(b)
-10 0 10 20 30 40 50 60 70 80 90 100 110 310
320 330 340 350 360
Glass Temperature (K)
PPT content (wt %)
PET-PBT blends
Semicrystalline
(c)
Figure 11. Dependence of the glass temperature of a) PEF-PPF blends on the PPF content, b) PEF and PBF on the PBF content in PEF-PBF blends and c) PBF-PPF blends on the PBF content.
Reactive Blending
Since the majority of polymer blends are rather immiscible, reactive blending can be utilized in order to achieve blending and lead to an increased homogeneity, due to the ultimate formation of random copolymers [64]. Heating a blend of two polyesters at elevated temperatures well above the melting temperatures of both components results in transesterification reactions [65]. So, after a brief time of melt mixing block copolymers are formed, while these finally turn to random copolymers after a prolonged process. In this work, the effects of reactive blending were studied for the PEF-PBF blends, as they showed a dual glass temperature. The case of the PEF-PBF 50- 50 blend is presented in the following as an example. To simulate the effect of reactive blending in an extruder, the PEF-PBF 50-50 sample was heated to 503 K and held for 1 min before quenching. The subsequent heating scan was recorded to investigate the glass-to-liquid behavior.
The same procedure was repeated several times. Figure 12a shows the DSC traces of the PEF-
M AN US CR IP T
AC CE PT ED
PBF 50-50 blend following reactive blending at 503 K for various times. For reactive blending times below 5 min, two glass temperatures were recorded, followed by cold-crystallization and melting. Details of the glass temperatures can be viewed in Figure 12b. Longer reaction times were also applied and the corresponding traces in Figures 12a and b revealed a single glass temperature. As can be seen in the plots of Figure 12c for the derivative of heat flow, reactive blending for at least 15 min was necessary in order to obtain a single glass temperature. In fact, after 20 min, a single, relatively narrow glass temperature evidenced the formation of a random copolymer. The dependence of the intrinsic viscosity on the time of reactive blending for the PEF-PBF 50-50 blend can be seen in Figure 12d and as expected, larger mixing times lead to a decrease in the viscosity, which reaches a plateau value after mixing for 5 minutes.
300 350 400 450 500
15 min 20 min
10 min 5 min 4 min 3 min 2 min
Heat Flow (W/g) Endo Up
Temperature (K)
Crystallized Quenched original
1 min
PEF-PBF 50-50 reactive blending
0.5 W/g
(a)
280 300 320 340 360 380
PEF-PBF 50-50 Reactive blending
20 min 15 min 10 min 5 min 4 min 3 min
2 min
Heat Flow (W/g) Endo Up
Temperature (K)
Original 1 min
(b)
0.1 W/g
300 320 340 360 380
20 min 15 min 10 min
5 min 4 min 3 min
2 min
Derivative of Heat Flow
Original 1 min
PEF-PBF 50-50 Reactive blending
(c)
0 5 10 15 20
0.45 0.50 0.55 0.60 0.65 0.70
Intrinsic Viscosity (dL/g)
PEF-PBF 50-50 reactive blending
(d)
M AN US CR IP T
AC CE PT ED
Figure 12. a) DSC heating traces, b) details of the DSC heating traces in the glass temperature region, c) derivative of heat flow vs temperature for quenched PEF-PBF 50-50 blend samples after reactive blending at 503 K for the indicated times. d) Dependence of the intrinsic viscosity of the PEF-PBF 50-50 blend on the time of reactive blending at 503 K.
To test the validity of the above hypothesis about the formation of a copolymer after reactive blending, 1H NMR analysis was carried out for both neat homopolyesters PEF and PBF as well as PEF-PBF 50-50 sample that had undergone reactive blending for various times up to 20 min (Figure 13a). The 1H NMR spectrum of PEF-PBF 50-50 with the peak assignments after 20 min of reactive blending step corroborates the structural information wherein no additional peaks were found in the spectra, and also allows one to observe the interchange reaction between PEF and PBF unit, which brings out the creation of hetero-unit. This could be determined from the proton NMR spectra of the aromatic protons in furan unit as they are sensitive to the connected ester linkage and its chemical shift is affected by the different ester bond. As it is shown in Figure 13b, the signals assigned to the furanoate ring protons (a), located respectively at 7.47 and 7.86 ppm in the homopolyesters PBF and PEF, appear as single peaks before reactive blending process. In addition, a new central peak detected at 7.51-7.55 ppm range for PEF-PBF 50-50, which is not observed in the 1H NMR spectra of the corresponding homopolyesters PEF and PBF, was observed with a lapse of time after 20 min of reactive blending step and was split into a multiplet consisting of 4 overlapped peaks corresponding to four different types of aromatic protons (a1, a2, a3+a4). The latter is due to the furan ring bonded to the different types of diols (ethylene and butylene groups) at both sides, so the existence of three possible environments for furan fragment: the homo moieties E.E and B.B, and the hetero moiety, E.B, where E and B represented the ethylene and butylene units, respectively (Figure 14). This
M AN US CR IP T
AC CE PT ED
observation explains that a mixture of two kinds of homopolyester, PEF and PBF, transforms gradually to a random copolyester by transesterification reaction for 20 min at 503 K.
Figure 13. a) 1H NMR spectra for the neat PEF and PBF as well as PEF-PBF 50-50 blend following reactive blending and b) magnified area from the 1H NMR spectra for PEF-PBF 50-50 blend following 20 mins of reactive blending.
M AN US CR IP T
AC CE PT ED
Figure 14. Chemical structures of EFE, EFB and BFB units in the prepared PEF-PBF copolyester after reactive blending.
The degree of randomness (R) of the PEF-PBF 50-50 was calculated using the following equations (1-6):
R= PB.E + PE.B (1)
PBE= [(∫B.E+∫E.B)/2] / [(∫B.E+∫E.B)/2 + ∫B.B] = 1/LnB (2) PEB= [(∫E.B+∫B.E)/2] / [(∫E.B+∫E.B)/2 + ∫E.E] = 1/LnE (3)
∫B.B= Ia1 / (Ia1+Ia2+Ia3+Ia4) (4)
∫B.E= (Ia3 + Ia4) / (Ia1+Ia2+Ia3+Ia4) (5)
∫E.E= Ia2 / (Ia1+Ia2+Ia3+Ia4) (6)
Where PBE and PEB are the probability of finding hetero-linkage unit: an ethylene (E) unit next to a butylene (B) unit and the probability of finding a B unit next to a E unit respectively, while LnE
and LnB are the number average sequence length of the repeating units, the so-called block length, calculated according to Yamadera and Muand by the equations (2) and (3). Furthermore,
∫B.B, ∫B.E and ∫E.E represent the triads fractions of BFB, BFE and EFE and were calculated from the integral intensities of the resonance signals using the equations (4)-(6), in which the
M AN US CR IP T
AC CE PT ED
integration of shift I was tagged as Ii. The corresponding results were listed in Table 3.
According to the Bernoullian statistics [65], for PEF-PBF, R value was close to 1 indicating that random copolyester was the preferred structure.
Table 3. Experimentala Sequence Distribution and Randomness in the prepared PEF-PBF 50-50 copolyester after reactive blending for 20 min.
Copolyester samples
Triads (mol %)b Probability Block length Degree of Randomness
(R)
∫
B.B∫
B.E∫
E.EP
B.EP
E.BL
nBL
nEPEF-PBF 50/50 15.05 27.95 56.98 0.65 0.33 1.53 3.03 0.98
a Experimental values were calculated from integrations of 1H NMR peaks.
b Triad contents relative to the total of sequences centered at the ethylene and butylene units.
IV. CONCLUSIONS
Polyester blends comprised of furanoate polyesters which differ by one or two methylene groups in their repeating units were prepared and their structure, the thermodynamic state and the local segmental dynamics were investigated. Amorphous PEF-PPF and PBF-PPF blends showed a single composition dependent Tg. However, a broadening was observed in the glass temperature for intermediate compositions. On the other hand, PEF-PBF blends showed distinct glass temperatures for the two components, despite the shift to intermediate temperatures. The dynamic investigation of the three blends with DS revealed dynamically homogeneous blends when the backbones differ by a single methylene unit and dynamically heterogeneous blends when they differ by two methylene units. In the other two types of blends investigated herein,
![Table 1. Intrinsic viscosity [η] values of furanoate and terephthalate-based homopolyesters and their corresponding polymer blends](https://thumb-eu.123doks.com/thumbv2/pdfplayerco/299756.41378/11.892.203.595.619.1040/table-intrinsic-viscosity-furanoate-terephthalate-homopolyesters-corresponding-polymer.webp)