Dissertations remain the intellectual property of the students ("authors/creators"), but in connection with the open access policy, they grant HOU a non-exclusive license to use the right for reproduction, adaptation, public lending, presentation to an audience and digital dissemination thereof internationally, in electronic form and in any way for teaching and research purposes, without charge and for the duration of intellectual property rights. Free access to the full text to study and read in no way means that the author/creator must assign his/her intellectual property rights, nor may he/she allow reproduction, republishing, copying, storage, sale, commercial use, transmission, distribution , publishing, executing, downloading, uploading, translating, modifying in any way any part or summary of the thesis without the express prior written consent of the author/creator. The scope of the thesis is the presentation and analysis of different types of financial ratios, after which examples will be given of adjustments to ratios at Greek companies in the years before and after the crisis.
The result will give information about how the ratio helps to understand the financial situation of the company and how the crisis affects them. The economic crisis has changed the economic world, people are more afraid of losing money and want more information about the companies they are interested in. The decisions taken are aimed at profit and increasing the company's reputation.
Companies listed on the stock exchange in particular wanted to increase the price of company shares. That dissertation will first include a general reference to accounting and different types of analysis, then a presentation of the different types of ratios, and finally a use of ratios.
Accounting and Financial analysis
Prepared to provide information about the firm to interested parties, therefore they are public, as a result those interested (investors, banks) can receive it. Profit or loss is the result at the end, the deduction of expenses from income, if the result is positive the firm has income, if it is negative there is loss. Internal parties are in an advantageous position because they have all the data they need and the people to help them within the firm.
The purpose of the internal analysis is to further control and observe the company in order to avoid problems and remain stable. External analysts, who are more interested in the company's financial position and its performance, are more concerned about the company's profit and the company's stability in the market. Investments are risky, so they want an accurate financial analysis of the company, eliminate risk and take into account all factors that can affect the result.
Banks interested in knowing if the company's financials are able to cover the obligations, if the loan will pay on time without trading, they also want to know about the company's past and present, if the property it owns will cover the loan if the company has financial problems. The banks and creditors, which they value when it comes to investment security, they want to be sure that the company will cover the obligations, for that reason they examine the company's property in detail, so that if the company cannot pay the loan or the other obligations in terms of confiscating the land or equipped.
RATIO ANALYSIS
From the definition, it understands an indicator that interests the investors more who want to discover how to make use of the assets to make a profit. Gross profit margin is an indicator of the financial success and viability of a product or service. This is one of the calculations traditionally used when determining a company's return on capital.
The equity ratio shows how much of the company's assets are financed by shares. This measure indicates how much of the assets are covered by the owners' investments. A high result implies that the company is not using debt to cover assets. In other words, the company's assets are financed 2-for-1 by investors to creditors.
The ratio shows the relative exposure of shareholders and debt holders to the company's fixed assets, how much from net fixed assets financed from shareholders. This metric indicates the profitability of a company, showing the amount each share of stock would receive if the entire profit was distributed to the outstanding shares at the end of the year.
RATIOS IN A FIRM
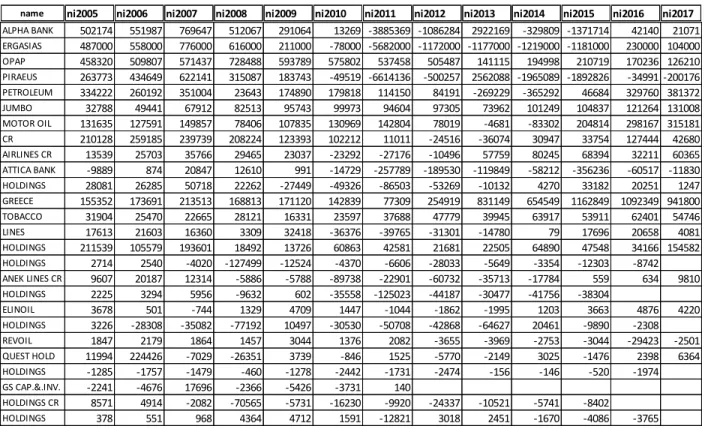
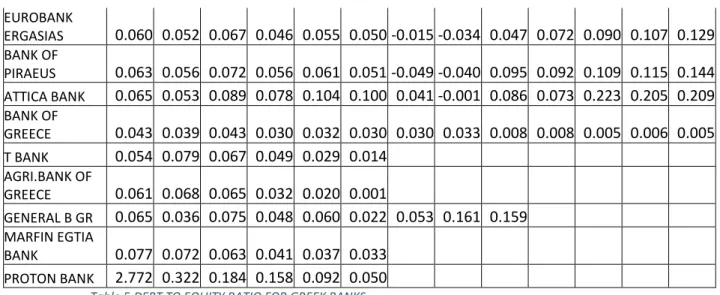
Because of the situation, people do not pay and that is a big problem for the banks. The net profit margin for the banking sector in that period is also low, due to risk. The gross profit margin is stable over the years, except for the year that the tax rate is a good indicator for the company.
Financial leverage shows how much of the assets belong to the shareholders, the results are scalable in years, but everything shows that the debt can be covered. DEBT RATIO DEBT TO EQUITY CAPITAL TO NET DEBT PROFIT MARGIN GROSS PROFIT MARGIN INVENTORY TURNOVER. DEBT RATIO DEBT TO DEBT EQUITY NET PROFIT MARGIN GROSS PROFIT MARGIN INVENTORY TURNOVER PAYABLES CASH FLOW TOTAL ASSETS.
On the other hand, the debt-to-equity ratio for Aegean is high in the years, it is not a surprise because airline companies have high expenses, the purchase of aircraft for revival requires a lot of money, also the seasonality of the airline company increases the relationship. Both of those ratios depend on the industry, airline industry has high expenses that affect the results. ROE is greater than ROE, that difference depends on debt, the dept of the firm affects the results and increases the ROE.
The net profit margin shows the financial stability of the firm, most years it is almost 0.19 or 19%, it is an acceptable number but it is not bad, the company generates 0.19 euros for every sale in dollars. DEBT TO EQUITY RATIO CAPITAL TO DEBT NET PROFIT MARGIN GROSS PROFIT MARGIN INVENTORY CASH FLOW PAYABLE CASH PAYABLE CASH TOTAL ASSETS CASH FLOW CASH FLOW OPERATIONS. In the table, the total asset turnover ratio in 2005 is 0.7, which shows that the company operates efficiently, but the year 2008 has a decline due to the crisis in the construction sector, which affected a lot, most of the construction works stopped for this reason sales. and the ratio with.
DEBT TO TOTAL ASSETS DEBT TO EQUITY NET PROFIT MARGIN BUTTOADVANCE STOCK TURNOVER CASH FLOW FROM OPERATIONS. Debt to equity shows how risky a company can be, in Titan the ratio is stable over the financial years and fluctuates from 0.5 to 0.4, which means that the company's creditors only own a small percentage of the company's assets, it is financed more from the investors. The profits from the two companies fell, the affection of the crisis was great from both shipping companies.
Both companies have negative results during the crisis period and after that, especially Anek Lines in 2017 has a high negative result, the net profit of this year is also negative, and in the last year, the capital is negative, the company is less efficient. . The gross profit margin is higher for the first company but with a little difference and the year 2010-2012 the second company has a higher number because it has more sales, after calculating the average the first one has 0.27 and the second one has 0.24 both have high scores for those years , even due to the increase in fuel prices, sales did not fall much. The net profit margin shows how much of the net income comes from sales, for this company it is close to 0.6 or 6% most of the year (the average for the company is 0.61), only in years it has a big drop of almost 3.
Karelia the entire year's total turnover for the inventory, the increase in the ratio occurs in all those years.
CONCLUSION
In fact, Jumbo SA, hit by the crisis, efficiently uses assets that are more debt-based, and the cash does not cover the liabilities at all. Titan was hit by a crisis due to the shutdown of the construction sector in Greece those years. Large companies have low ratios because the investments they made Titan made a lot of investments around the world. The downturn in the construction industry also had a major impact on the company's revenues, which is why the ratios are low.
Shipping companies Minoan and Anek lines affected by crisis, but at low levels, because people do not stop to move, not only for holidays, for many other reasons. Both after the crisis years begin to rise again, the shipping sector is also affected by the large increase in fuel in those years and the expenses in that sector are too high. Karellias SA has good results, is affected by crisis, but could say at a lower level than the other companies, it must happen because Greeks smoke and in the crisis and stress period smoke more, the income may decrease, but at low levels.
Finally, holding companies, even if they were market leaders, were not affected by the crisis, high taxes, the crisis in Europe in general, they lowered their ratios and increased their debts. Mutilinaios holding even has a high debt less affected than others, in general Holdings whose main activity is telecommunications are less affected than those dealing with real estate and transport, even some Holdings closed due to the crisis. The general conclusion is that the crisis affected all companies in all sectors of the economy, it changed the world economy and the Greek economy much more, through the analysis of economic indicators, it was determined how much companies were affected, the results show that some are at a high level, while others at a low level.
Analysis of the report helps to understand how things change in that period, which sector was affected more and which less. The sample of analyzed companies showed that the crisis affected all sectors of the economy, even the most powerful.