Instrumentation
Subject
Document structure
Binary instrumentation is performed using unmodified compiled code, as opposed to source-based instrumentation, which requires editing the program's source code. Source-based instrumentation is obviously more flexible, but binary instrumentation is more convenient or even the only option when source code is not available. It should always be kept in mind that the very act of instrumentation potentially changes the behavior of the program being measured, especially temporally.
Intel pin
- Name
- Synopsis
- Description
- Return Value
The analysis routines themselves can be placed against individual instructions, blocks of commands, or routines of the source binary code. Callingsbrk() with an increment of 0 can be used to find the current location of the program break. On success, sbrk() returns the previous program break. If the break was incremented, then this value is a pointer to the start of newly allocated memory).
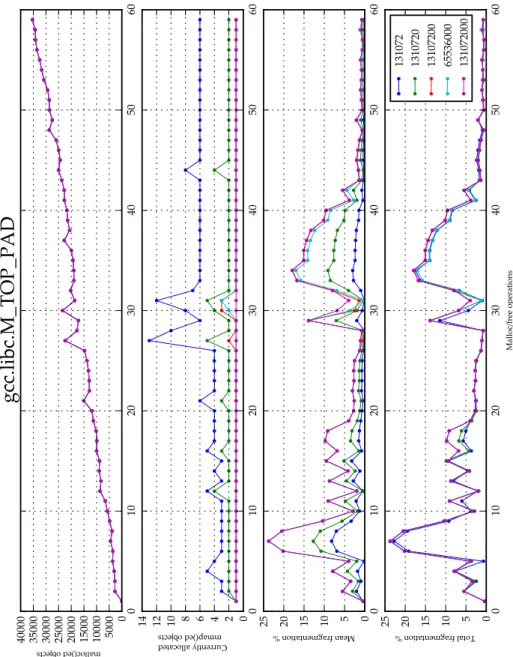
Another optimization we applied was the implementation of a cache structure in front of the tree of memory objects. We also used atomic increments where possible (Listing4.9). If the memory manager uses the traditional heap, we calculate the spatial metrics using the unmatched memory objects from the previous step and the known heap extents. M_TOP_- PAD is a glibc allocator parameter that controls the minimum value of the size argument passed to sbrk.
When the glibc allocator is out of free space, if the request's size is above M_MAP_THRESHOLD, it uses mmap instead of the heap. We should explore using kernel performance counters instead of the naive timestamp counter.
Name
Synopsis
Description
Return Value
Name
Synopsis
Description
Return Value
To store said state, we use two binary search trees, one for areas allocated by malloc, called mem objects (Listing4.1), and one for areas allocated by the Mmap family, called mmap objects (Listing4.2). Since the guard function must not contain jump instructions in order to be inserted, we had to manually adjust the returned boolean expression to force the compiler to not use jump instructions (Listing4.7)(Listing4.8). However, it was quickly realized that the overhead of locking data structures for multi-threaded access resulted in slowness on the rough order of 50x, so a rethink was needed.
At a user-settable memory management event interval, we iterate over the entire mmap object tree (Listing 4.11). If there are more than 200 samples available, we subsample them by simply discarding the intermediate data to improve the rendering speed of the resulting encapsulated PostScript files. We do not know whether this large variance is inherent to the memory management algorithm or whether it is due to cycle noise, either idle processes or kernel mode cycles, or even instrumentation overhead. We also cannot rule out the possibility of an error in our timing routing implementation.
In the splash family of benchmarks, we notice that the total memory map is slightly higher for the glibc allocator. In body trace and swap benchmarks, mapped memory appears to be significantly higher for the glibc allocator. Note how in the tonto standard the currently mapped space of glibc sits significantly higher. This is because for a small moment the program requires so much memory (edge in graph 5 currently allocated). The glibc implementation, being heap-based, cannot release this memory back to the system. is behavior is discussed in detail in the next section.
Mmaps are more expensive than sbrk and the fact that they have to be paged can lead to wasted space, but they offer the advantage that they can be released back into the system by freeing the respective chunk without leaving empty areas. If these requests fall below the threshold, after the respective objects have been freed, they will leave a hole in the heap (where they had been allocated), an event represented in the graphs by two vertices in the fragmentation graph lagging behind the original storms . In contrast, when the threshold is sufficiently low, these objects would leave the heap fragmentation unaffected and the respective mapped areas would be completely released back into the system.
Note that, in the case of heap allocation, the heap does not shrink back to its original size, due to the fact that the heap can only shrink from the top plus the conservative trim policy.

Benchmarks
Functionality evaluation
We observe the expected positive correlation between memory objects and mapped objects, both overall size and population. However, we notice that the standard deviation of the average cost in cycles is very high. Actually, it's an artifact that appears because glibc allocates thread-specific arenas using MAP_NORESERVE, speculating that it may never completely need the mapped space.

Workload specific results
M_TOP_PAD
If the requested sbrk is smaller than M_TOP_PAD it is filled to that size. However, this can lead to a waste of space if the default area is never used.
M_MAP_THRESHOLD
Lowering M_MAP_THRESHOLD results in these requests rising above the threshold and thus an increase and subsequent decrease of mapped areas parallel to the storms.

SYSALLOC_SZ
Summary
Future Additions