One of the most popular methods of analyzing, evaluating and interpreting financial statements is the calculation of financial statements, which involves the analysis of the main financial ratios that emerge from the company's financial statements. After introducing the main concepts, they will be applied to the study of fee data sets of various Greek companies from recent years.
Introduction
- Topic and purpose of the thesis
- Methodology
- Structure of the thesis
- Forecasting and the role of accounting
- The contribution of financial analysis
- Success of forecasts
- The analysis of forecasts
- Asymmetric information
- Financial Ratios
Regardless of the changes that may occur in the above relationships, financial indicators must provide the interested party with the required information. At this point, it is useful to refer to the contribution of the DuPont model in analyzing this relationship.
Literature Review
One of the most commonly used ratios that has been extensively researched is return on equity (ROE). One of the goals of financial statement analysis is to determine the value of a company.
Financial Crisis
General Context
The causes of the International Crisis
In any case, it is still too early to answer the question of what the new theories of the crisis will be in 2008. All these "explanations" have a dose of truth and touch on an important aspect of the crisis.
Main explanations for the 2008 crisis
But in order for public money to be solvent, the governments of the United States and the European Union were forced not to print it, but to borrow it from those who had savings: from Chinese, Japanese, Arab and German investors (e.g. from pension funds and many individuals who preferred to lend to states rather than banks after banks were "discovered"). After the government bailed them out, in the United States and Europe, the banks did not change their way of working: First, they began to lend to the countries with the highest borrowing needs (such as Greece) from the public money they received from them, and with high interest rates. Naturally, this interface led to the conformation of the value of the CDS and the interest rates to be paid to Greece or Spain for private loans.
As CDS rose, so did the interest states paid to individuals on new loans. Some institutions began to produce new toxic private money, betting that parts of the European public (e.g. the Greeks) would fail. But this repayment was only done with new toxic private money, instead of the money that had crashed the markets in 2008, inevitably leading to the downturn of the crisis.
The above narrative is the dominant version of the causes of the 2008 crisis and is indeed a valid representation of the events that have characterized the financial sector in recent years. The 2008 crisis was not due to a sudden lack of liquidity in the financial system, but was corrected by the provision of sufficient liquidity by central banks. The 2008 crisis was not due to mistakes in the economic policies of the governments of that period, for example extremely low interest rates (despite the fact that the economic policies of that period can be characterized as irrational and unethical).
Financial Statements
The Dupont Model
- Analysis of profit zone
- Analysis of strategies
In conclusion, negative special items presented in a year are illustrative of the future profit margin (Fairfield, Kitching and Tang 2008). The profitability that any business represents is not a necessary feature of the industry to which it belongs and operates in the conduct of its business. Sometimes, a company's profitability is the result of the strategy that sets it apart from other companies in the industry.
The timing of the strategy that the company will implement is the factor that will determine the profitability of the company and keep it at the top of the industry. Companies with a diversity strategy offer their products and services at high prices because of the high quality, reputation or services they offer. A firm's pricing power, i.e. its innovation, product positioning, competitiveness and comparative advantage, determine the size of the profit margin (PM) (Soliman 2008).
Companies with extremely positive or negative prices will therefore show profit levels in the future that are representative of the market (Palepu, Healy, Peek 2010). Using the DuPont analysis, it is found that if a company uses the ATO and PM indices correctly, it can produce the same results regardless of the strategy to be followed. Information about the possible combinations of the above indices and how they affect the RNOA index is given in Table 1 (PM and ATO combinations for RNOA determination.
Advanced DUPONT Model
The variables in the income statement and balance sheet had to be separated according to their operational and financial nature to provide a better explanation and a more accurate forecast. In their analysis, Nissim and Penman (2001), studied the financial statements of companies in order to separate operating and financial data. This particular division was based on the theory of Modigliani and Miller, according to which the mode of AGRICULTURAL activities are those that attribute value to a company, while the net value of financial activities is zero.
Another claim that led to this separation refers to matching the prices of the company's financial assets and liabilities - as reported on the balance sheet - with their market prices (FASB Statement No. 115). Nissim and Penman, the most disaggregated operational and financial-economic data of the companies, combined with the algebraic form of the DuPont analysis, made a sophisticated model in which the financial division is attributed to the operational decisions of the companies. The presentation of the company's operations is presented through the performance of net operating assets (RNOA), while financial decisions are made through a financial leverage ratio (FLEV) and a SPREAD defined as: RNOA - NBC, where NBC is defined. as net cost of borrowing (net cost of borrowing.
Combined with DuPont's classic model, return on net operating assets is defined as the product of profit margin and velocity of assets. It has managed to completely separate the operational and financial activities of the companies and establish a stable structure in which the main forces of the reported profits are presented. The advanced DuPont model was used by (Burns, Sale and Stephan 2008) to test how operational and financial decisions affect ROE.
Financial Ratios and approaches to future forecasting using a model
- Introduction
- Market reaction analysis and study
- Effects of profit management
- Efficiency performance by using model levels and changes
From Fairfield and Yohn (2001), the resulting apparent correlation one, which shows that the separation of the change in the return on net current assets, provides important information about the profitability next year. The rate of change in the production capacity of the assets is reflected by the change in the turnover rate of the assets. Such an increase in the rate of change in asset turnover (DATO), leads to an increase in profitability next year and vice versa.
On the other hand, a change in the operating profitability or maintenance of the business occurs through the change in the profit margin (PM). Similarly, an increase in profit margin leads to an increase in future profitability and vice versa. In the third model, a variable ΔINT is introduced, which determines the interaction between ΔPM and ΔATO.
Because of the intense attention given to changes in key elements of DuPont's analysis, incentives have been given to information studies that they provide for earnings management perspectives (Jansen, Ramnath, and Yohn 2012). Ceteris paribus, when a company continuously increases its profit margin (PM) and decreases its asset turnover ratio (ATO) - resulting in an increase in operating income and a decrease in the ledger. In particular, it was found that changes in the above indicators are characterized by greater explanatory power and continuity in predicting future profitability.
Research Methodology
Research aim and objectives
Research questions
Methodology
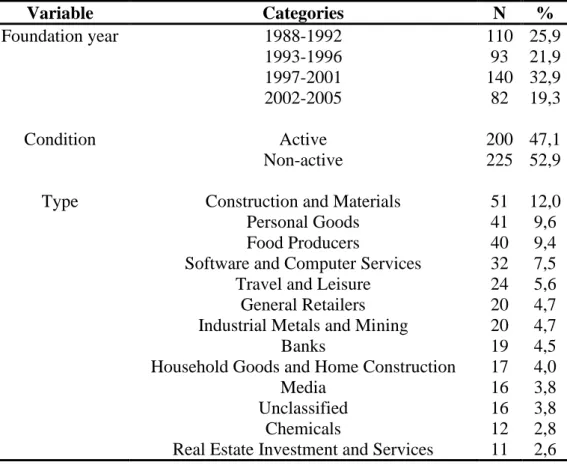
Sampling design and variables of the study
Methods of statistical analysis and limitations
Although useful and reasonable results were obtained, the AdjR2 coefficient was less than 0.4 and very low to generalize the results. Based on this research work, other researchers should further investigate new variables, companies from different parts of Greece, to strengthen the results on the predictors of ROE in Greece.
Findings
Construction & Materials Personal Products Food Manufacturers Software & Computer Services Travel & Leisure General Retailers Industrial Metals & Mining Banks Household Products & Home Building Media Unclassified Chemicals Real Estate Investments & Services Technology Hardware & Equipment Financial Services (Sector) Industrial Engineering General Industrial Healthcare Equipment & Services Support Services Non-Life Insurance Real Estate Investment Trusts Industrial Transportation Electricity Oil & Gas Producers Tobacco Beverages Electronic & Electrical Equipment Fixed Lines Telecommunications Leisure Goods Gas, Water & Multi-Purpose Businesses Pharmaceuticals & Biotechnology Food Retailers and medicines Mobile telecommunications Mining Life insurance.
Initial Variables
Independent variables
Dependent variable
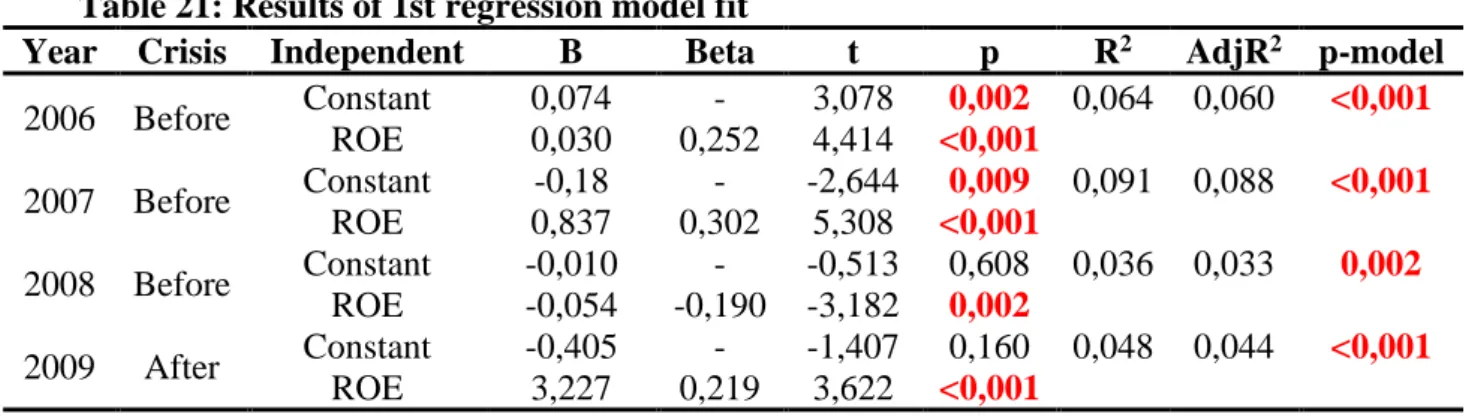
Regression Models
ROEt+1 = a0 + a1ProfitMargint+ a2AssetTurnovert+a3FLEV*FSPREADt + et Table 27 shows the results of fitting the regression model, where the model fits the data in years.
Conclusion
The 2nd research objective examined the one-year predictive ability of operating income and resting income for ROE. Results indicated that companies with high values of operating income in 2006 and 2007 had higher ROE the next year, while companies with high operating income in 2008 and 2009 had lower ROE the next year. The 3rd research objective examined the one-year predictability of operating cash flows and accruals for ROE.
However, in 2008, higher levels of operating cash flow and accruals led to lower values of ROE. The 4th research objective investigated the one-year forecasting ability of RNOA and FLEV*FSPREAD for ROE, while the 5th investigated the one-year forecasting ability of Profit Margin, Asset Turnover and FLEV*FSPREAD for ROE. Livnat, 2011, Conditional versus unconditional persistence of RNOA components: implications for valuation, Review of Accounting Studies, Vol 16, Issue 2: 302-327.
Yohn, 2001, Using asset turnover and profit margin to predict changes in profitability, Review of Accounting Studies Vol: 6, No. 4:371-385. Nobakht, 2014, A diagnostic for earnings management using changes in asset turnover and profit margin, International Review of Management and Business Research, Volume 3, Edition. Penman, 2001, Ration Analysis and Equity Valuation: From Research to Practice, Review of Accounting Studies Vol 6, No. 1: 109-154.