The purpose of this dissertation is to show the conditions that affected the industry by analyzing quantitative data provided by all available sources. The companies that were selected and reviewed epigrammatically during the preparation of this dissertation are 1) K. KARAGEORGIOU BROS S.A. "3 ALFA", 2) KEPENOU MILLS S.A. and 3) N.
Introduction
The manufacturing sector
The manufacturing sector in Greece
The top 5 sub-sectors represent 40% of gross revenues in Greece and 49% in the EU. The top 5 sub-sectors occupy 55% of the employees in Greece and 49% in the EU.
The recent economic crisis and its impact in the Greek economy
The period of global growth
The top 5 subsectors represent 39% of production value in Greece and 42% in the European Union. As observed, Greece shows a growth of 5.9%, the highest in the EU-15 (included in the upper part of the table).
The financial crisis
It maintains a fairly constant growth rate until 2008, which appears as a turning point for each country as illustrated due to the economic crisis.
The case of Greece
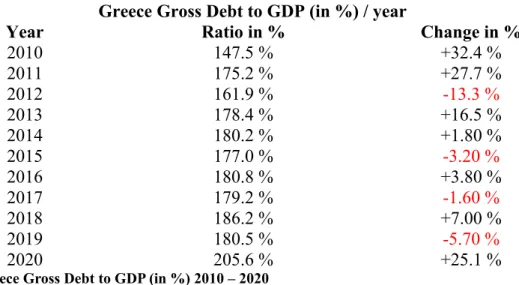
Markets that appeared to be vulnerable similar to the Greek case as long as other developed markets were put under the microscope and potentially facing the negative results of the European banks and other financial institutions. Greece was forced to be put under the supervision of the International Monetary Fund (IMF) in order to pursue a bailout that would solve this debt crisis. In order to be able to interpret the situation that prevailed in Europe in the years that came just before the outbreak of the Greek debt crisis, we therefore present the gross debt to GDP (in %) from 2004 to 2009 for the EU-27 (then).
The changes appear to be of great magnitude, especially when tracing back to 2010 and 2011 when the consequences of the debt crisis boom and the subordination to IMF supervision were made clear. Finally, before we proceed with the analysis of the following chapters of the thesis where we will deepen the local economy, by presenting its macroeconomic figures, presenting the industry as part of the environment and therefore some to analyze and interpret specific firm-matched examples, we present the long-term government bond yields (expressed in %) for the fiscal years 1999 to 2010. Higher bond yields do not appear to be beneficial for the country issuing the respective bond not, as it partly represents the interest rate that the country has to pay to the investors who choose to buy the government bonds.
If we go ahead and look at 2001, when Greece entered the European Monetary Union, there seems to be a downward trend and a significant leveling off of bond yield values. This is an undoubted measure of how severe the consequences of the crisis are for Greece. Fortunately, the country has already started issuing new bond yields while taking advantage of the low interest rates arising from the country's inclusion in the ECB's pandemic program.
The macroeconomic figures
Analyzing the macroeconomic figures of Greece
GNP is given by taking GDP at market prices found in Table 3.1, adding the primary incomes that can be received from the rest of the world, and subtracting the primary incomes that must be paid to the rest of the world. Net National Disposable Income (NNDI) = NNI + Current transfers receivable from the rest of the world – Current transfers payable to the rest of the world. Net Borrowing (+) / Net Borrowing (-) = Net Savings + Capital Transfers Receivable from the Rest of the World – Capital Transfers Payable to the Rest of the World – Gross Investment (GCF) + CFC.
The result that emerges from the data presented in Table 3.3 is that, except for the fiscal years and 2015, where Greece appears to be a net lender, for the vast majority of years from 2009 to 2019 there is a negative result of the sum representing the total payment capital and current account balances. While the effects of the pandemic are still visible at the time of writing this dissertation and it is still not possible to realistically present the macroeconomic numbers that appear for the fiscal years 2020 and 2021, it is very important to note that the numbers presented on many occasions, the analysis that will carried out in the following chapters and consequently. In addition, the analysis of the domestic macroeconomic environment, in order to be presented and interpreted, needs the presentation of several figures over the years.
A fundamental and very important measure of the current situation governing any economy is the General Consumer Price Index (GCPI). Food is one of the basic components of this measure on an annual basis and thus the presentation of GCPI plays a dominant role in better understanding the situation that governs Greece from the very beginning of the economic crisis (ELSTAT, General Consumer Price Index). in subsequent years, it appears that, on average, there is a trend whereby the total number of employed Greeks continues to balance around the 2011 employment level at around 4.5 million.

Analyzing the macroeconomic figures of the Food Industry
Looking at Figure 3.1, there has been an increase, over an eight-year period, in the gross revenues produced by the food industry by approximately €904 million. Furthermore, we choose to present the number of employees in the food industry for the years 2011 to 2018. We see that domestic industrial production in terms of employment provided is quite stable after the 8-year depth in the chart.
In general, the food industry appears to have an upward trend showing that it has been a lever for the employment levels of the Greek economy throughout these difficult years. Continue, the value of the top 5 selling products of the industry is presented for the last year available by the. Observing the Figure 3.4, it is clear that the volume of the value of products sold follows a clear upward trend.
Figure 3.5 is a visualization of the percentage value derived from the data in table 3.7 listed below divided by the total value for fiscal year 2019 as shown in Figure 3.4. Interpreting the data of Figure 3.5 and Table 3.7, we note that the 5 main types of products, in terms of the value of products sold, account for approximately 26.6% of the domestic total. The chart presented aims to give a visual perspective of the different values between the 5 main products mentioned.

Competitiveness analysis of the food industry
- PEST Analysis
- SWOT Analysis
- Porter Analysis
- Exports overview of the Food Industry
Quality assurance is a vital part of any business in the Food Industry as products a need to meet the high standards of the International Organization for Standardization (ISO). The economic environment governing the food industry can be considered a component of the economic position of any specific country. The strengths, weaknesses, opportunities and threats of the food industry in Greece are briefly presented below.
Tourism, as the main lever of the Greek economy, encourages the consumption of seasonal foods. The composition of the domestic food industry contains a large number of small or very small companies, each sharing a very small part of the market share. Nevertheless, there are a small number of companies that have a large share of the domestic market.
In terms of the threat from products that could replace what food industry companies sell, there is a mixed picture in the market. Products like milk, which constitutes a large part of the industry, appear to have no perfect substitutes and therefore do not face threats of high volume. The vast majority of food industry suppliers do not appear to have high bargaining power.
Financial statement analysis of the food industry
Brief preview of the firms analyzed
- K. KARAGEORGIOU BROS S.A. “3 ALFA”
- KEPENOU MILLS S.A
- N. TSATSARONAKIS S.A. “TO MANNA”
The company has followed all the steps from a simple water mill to a production factory in the industrial area of Patras. The company also appears to have three branches in Kavala, Aspropyrgos and the industrial area of Thessaloniki. According to the auditor's report, the company focuses on investing in new production methods and continuous training of its employees.
The company's primary activity is the production and distribution of bakery products, while faucet can be considered as its main selling product. At the end of fiscal year 2019, the company employed 106 people, evenly distributed between employees and craftsmen. As a second activity, it is active in the tourism sector as it has a hotel unit in Chania.
The company has a leading position in the Greek bakery sector and appears to have a negotiating power towards its suppliers, which is accompanied by signed cooperation agreements for suppliers of great importance.
The financial ratios
- K. KARAGEORGIOU BROS S.A. “3 ALFA” financial ratios
- KEPENOU MILLS S.A. financial ratios
- N. TSATSARONAKIS S.A. “TO MANNA” financial ratios
This specific financial statement is used to represent the company's accounts that include assets, liabilities, and the owner's equity. Liabilities (long-term, short-term, and provisions) and equity (share capital, retained earnings, treasury stock, minority interests, and other extended profits) show how assets are financed. the declaration of investment and distribution to owners. Cash flows from financing activities: An illustration of the net cash flows used to finance the business.
It is also used as a highlight of the accounting changes from the previous financial year. Generally, it aims to provide an explanation and better explanation of the income statement and balance sheet positions. To add, the attempt to analyze and illustrate the firm's performance in the previous financial year is associated with management discussions and descriptions of the company and its legal process, its risk level and factors.
However, it is of great importance to mention that while the. aim is to give an exact picture of the firm's situation, it may differ slightly from the reflection of reality. Some of the company's assets are invested in working capital while 43.5% are invested in long-term assets. The value of the dividend yield for the fiscal year 2018 is equal to 0 due to the decision of no profit distribution.
Conclusions
The Art of Company Valuation and Financial Statement Analysis: A Value Investor's Guide with Real-Life Case Studies (1st ed.). Number of legal entities, gross income, number of employees per sector of economic activity in Greece.