Performance expectancy: "the extent to which an individual perceives that using the technology system will help him improve his work performance". Facilitating conditions: "the existence of an organizational infrastructure to support the use of the new technology system".

Participants were also given the opportunity to further distribute the questionnaire to obtain greater diversity of responses regarding the demographic characteristics of the sample (gender, age, education level, income). The first part of the questionnaire aimed to collect some general information about respondents along with their demographic characteristics. The second part of the questionnaire contained questions about the users' experience with Smartbands.
Finally, based on the recommendations and comments of the pretest participants, some minor changes were made to the format of the questionnaire to improve it.

Introduction
Introduction to the topic and general discussion
The most popular wearables by far are Smartbands, also known as fitness trackers or activity trackers. However, despite the fact that fitness trackers are being widely used, little is known about how personal preferences and other individual defining characteristics are influencing attitudes towards and overall adoption of these wearable devices.
Purpose of the study
Smartbands can be connected to various web and mobile applications that provide various useful features to the user, including activity tracking, quality of sleep monitoring, heart rate recording, sending smartphone notifications, playing music, etc. The present study will try to analyze the adoption of Smartbands. in Greece with the aim of finding out about the users' patterns and preferences regarding the product features, as well as the determinants that directly influence the users' acceptance.
Structure of dissertation
In addition, by understanding the consumers' attitude and behavioral purchase intentions, this study can support the future further growth and development of smart bands in the Greek industry of wearable technologies.
Literature Review
Wearable Technology
- Applications of Smart wearable technology in the consumer market
- The global market of Wearable technology
The European Commission has divided wearable technology applications into seven sectors (Figure 2.2): security, medical, wellness, lifestyle, fitness, communication and glamor (Nagtegaal, et al., 2015). As seen in figure 2.4, wearable technology manufacturing companies are numerous and can be divided into four main categories: fitness, infotainment, healthcare and industrial.
Smartbands
- Smart bands features
- Current market of Smartbands and future prospect
All wearable fitness trackers available in the global market contain a combination of features analyzed above. It is clear that since early 2014, Fitbit has been the global leader in the wearables industry, with nearly 45% of the global market share.

Theories of technology acceptance
- Technology Acceptance model (TAM)
- Technology Acceptance model 2 (TAM 2 )
- Unified Theory of Acceptance and Use of Technology (UTAUT)
As a result, it is clear that the majority of respondents show positive purchase intention of Smartbands. It is therefore clear that the majority of respondents are already thinking about purchasing a Smartband in the near future.

Research Methodology
Introduction
Research strategy
Research objectives
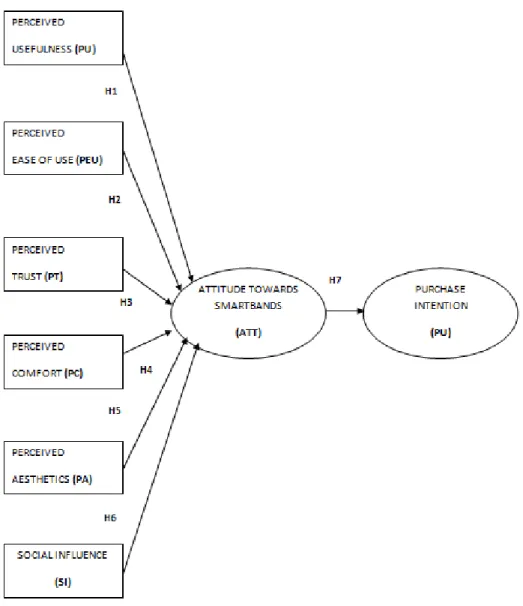
The Research model
- Research hypotheses
- Primary data
- Sampling method
- Sample
- Questionnaire design
In the first part of the questionnaire, the respondents were informed about the purpose of this study and we also gave assurances of the strict confidentiality of their responses to the questionnaire, which we will only use for the purpose of this study. The survey was conducted through a web-based questionnaire using Google Forms. The link to the survey was published on Facebook, LinkedIn, Twitter and Google Plus, which are some of the most popular social media platforms in Greece, and was also sent via personal emails to targeted people. The questionnaire was divided into four sections and consisted of a total of 37 questions, most of which were either multiple choice questions or five-point Likert scales ranging from 1 (strongly disagree) to 5 (strongly agree). The four main sections of the questionnaire were: a) personal information, b) experience with using Smartbands c) opinion about using Smartbands and d) purchase intention.
Participants were only forwarded to this section if they answered the last question of the first section positively about their experiences with using Smartbands.
Pretest
Data editing and coding
Data analysis
Limitations to research
Also, it is a small percentage of 4.7% of respondents who have experience using Smartbands but have abandoned them. Figures 4.30-4.32 below depict the statistical results of the responses regarding the perceived aesthetic attributes of using Smartbands. Finally, Figure 4.32 presents the statistical analysis of the overall impression of the respondents on the style and appearance of smart bands.
According to the results of this analysis, three of the examined factors, perceived usefulness, perceived ease of use, and perceived comfort were proven to positively influence the consumer's attitude towards purchasing a Smartband.
Research Results
Demographic Characteristics
- Gender
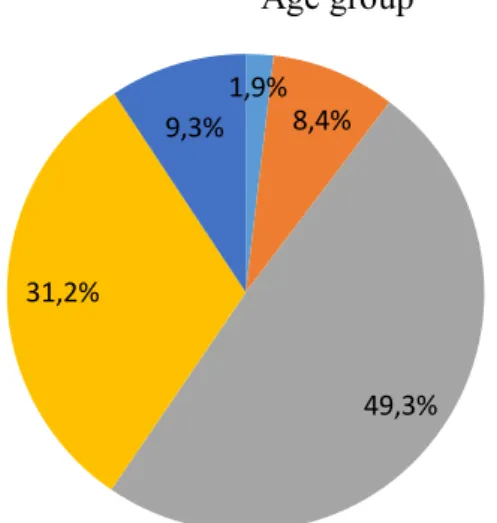
- Age
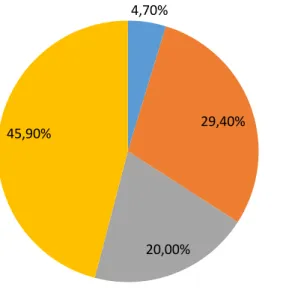
- Level of education
- Annual income
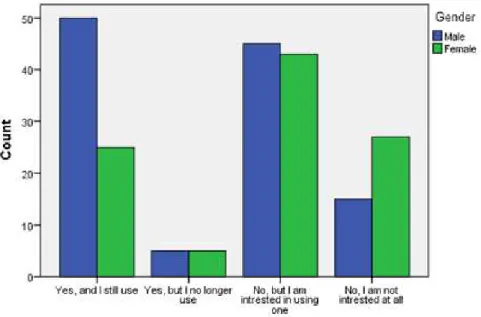
- Use of Smartbands
The level of education of the participants in the sample ranges from high school to a doctorate, with the majority of respondents having bachelor's degrees (37.7%) and master's degrees (49.3%). Consequently, it is evident that our research sample is considered highly educated. The last question of the first section is whether the participant has ever used a smart belt, which is a critical question for the next part of the survey. In case of a completely negative answer (not interested at all), the participant was redirected to the last part of the survey, the purchase intention section, to show their main hesitation.
On the other hand, most of the participants answered that they either still use it (34.9%) or they have not used it but are interested in using one (40.9%).
Analysis of answers regarding the respondents experience of using Smartbands
Regarding the type of applications that are used more frequently (Figure.4.8), scoring comes first which accounts for 81.2%, heart rate recording comes second with 67.1% followed by call/text notifications with 55.3% and sleep monitoring with the percentage of 36.5 %. The last question of this section aimed to determine the level of satisfaction from the overall use of Smartbands. A five-point Likert scale was used to indicate the level of satisfaction with a range from 1 (not at all satisfied) to 5 (very satisfied).
As can be seen in Figure 4.10, the level of satisfaction is very high (44% of users declare that they are very satisfied and 40.5% of users declare satisfied).
Chi-square (X2) Analysis
- Chi-Square Test in Experience of using Smartbands & Gender
- Chi-Square Test in Experience of using Smartbands & Age group
- Chi-Square Test in Experience of using Smartbands & level of education
- Chi-Square Test in Experience of using Smartbands & annual income
Next, we will investigate whether there is any relationship between age group and experience of using Smartbands. The results are also presented in Figure 4.13 below which depicts the cross-tabulation between the two variables. Similarly, we examine the relationship between the respondent's experience of using Smartbands with their level of education.
0.068>0.05, so we conclude that no relationship was found between annual income and experience with the use of Smartbands.
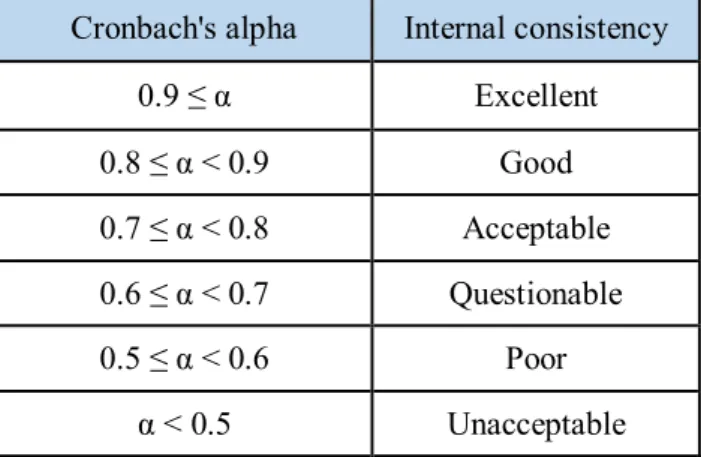
Reliability Analysis
The perceived ease of use section of the questionnaire included three items with a measured Cronbach's alpha of 0.884 (Table 4.8), indicating very good internal consistency and high reliability. So there is no need to exclude any of the questions from this factor either. Each of the responses regarding perceived ease of use had a mean score of almost 4.00 on the five-point Likert scale and a standard deviation of almost 0.7 (Table 4.9). This indicates that respondents showed a high probability that Smartbands are easy to use. usage. This measure included three questions and the mean value of each of the three questions is close to the score of 3.00 on the five-point Likert scale and the standard deviation is close to 0.80 (Table 4.11).
This section of perceived aesthetic qualities achieved a mean close to 3.60 for each question and a standard deviation close to 0.7 indicating that respondents showed a relatively neutral opinion on whether Smartbands are aesthetically attractive (Table 4.15).
Analysis of answers regarding respondents ‘opinion about Smartbands
- Perceived Usefulness
- Perceived ease of use
- Perceived trust
- Perceived comfort
- Perceived aesthetic attributes
- Social influence
- Attitude towards Smartbands
- Behavioral purchase intention
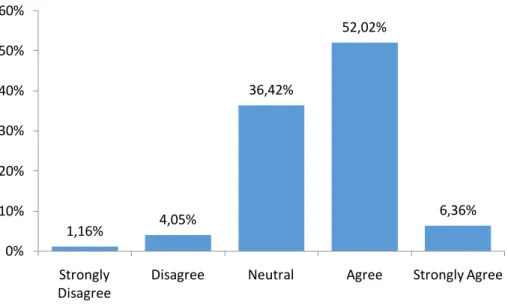
As shown in figure 4.19, a very high percentage of respondents (about 87%) responded positively to the question of whether they believe Smartbands offer useful features, 10.4% were neutral, while 1.73% disagreed and 0.58% did not fully agree. Finally, as can be seen in Figure 4.20, the majority of respondents (72.25%) agree or strongly agree (13.87%) that Smartbands are useful devices in general. Finally, 42.20% of the respondents stated that they disagree with the question of whether advertising has an impact on the use of Smartbands, 9.25% disagree completely and 36.42% remained neutral (Figure 4.35).
Finally, it is telling that only 10.6% hesitate to purchase a Smartband due to privacy concerns (Figure 4.41).
Multiple Regression Analysis
- Evaluation of Assumptions for Multiple Regression Analysis
- Regression models
First, we will check the correlation coefficients by using the Pearson correlation coefficient to calculate the relationship between each of the investigated variables. R square and adjusted R square indicate how much the model explains and measure the strength of the investigated association. Considering that the value of R square is 0.386 and adjusted R square is 0.364, almost similar, we can assume that this model explains about 38% of the variability of the response data.
As a result, we assume that for the variables used to predict the attitude, all the independent variables were significant except perceived trust (PT) and perceived aesthetic attributes (PA) and social influence (SI).

Hypothesis Testing
It is significant to mention that, the standardized beta coefficient of attitude has a high value of 0.703 which means that a positive attitude towards Smartbands would significantly influence the consumer's purchase intention. Hypothesis H2 predicted that the perceived ease of use factor would positively influence the attitude towards purchasing a Smartband. Hypothesis H4 predicted that the examined factor of perceived comfort would positively influence consumer attitudes towards purchasing a Smartband.
Finally, hypothesis H7 proposed that consumer's attitude towards the purchase of a smart band would have a positive effect on consumer's purchase intentions.
Conclusions
General discussion
The rest of the examined variables, which were perceived trust, perceived aesthetic attributes and social influence, were not found to be statistically significant. The findings of this study can be really useful for researchers and members of the wearable technology industry who seek to develop marketing and sales strategies for the promotion of these products in the Greek market. Also, this research validated the Technology Acceptance Model in explaining the adoption of new technology, as well as the importance of several other influencing factors in wearable technology such as functionality, style, comfort and social environment.
Research limitations and suggestion for future research
The formulation of the research model could have been enriched with several other variables that can also explore other influential factors such as perceived value, perceived compatibility, environmental considerations, etc. In general, a more detailed analysis with additional parameters will help to increase our understanding of consumer acceptance of portable devices. Toward a model of the in-store purchase decision process: Consumer use of criteria for evaluating women's apparel.
Internet of Things: Wearable Technology, Available at: http://ec.europa.eu/growth/industry/innovation/business-innovation- observatory/files /casestudies/44-iot-wearable-technology_en.pdf [Accessed 16 Dec.