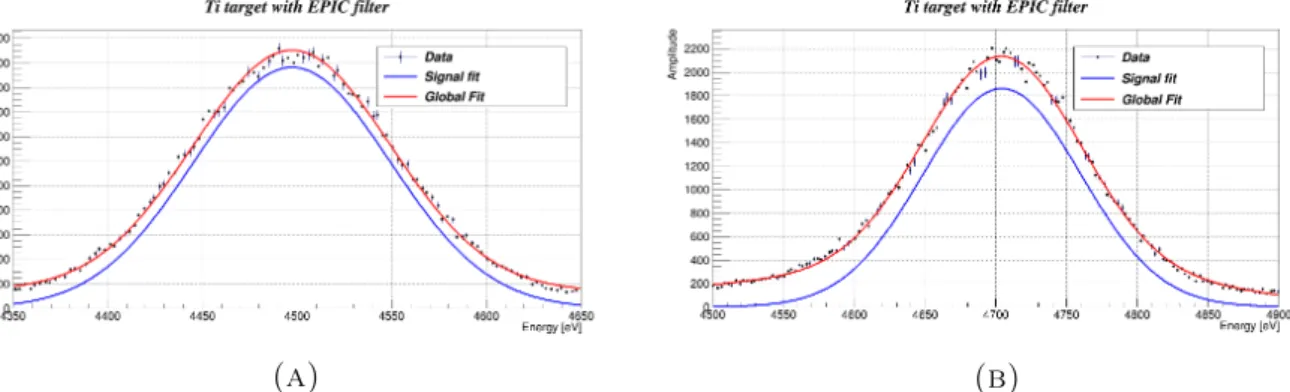
76 4.31 Fitting and background rejection of the spectrum obtained from Titanium .. measure with EPIC filter for Gaussian pulse shaping and for A) 0.5µs shaping time B) 6µs shaping time. 76 4.32 Fitting and background rejection of the spectrum obtained from Titanium .. target with EPIC filter for triangular pulse shaping and for A)0.5µs shaping time B)6µs shaping time.
Theoretical aspects of QCD
- The U (1) A problem
- Strong CP violation
- The Peccei-Quinn symmetry and the axion
- Axion properties
Ribbon is the term that represents further interactions of the action Laxion−gluon is the action field and its coupling with gluons. Qheavy is the electric charge of the new heavy quark with possible values Qheavy =−1/3,1,0 E/N is the ratio of the electromagnetic to color deviations with common values E/N = 0,2,6.
Solar axion detection techniques
When searching in the region of higher axion mass, the conversion length can be filled with interstitial gas.
![Figure 1.2: Differential solar axion flux at Earth [22]](https://thumb-eu.123doks.com/thumbv2/pdfplayerco/325774.50309/32.892.175.699.250.668/figure-differential-solar-axion-flux-at-earth-22.webp)
Introduction
Subsystems of the experiment
- The magnet
- The cryogenics
- The quench system
- The vacuum system
- The gas system
In the event of a resistance transition of the magnet and loss of superconductivity, an emergency helium discharge occurs. The gas installation consists of the storage volume, the cleaning system, two measuring volumes and the expansion volume.
CAST results
To trap the gas in the magnet, four cold windows made of 15 µm polypropylene, connected to a stainless steel strong backing, were installed at the end of the magnet bores. The gas is sent from the storage volume via the cleaning system to the measuring volume. One of the dosing volumes is used for a stepwise increase in the density of the gas and the other for precisely injecting larger amounts of 3He into the cold bores.
The system is controlled by a PLC, which sends the signal that the gas must be transferred or recovered.
![Figure 2.5: The exclusion regions in the m a − g αγ plane achieved by CAST in phase I and II [26]](https://thumb-eu.123doks.com/thumbv2/pdfplayerco/325774.50309/39.892.157.725.335.874/figure-exclusion-regions-αγ-plane-achieved-cast-phase.webp)
Introduction
The Slow Control of CAST
- Introduction
- Hardware
- Software presentation and Main Panel
- Signals, alarms and upgrades
The configuration of the channels in the first set of loops for this card is checked. If the Run Mode is selected, the channels are read from the charts. The boolean indicators of the cards are on when the signals have been properly acquired and the number of data from each card is displayed. Time of execution of each step of the main loop and the time difference between the steps. The time the file was created and the time the data was read and plotted are stored in this array.
The last column shows data from the digital channels of the PCI-6225 card.
![Figure 3.3: The delta sigma ADC and its delta sigma modulator used in the PCI-4351 NI cards [32]](https://thumb-eu.123doks.com/thumbv2/pdfplayerco/325774.50309/44.892.156.715.351.884/figure-delta-sigma-adc-delta-sigma-modulator-cards.webp)
Horizontal laser check upgrade
Introduction
Change in block box Includes information on pressure status, compressed air alarms and Maxigauges pressure suppression alarms. An alarm is sent when the pressure is exceeded. Compressed Air Warning A warning is sent when the compressed air decreases and exceeds a certain magnet temperature value. The first alarm is sent when the magnet temperature is above 1.9K and the second when it is above 1.95K.
Slow control is blocked If the SC does not work properly after 2 minutes an alarm is sent.
Software presentation
Analysis of data
Because of this, the movement of the magnet also affects the mean value of each reference point. As can be seen in Figure 3.25, in most cases when the magnet is moving at a frequency lower than 40 Hz, it has an average value higher than that calculated from the data without tracking. To compare data from 2014 and 2015, the mean values of each reference point were subtracted.
For magnet motion with a frequency lower than 40 Hz, the maximum observed difference is equal to 0.9872 encoder units or 0.4939 mm per 10 m.
Magnet Movement control system
Hardware
The selected mode of operation is V/F, which means that the ratio between the stator voltage and the frequency is constant for values lower than the field weakening range. The output of the circuit can be seen in Figure 3.31 and is an approximation of the DC voltage. The capacitor and inductor in Figure 3.30 are added to the output of the rectifier circuit to eliminate harmonics and smooth the DC output [35].
By modulating the on and off time of the power switches both the output frequency and the output voltage can be controlled so that the V/f ratio is constant (Figure 3.34).
The Solar tracking program
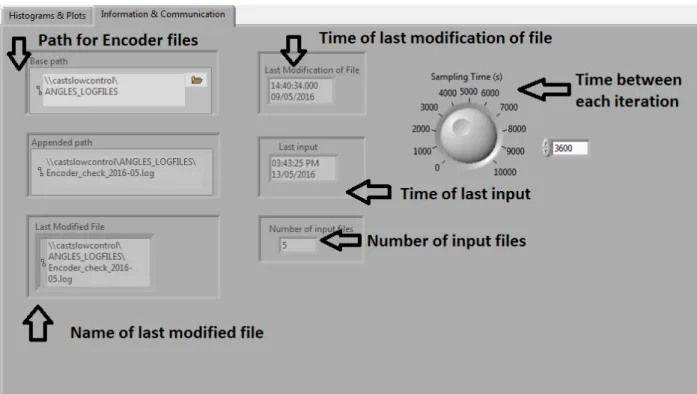
A new file is created for each day or if it is the first iteration of the program. The output of the executable is the azimuthal, zenith and galactic coordinates of the Sun in the next minute. The program determines whether the sun rises or not, whether it is in the safe movement band of the magnet and whether the sun is accessible.
The instantaneous accuracy of tracking is calculated and the values of the voltage and current of the motors are sent to the program.
![Figure 3.31: a) The highest and lowest voltages in the three-phase full-wave rectifier with diodes and b)the output voltage [35].The highest of the three phase voltages is connected to the load at any given instant while the lowest](https://thumb-eu.123doks.com/thumbv2/pdfplayerco/325774.50309/71.892.244.668.122.540/figure-highest-voltages-rectifier-voltage-highest-voltages-connected.webp)
Upgrade of the communication system
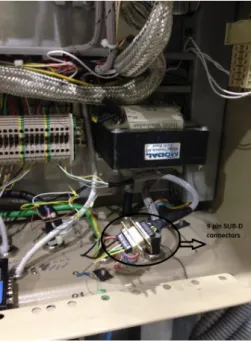
The program establishes communication with the horizontal inverter by sending a command and reading the response of the device with the horizontal encoder. We will compare it with the time when the vertical encoder was acquired, since they are sent to the program with a difference of a few seconds. The new system consists of a MOXA RS485 to Ethernet converter connected to a new D-SUB female connector, and a 12-meter Ethernet cable is used to transmit the signal to the computer (Figure 3.36).
After the installation of the new converter, a series of tests had to be carried out to ensure that the device is working correctly.
Introduction
X-ray spectroscopy
- Introduction
- X-ray fluorescence
- Interaction of photons with matter
- X-ray beam line
During Compton scattering, the beam of photons partially transfers energy in the material's electrons and is deflected from their initial trajectory. The inverse of the attenuation coefficient expresses the average distance the beam will travel inside the absorber unaffected. I0 is the incident beam intensity µ is the absorption coefficient x is the thickness of the absorber.
The operating principle of X-ray generation is based on the use of an X-ray tube with electrons as energetic particles.
Silicon Drift Detector
Properties of semiconductor materials
The holes remaining in the valence interact with the conduction band electrons and more electrons and holes are produced during the deexcitation process, leading to a higher required average energy to produce electrons and holes than the energy gap. The high density of the material (2.33 g/cm3) causes high energy losses and a short absorption length. Thus, high accuracy can be achieved when measuring the start of the track.
Both the electronics and the detector material are fabricated from silicon and can be integrated into a single device [40].
![Figure 4.7: The Fermi distribution function. [39].](https://thumb-eu.123doks.com/thumbv2/pdfplayerco/325774.50309/85.892.249.683.610.1066/figure-4-7-the-fermi-distribution-function-39.webp)
Characteristics of semiconductor detectors
However, high density does not affect the mobility of the carriers, and due to their high mobility, they can be quickly collected even in the case of high-rate events. Another unique feature of semiconductor detectors is the possibility of doping the used crystal and creating sophisticated field configurations without affecting carrier mobility. The average energy required for the formation of an electron-hole pair is equal to 3.66 eV.
With a sensitive region of a few millimeters and in combination with an electron velocity that is two to three times higher than that of holes, charge can be collected in the order of 10-7 s in semiconductor detectors.
Silicon Drift Detector (SDD)
It is a function of all the energy transfer processes that can take place and is characteristic of the medium. The Fano factor is usually F<1 and for F=1 the variance is the same as the variance of the Poisson distribution The resolution of the detector , its ability to distinguish between two closely lying energies is proportional to the full width at half maximum (FWHM):. As the electron created by the ionizing radiation floats towards the anode, there is a change in the voltage across the p+ gate of the n-channel transistor. The gate of the Silicon Drift Detector 65 achieves a certain potential difference with respect to the channel of the transistor it discharges by impact ionization in the transistor channel near the gate-drain junction at the end of the channel.
The detector used in the CAST experiment was a commercial SDD-100-130pnW-OM-ic from PNdetector, Munich, without vacuum window and with a large area of 89 mm2, covering 6.13% of a total diameter of 43 mm from the magnet cold bore [44].
![Figure 4.10: Sideward depletion [42].](https://thumb-eu.123doks.com/thumbv2/pdfplayerco/325774.50309/88.892.194.685.128.549/figure-4-10-sideward-depletion-42.webp)
Nuclear Instrumentation
In addition, a voltage meter is used for displaying the temperature of the detector. The rising edge of the preamp passes and the voltage decays exponentially back to baseline. Therefore, the inhibitor input of the amplifier was directly connected to the output of the gate of the preamplifier to avoid overload condition and spectral distortion.
The multi-channel analyzer stores each pulse in an appropriate channel depending on its amplitude. The output of the amplifier is digitized via an ADC and a digital signal is generated that is proportional to the amplitude of the input pulse.
![Figure 4.14: Vacuum and shielding system of Silicon Drift Detector [44].](https://thumb-eu.123doks.com/thumbv2/pdfplayerco/325774.50309/91.892.128.759.233.567/figure-14-vacuum-shielding-silicon-drift-detector-44.webp)
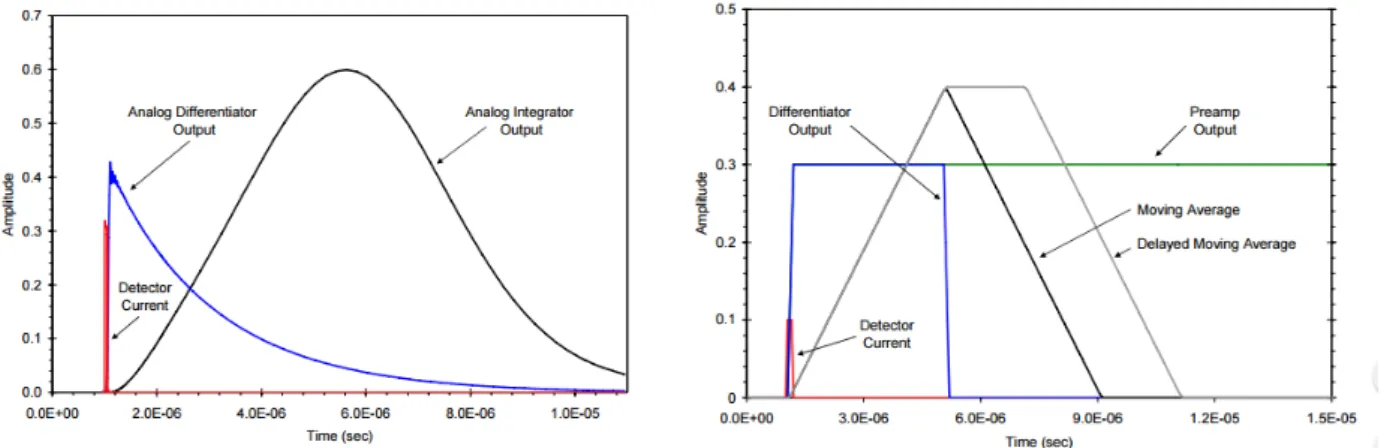
Signal acquisition using a Digital Pulse Processor (DPP)
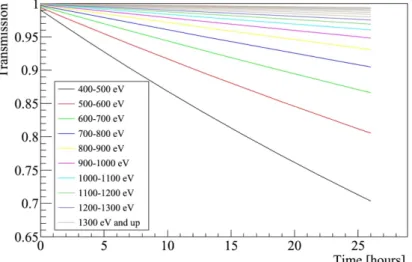
The shaped pulse and the output pulse from the differentiator in a) an analog pulse shaper on the left and b) in a Digital Pulse Processor i. The transmission drop due to the increasing deposition of hydrocarbon film on the surface of the detector can be seen for each energy container in Figure 4.25. This loss of efficiency was associated with outgassing of electronic components in the system.
A solution to the outgassing of the electronic components was to remove the preamplifier plate from the vacuum of the detector.
Upgrade of signal acquisiton using a Spectroscopy Amplifier
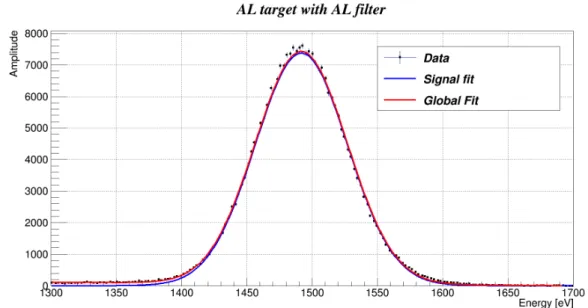
As can be seen from both figure 4.26 and figure 4.27, no noticeable decrease in count rate is observed with time after the preamplifier is removed from the vacuum system of the detector. The increasing decrease of the count rate with time indicates. A C3H6 film deposit on its surface. No increasing drop in counting rate is observed. which was used to calculate the FWHM of the gaussian.
The same analysis was performed for all four targets and the FWHM as a function of the selected shaping time can be seen in Figure 4.33.
Comparison of signal acquisition systems
The spectrum and fittings can be seen respectively in 4.38 for aluminium, 4.39 for copper and 4.36 for aluminium, 4.37 for copper for the amplifier and the PX5.
Conslusions
The noise rates show an increased noise level by a factor of three in the case of the PX5, however, this does not seem to affect the shape of characteristic peaks of the targets. During the background measurements of the detector with the high voltage on in the laboratory, it was noted that bursts of noise from the environment were detected. These bursts of noise were not present when the detector was used in the experiment due to the additional shielding.
The results of the spectroscopy amplifier are similar to those acquired when the SDD was tested in the laboratory in 2013.
Microwave cavities for axion detection
Introduction
Haloscope operating principle
By using a dielectric tuning mechanism, the frequency of the fundamental mode can be changed to correspond to other values of axion masses. Qc loaded quality factor, which is the power loss from the cavity walls. Qd unloaded quality factor, which is the power loss from the dielectric material and has a dominant effect on Q [51].
Ts is the total system noise temperature which is equal to the cavity temperature and the amplifier noise.
Rectangular cavities in the CAST dipole magnet
This technique does not compromise the mobility of the carriers as it causes an increase in the concentration of free carriers without added dopant impurities [53]. The amplified signal is sent via the hermetically sealed passages of the vacuum vessel to ambient temperature for further amplification. Photoproduction of neutral mesons in nuclear electric fields and the average lifetime of the neutral meson”.
Søg efter Solar Axions ved CERN Axion Solar Telescope with 3He Buffer Gas:Closing the Hot Dark Matter Gap”.