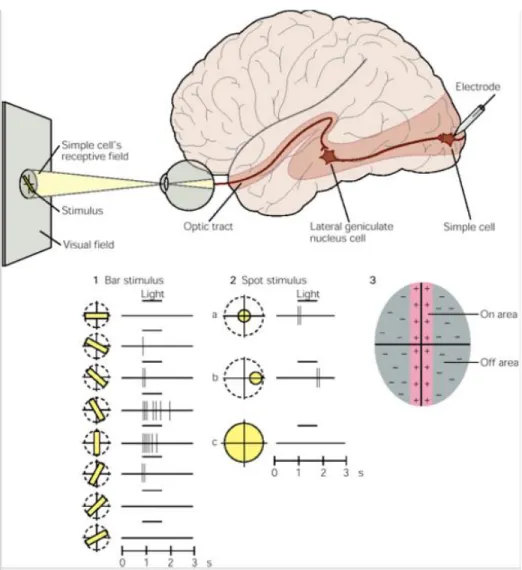
In 1962, David Hubel and Torsten Wiesel introduced their theory of the architecture of the visual 119. Presentation of bar (1) or spot (2) light stimuli generates a response in V1 simple cells corresponding to the orientation or receptive field position of the stimulus, a phenomenon known as orientation selectivity in the first case. These receptive fields are subdivided into on-regions and off-regions (3) that produce excitation or inhibition in the neuron, respectively, when excited by light.
Consequently, the receptive field of the simple cell is a summation of the receptive fields 155.
Current view of V1 204
Research Goals 251
Methods 271
Model Description 272
Hodgkin/Huxley Voltage Gated K+ Channels Muscarinic Voltage Gated K+ Channels A-Type Voltage Gated K+ Channels T-Type Ca++ Channels. Description of passive, active and synaptic mechanisms present in the model neuron. mS/cm2) Soma Apical Basal. Thus, the model can be used in either of two configurations of synaptic distribution - even 321 .
Model Manipulations 326
18 (3) Synaptic silencing: It is used to selectively cancel the conductance of the synaptic mechanism 335. gAMPA/gNMDA/gGABAA) in a specific region.
Recording Information 340
Simulation Protocols 345
19 synapses increase in number from iteration to iteration, from 1 to 100 in steps of 1. nonlinear behavior induced separately by sodium and NMDA spikes. blocked sodium channels on the selected dendrite during the protocol, allowing only AMPA and 358. Using the resulting data, we can derive 368. the maximum and minimum firing rates of the model cell, and compare them to those obtained 369. from live cell recordings. By adjusting the input resistance of the neuron, as well as the 370. frequency of synaptic activation, we limit the minimum and maximum firing rates to 371.
On the other hand, responses below the diagonal represent apical dominance, because the neuron tends to favor orientations closer to 0° regardless of basal orientation. At this point, sodium is blocked on the apical or basal dendrites in two 394. Time point td represents the occurrence of the early dendritic spike prior to the somatic spike, but limited to within 3 ms after the occurrence of the somatic spike.

Causal Classification 409
In our case, to completely exclude ambiguous data (i.e. somatic spikes that were temporally preceded by a mix of apical and basal dendritic spikes), we chose to exclude all 431. 24 To ensure the selection of the best model possible, we used a 10-times repeated, stratified,444. 25 RS-NCV was preferred over the Tibshirani and Tibshirani method (TT) (Tibshirani & Tibshirani due to its tendency to underestimate the true performance of the model, giving it a 467 value). .
Data Acquisition and Analysis 472
We detected the bend points by taking the points where the second voltage lead is 487. Since our voltage measurements are not continuous, it is unlikely that we will encounter a measurement point 488. for which the second lead is zero. Thus, assume a winding of 489. points in the second lead of the voltage trace, immediately before and before 491.
Model Validation 509
To ensure the highest possible degree of biophysical accuracy, we must ensure that our 522 . We detect both sodium and NMDA spikes are present in our model (Figure), but the number of synapses required to elicit such events on each dendrite varies. Sodium and NMDA Sample spikes as exposed by the model neuron, recorded from apical dendrite 35 (A35) 530. top), compared to experimental recordings (bottom) reproduced from Stuart & Spruston, 2015.
29 required to elicit a spike event of the corresponding type - either a sodium spike or an NMDA 535. To compare the output of each dendrite with the synaptic input received, we used the 541 . Number of synapses required for sodium (blue) and NMDA (green) spikes for basal (A) and apical (B) 550.
Asterisks indicate a dendrite that did not show this type of nonlinearity up to 100 concurrent 551. To do this, we used the nonlinearity relative to linear extrapolation (NRLE) metric (see 562 . “Methods”). We used the total area under the voltage trace as the output signal, we measured both 563.
The duration of the NMDA-evoked EPSP at half maximum amplitude allows visualization of the nonlinear behavior of NMDA. Each trace represents the behavior of an individual apical (top) or basal (bottom) dendritic branch.

Dendritic Contribution to Orientation Selectivity 571
Random spiking (bilateral input coincidence) of the apical and basal dendrites appears to produce somatic spiking. Basal dendrites still exhibit spiking activity, but both apical and somatic spiking are completely extinct. 34 Furthermore, if the apical tree sodium channels are blocked, the basal tree is completely unable 585.

Orientation Tuning Dominance 591
Causal Interventions 606
Classification of all somatic spikes, and sample surveys demonstrating causal intervention results, for both the even and biased models. Rightmost set of recordings represents an example of an apically driven spike: First, the blue trace is recorded. Finally, if basal sodium conductance is abolished, the amplitude of the spike changes, but not its timing.
Example of the set of traces sorted by a low-confidence peak (left) and the sorted set of traces after the causal intervention that allows us to assign a high-confidence label regardless. However, our trivial classifier that always 632. labels each sample as apically driven has superior accuracy. The reason why trivial classification 633. has such high accuracy is simply because apically directed points are overrepresented, leading 634. to an accuracy that is equal to the fraction of apically directed points in the data set. is a misleading metric in this case.
In cases where all outcomes have equal prior probabilities 636. equal amounts of each in the samples), accuracy is more reliable.

Discussion 645
Results indicated that apical tree dendritic spikes cause somatic spiking in the vast majority of 661. An inverted triangle can be observed in the negative space between the partial circles and chevron-shaped lines.

Acknowledgments 759
Supplementary Information 888