Modern approaches in the biology and ecology of reproduction and growth of anchovy (Engraulis . encrasicolus) in the North Aegean Sea. More specifically, I studied spawning production at the individual level (by studying the dynamics of vitellogenesis in the ovaries), spawning production at the population level and its variability in the field, and oceanographic characteristics of spawning habitats. Additionally, we analyzed the otolith microstructure, growth and somatic condition of late larvae and juveniles collected at different times of the year, and determined the causes of their seasonal variability.
To characterize the potential spawning habitats of anchovy and round sardine (Sardinella aurita) in S. The simulations of the coupled oceanographic model were aimed at reconstructing the potential oceanographic conditions experienced by the fish during the entire period of their development. Regarding egg production at the individual level, the results showed that the recruitment of vitellogenic oocytes in anchovy occurs in very short pulses triggered by the hydration of the spawning batch.
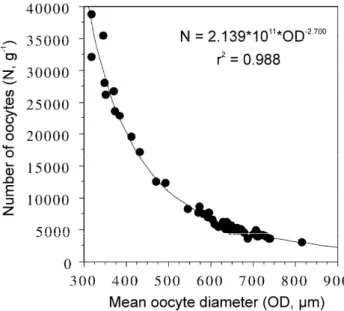
Οι προβλεπόμενες από το μοντέλο πιθανές περιοχές ωοτοκίας γαύρου και στρογγυλής σαρδέλας στις μη δειγματοληπτικές περιοχές της Ελληνικής Θάλασσας και ολόκληρης της Μεσογείου και της Μαύρης Θάλασσας ήταν σε καλή συμφωνία με τις υπάρχουσες πληροφορίες σχετικά με την κατανομή και την έκταση των τόπων ωοτοκίας, ιδιαίτερα του γαύρου. Τέτοιες τυπικές καμπύλες και σχέσεις με υψηλό συντελεστή προσδιορισμού (r2) υπολογίστηκαν για τον μπακαλιάρο (Gadus morhua), τη γλώσσα (Pleuronectes platessa) και τη ρέγγα (Clupea harengus) (Thorsen & Kjesbu 2001, Kennedy et al. 2007, Witthames et al. ... 2009), είδη με σταθερή γονιμότητα στα οποία υπάρχει σαφές χάσμα (διάλειμμα) στο μέγεθος μεταξύ των πρωτογενών ωοκυττάρων και εκείνων που αναπτύσσονται για να απελευθερωθούν την ερχόμενη αναπαραγωγική περίοδο.
Εισαγωγή
Υλικά και Μέθοδοι
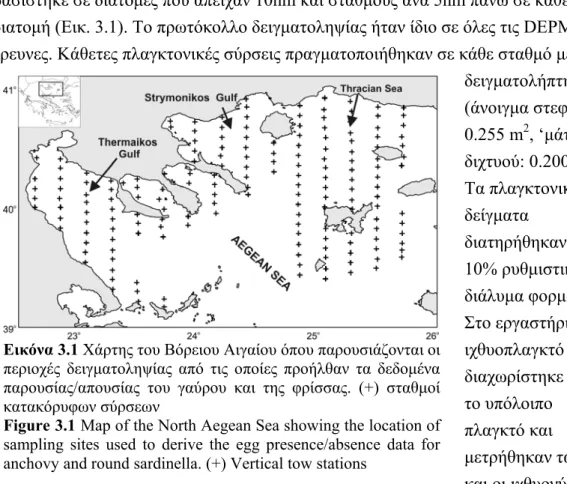
- Συλλογή και επεξεργασία δειγμάτων
- Μετρήσεις ωοκυττάρων σε δείγματα ιστού
- Στερεολογική ανάλυση
- Υπολογισμός του πλήθους των ωοκυττάρων στη γονάδα
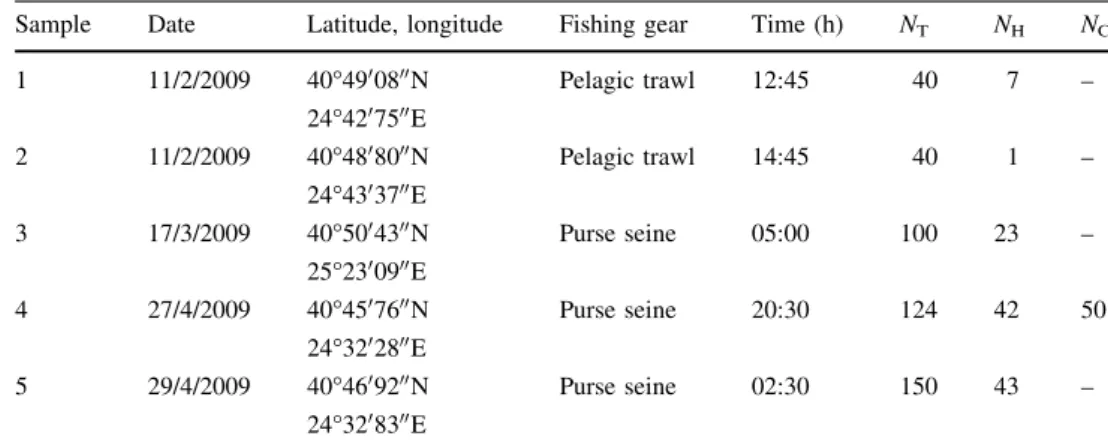
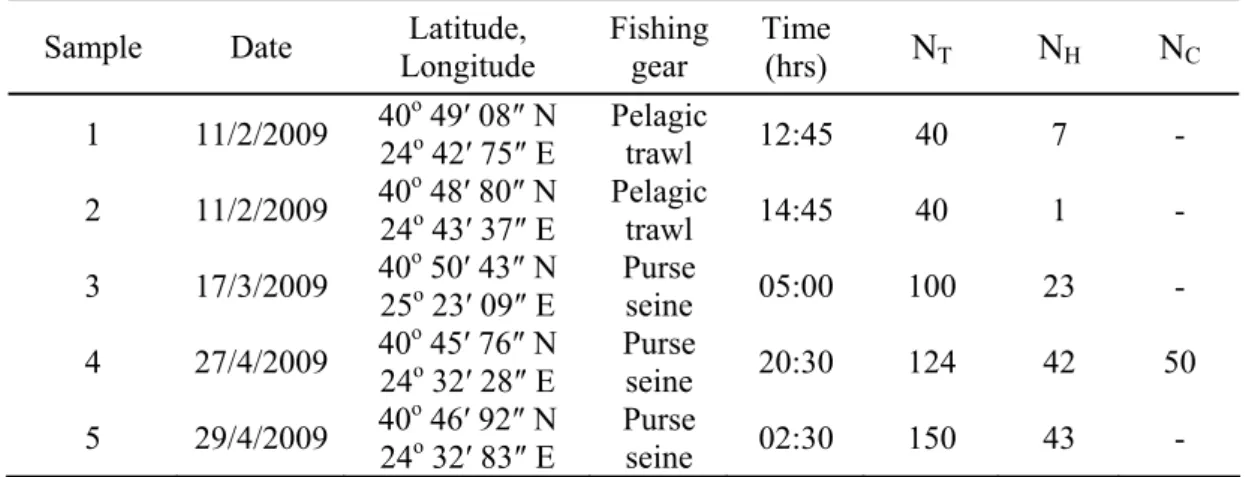
NT: Total number of fish sampled, NH: number of fish used in histological analysis, NC: number of fish used to calculate a fresh weight correction factor for formalin-preserved ovary weight. Ovary numbers used in whole oocyte measurements for estimation of frequency distribution of oocyte size. Ovarian stage Ovarian stage (GONAD) Oocyte stage (OOCYTE) WM OPD (OPDN) PG, primary growth oocytes ellipsoid with.
Spawning ability (spawned on night of sampling) 2 2. POF Day 1, POF1 VTO, vitellogenic oocytes with yolk granules throughout the cytoplasm.
Αποτελέσματα
- Εξισώσεις διόρθωσης και πυκνότητα γονάδας
- Μέγεθος ωοκυττάρων
- Κλάσμα όγκου
- Πλήθος ωοκυττάρων ανά στάδιο i
Συζήτηση
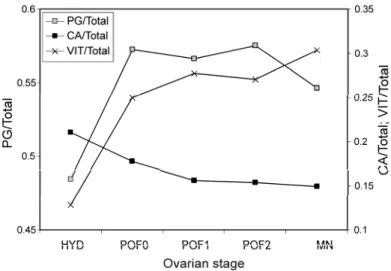
Αυτό μπορεί να αποδοθεί στην περιορισμένη περίοδο δειγματοληψίας αυτής της εργασίας (πριν και στην αρχή της αναπαραγωγικής περιόδου, παρά σε όλη τη διάρκειά της), η οποία πιθανώς μείωσε τη διακύμανση της OPD λόγω εποχιακών αλλαγών στο μέγεθος των αυγών και τη γονιμότητα της ομάδας ( Hunter & Leong 1981, Alheit 1989, Clarke 1989, Luo & Musick 1991, Motos 1996, Funamoto & Aoki 2002, Castro et al. 2009).
- Εισαγωγή
- Υλικά και Μέθοδοι
- Εφαρμογή της DEPM στο Β. Αιγαίο
- Συλλογή και επεξεργασία δειγμάτων
- Εκτίμηση των παραμέτρων ενήλικων ατόμων γαύρου
- Μελέτη της διακύμανσης των παραμέτρων
- Αποτελέσματα
- Συζήτηση
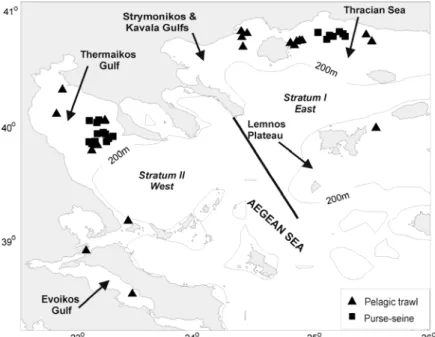
Information from adult surveys and estimates of adult parameters and spawning stock biomass in Stratum I (East) and Stratum II (West).
- Εισαγωγή
- Υλικά και Μέθοδοι
- Συλλογή και επεξεργασία δειγμάτων
- Δορυφορικά περιβαλλοντικά δεδομένα
- Κατασκευή και αξιολόγηση των μοντέλων
- Αποτελέσματα
- Συζήτηση
Η μαύρη παχιά γραμμή υποδεικνύει την τιμή της απόκρισης εξομάλυνσης του GAM και οι διακεκομμένες γραμμές αντιπροσωπεύουν τα διαστήματα εμπιστοσύνης 95%. Η μαύρη γραμμή δείχνει το εφέ και οι διακεκομμένες γραμμές τα διαστήματα εμπιστοσύνης 95%. Σχήμα 3.5 Διαγράμματα της απόκρισης εξομάλυνσης του Γενικευμένου Προσθετικού Μοντέλου για ωοτοκία στρογγυλής σαρδέλας έναντι (α) SLA και (β) της αλληλεπίδρασης DEP και CHL. Η μαύρη παχιά γραμμή υποδεικνύει την τιμή της ομαλής απόκρισης του GAM και οι διακεκομμένες γραμμές αντιπροσωπεύουν το 95%.
Τα γκρι και τα μαύρα χρώματα απεικονίζουν την πιθανότητα ωοτοκίας >25% και >50% αντίστοιχα. Εικόνα 3.7 Χάρτης περιοχών που αντιπροσωπεύουν ενδιαίτημα ωοτοκίας στρογγυλής σαρδέλας στα ελληνικά ύδατα, με βάση το μοντέλο GAM του Βορείου Αιγαίου Γκρι χρώμα: >25%; μαύρο χρώμα: >50% πιθανότητα ωοτοκίας. Χάρτης περιοχών που αντιπροσωπεύουν ενδιαίτημα ωοτοκίας γαύρου, με βάση το μοντέλο GAM του Βορείου Αιγαίου Γκρι χρώμα: >25%; μαύρο χρώμα: >50% πιθανότητα ωοτοκίας. Χάρτης περιοχών που αντιπροσωπεύουν δυνητικό βιότοπο ωοτοκίας στρογγυλής σαρδέλας με βάση το μοντέλο GAM του Βορείου Αιγαίου Γκρι χρώμα: >25%;.
Εισαγωγή
Υλικά και Μέθοδοι
- Συλλογή δειγμάτων
- Επεξεργασία και ανάλυση ωτολίθων
- Ηλικία και αύξηση
- Προσομοίωση του υδροδυναμικού-βιογεωχημικού μοντέλου
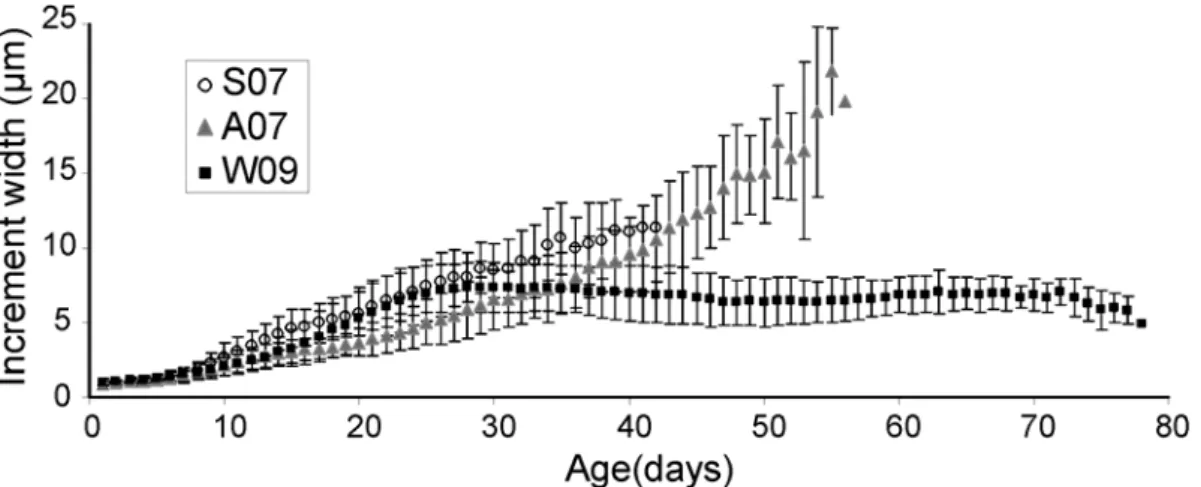
- Ανάλυση του πλάτους των ημερήσιων αυξητικών δακτυλίων
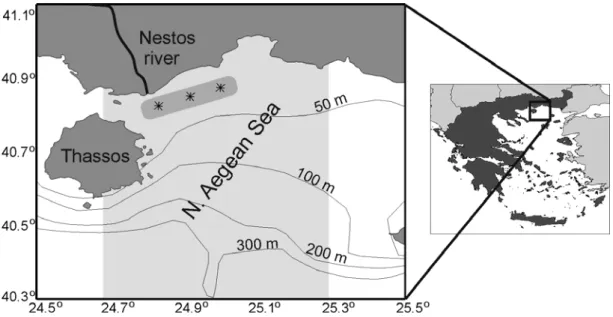
The shaded rectangle marks the area over which POM-ERSEM results applied to the North Aegean Sea are averaged.
Αποτελέσματα
- Μικροδομή ωτολίθων
- Ηλικία και αύξηση
- Ωκεανογραφικές συνθήκες
- Γενικευμένα προσθετικά μοντέλα πλάτους ημερήσιων δακτυλίων
Η καλύτερη αναλογία είναι το μοντέλο με καλύτερη απόδοση, όσον αφορά την απλότητα, την εξήγηση της διακύμανσης (r2) και τις υπολειμματικές ιδιότητες (κανονικά κατανεμημένες, ομοσκεδαστικές). Δίνονται οι διάμεσοι και η συνάρτηση στατιστικού ελέγχου Kruskal-Wallis (H) (***p<0,001) καθώς και τα αποτελέσματα της δοκιμής Dunn a>b>c Πίνακας 4.3 Σύγκριση των μέσων προσομοιωμένων παραμέτρων POM-ERSEM στο ευρύτερο περιοχή δειγματοληψίας κατά την περίοδο πριν από τη δειγματοληψία ίση με τη μέγιστη ηλικία κάθε ομάδας προνυμφών (L) και νεαρών νεαρών ζώων (J) στις τρεις εποχές (S07, A07 και W09). Οι συμπαγείς γραμμές αντιπροσωπεύουν την εκτιμώμενη ομαλή συνάρτηση και οι διακεκομμένες κόκκινες και πράσινες γραμμές τα τυπικά όρια σφάλματος -1 και +1.
The number in the title is the actual degree of freedom of the interaction term. Carpet plots along the x-axis show the covariate values for each smoothness, and the number in each y-axis heading is the actual degree of freedom of each term. The solid lines represent the estimated smooth function, and the dashed red and green lines represent the -1 and +1 standard error bounds.
Συζήτηση
"Ocean triads" in the Mediterranean Sea: physical mechanisms potentially structuring reproductive habitat sustainability (with example application to European anchovies, Engraulis encrasicolus). Spawning and spawning areas of pelagic fish (Sardina plichardus, Engraulis encrasicolus, Scomber scombrus, Sardinella aurita and Sprattus sprattus sprattus) in the Adriatic Sea. Modeling potential spawning habitat of sardine (Sardina pilchardus) and anchovy (Engraulis encrasicolus) in the Bay of Biscay.
Ocean warming and fish distribution: the case of the small pelagic fish Sardinella aurita, in the western Mediterranean. In northern anchovies, bay anchovies (Anchoa mitchilli) and Japanese anchovies (Engraulis japonicus), a gap in oocyte size is only observed during the hydration phase (Hunter and Leong, 1981; Luo and Musick, 1991; Imai and Tanaka, 1994 ). , while in the Mediterranean sardine, at the tertiary yolk globule stage (Ganias et al. 2004). Ocean triads'' in the Mediterranean Sea: physical mechanisms potentially structuring the sustainability of reproductive habitats (with example application to European anchovy, Engraulis encrasicolus).
The effect of environmental conditions on the distribution of eggs and larvae of anchovy (Engraulis EncrasicolusL.) in the Black Sea. Marked interannual differences in reproductive parameters and daily egg production of anchovies in the northern Aegean Sea. Morphometric structuring of anchovies (Engraulis encrasicolus L.) in the Black, Aegean and northeastern Mediterranean.
A major factor involved in larval survival and subsequent recruitment is growth rate. Ocean triangles in the Mediterranean: physical mechanisms potentially structuring the suitability of reproductive habitat (with example application to European anchovy, Engraulis encrasicolus). Growth of young-of-the-year European anchovy (Engraulis encrasicolus L.) in the Bay of Biscay.
Seasonal variation in sea surface oceanographic conditions in the Aegean Sea (Eastern Mediterranean): a review.