3Figure 1 illustrates the dynamics in the level of regulatory burden (right) and in the proportion of companies that. All the evidence taken together allows us to assess the competing theories about the nature of regulation. 4Prior to these changes, the first editing of the deregulation law on registration reduced the number.
The data from the second round allows evaluation of the reform progress after the entry into force of the law on inspections;. The last fifth round allows evaluation of the impact of the second edition of the registration law.9. 9 Importantly, the timing of the laws on certification and on simplified tax system is like this.
10These dummies select only the extreme violations of the deregulation goal because the law limits.
Local accountability
The deregulation reform provides us with a good opportunity to do so, as it allows us to observe the effect of predetermined, i.e., pre-reform, institutional features on the local enforcement of exogenously given changes in federal regulations. This is an important advantage over many previous studies because variation in levels of regulation and in institutional characteristics can be simultaneously driven by variation in unobserved factors.
Fiscal incentives
Industrial lobby
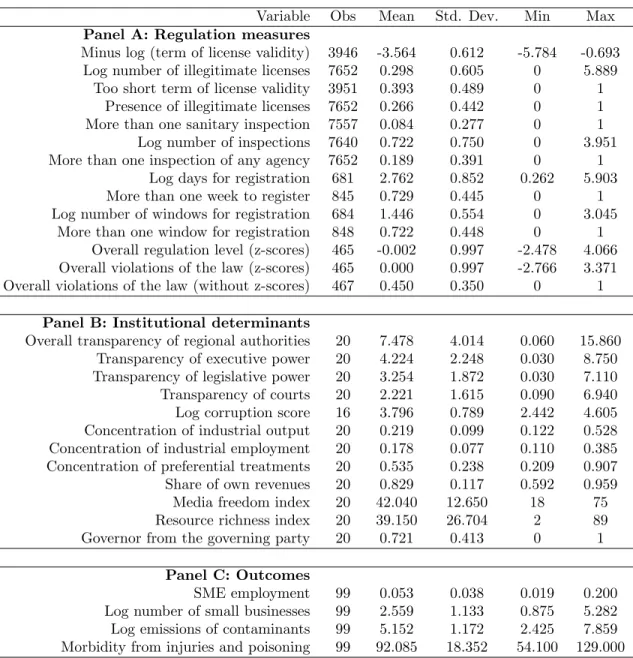
All institutional measures are described in the data appendix and summarized in Panel B of Table A.1. First, we focus on the overall reform progress across all areas of regulation and estimate how it is affected by the institutional characteristics. Second, since institutions may affect the enforcement of reforms differently in different regulatory areas (as regulatory capture theory predicts), we study the effect of institutional measures on deregulation progress separately in each specific area of regulation.
The implementation of deregulation overall
Second, since institutions may affect the enforcement of reforms differently in different regulatory areas (as regulatory capture theory predicts), we study the effect of institutional measures on deregulation progress separately in each specific area of regulation. the overall level of regulation and a proxy for the overall level of breach of targets set in deregulation laws in the respective regulatory areas. The last operation yields two variables: 1) z-scores that measure the level of regulation for different types of regulations and 2) z-scores that measure the rate of violations of targets set in deregulation laws. In the latter case, the level of regulation will measure the distance to targets set in the deregulation laws.
14To interpret the coefficient γ as the full effect of reforms on the average institutional level. An important control variable is the interaction between the initial level of regulatory burden (Virt0) and the dummy 'after reform' (AF T ERit). The coefficient for this interaction measures the extent to which progress on deregulation reforms depends on the initial level of regulation.
If the reform had worked perfectly to harmonize (and lower) the level of regulation across firms, the deregulation progress would have been a linear transformation of the initial level of regulation. The effect institutional characteristics is statistically weaker for the overall level of regulatory burden to the extent that the effects of. transparency, corruption and resource abundance at the level of regulation are statistically insignificant, but the sign of the effect is always consistent with that for the level of violation of deregulation targets. Now consider two regions that differ only in the level of corruption; then there would be a difference of 0.16 SD in the magnitude of a decrease in the level of violation of deregulation targets due to reform in these regions.
Fiscal incentives significantly improve the implementation of reforms: there is a 0.2 SD difference in the magnitude of a decrease in both the level of regulation and the level of violation of deregulation targets due to deregulation reform. The effect of institutional characteristics is estimated by holding all other variables, including the initial level of regulation, constant. The coefficients on the interaction of the initial level of regulatory burden and "after reform" dummy are statistically significant and equal to approximately 0.5 for the level of regulation and 0.8 for the rate of violation of deregulation targets.
The determinants of progress in specific regulatory areas
The reform therefore partially equalized the level of regulatory burden by region, namely a one SD higher initial level of regulation and a 10 percentage point higher level of violation of an individual goal of deregulation results in a 0.5 SD higher reduction in the level of regulation. and an 8 percentage point greater reduction in the rate of violations of deregulation laws after the reform. Rf t means one of the specific measures of regulatory burden in the areas of licensing and inspection for which we have firm-level data. In the panel at the regional level, the data allow us to measure the regulatory burden associated with all three areas of regulation: licensing, inspections and registration.
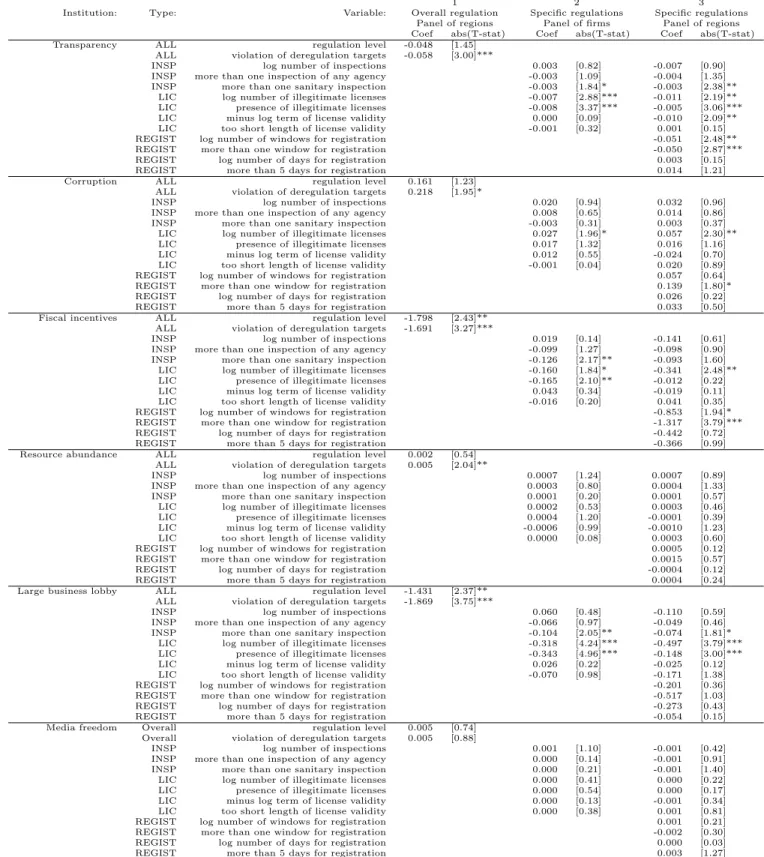
The main assumption necessary for the validity of this DD methodology is that, in the absence of institutional variation, the average change in regulatory burden as a result of reform would be the same across regions for a given level of X and Z. In particular, there is no difference in the direction of effect for entry regulations and regulations of the existing companies of our intermediaries for the presence of politically powerful industrial lobbies: industrial concentration significantly reduces the probability that a company has more than one sanitary in-spection in half a year after the deregulation reform, an illegitimate permit and a visit to more than one registration agency. As for corruption, it has a significant negative effect on the course of reforms in licensing and registration and a negative but statistically insignificant effect on deregulation in the inspection area.
A one SD increase in the HH index of industrial employment leads to a 2.5% lower number of illegitimate licenses per Corporation. An increase in the transparency of authorities by one SD leads to the following improvement in the progress of deregulation reform for an average company: a 3% greater decrease in the number of illegitimate licenses, a 4% greater extension of the length of license validity, a 22% greater decrease in the number of agencies visited for registration, and a percentage point greater decrease in the probability of having more than one inspection by any regulatory agency in a six-month period. A one SD increase in the share of own revenue leads to a 1% greater decrease in the number of illegitimate licenses per capita. the number of agencies visited for registration.17.
In the previous part of the paper, we showed that the abundance of resources slowed down the reform on average. Nevertheless, this variable has been used by many other articles showing that it is a relatively good proxy for the actual state of press freedom in Russian regions since 2000 (e.g. Akhmedov and Zhuravskaya, 2004; Gehlbach, Sonin and Zhuravskaya). , 2006). Our analysis, presented in Section 3 of the paper, helps identify sources of exogenous variation in regulatory burden.
Results: the effect of deregulation on outcomes
To illustrate the direction and magnitude of bias in uninstrumented regressions, in addition to the results of the second stage of the 2SLS specification (Equation 4), for each regulatory measure we present results of the simple OLS regressions. The instruments used for each of the regulatory measures to estimate the impact of regulation on entry and firm growth differ only in the timing of the "post-reform" dummy (which multiplies the same institutional determinants of deregulation success) and therefore, are correlated. In addition, we report F statistics for excluded instruments; they indicate that the explanatory power of the instruments in reported regressions is sufficiently high not to run into a problem of weak instruments.
Let us now turn to the estimation of the causal effect of regulation on pollution and morbidity. It is contrary to the predictions of public interest theory that regulations correct such market failures as pollution externalities or the supply of toxic goods by negligent fly-by-night businesses. The direction and magnitude of the effects do not change after the inclusion of these controls; some of the results lose significance, but many remain statistically significant.
Second, our results do not depend on the inclusion of the regional control variables, i.e. population and income. Third, the results are robust to using the alternative assumption about the timing of the inspection and licensing laws relative to the surveillance rounds. In reality, deregulatory oversight and permitting laws took place in the middle of the MABS rounds.
Finally, we repeat the analysis for an additional measure of regulatory burden – the average cost of obtaining one license. Four institutional factors had a strong, statistically significant, and economically strong effect on the implementation of deregulation reform in Russian regions: government transparency, low corruption, tax incentives (i.e., the extent to which regional budgets consist of own revenues rather than own revenues). transfers from the federal center) and the presence of a strong industrial lobby. These factors are related to the better progress of reforms both in the area of entry regulations and regulations of already operating companies.
This evidence contradicts the public interest theory of nature regulations: first, regions with transparent and accountable governments are those that achieve progress in deregulation, and second, deregulation does not have a detrimental effect on pollution or morbidity. As our measure of corruption, we take the log of the “corruption volume” variable available at www.anti-corr.ru/rating regions/index.htm.