It offered excellent working conditions and continued efforts for excellent technical equipment in the laboratories. Modern analytical techniques for the quantification of small and macromolecular biomolecules are based on chromatographic mass spectrometry and ligand binding assays1-3.
Biomolecules
Lysozyme
It is very abundant in secretions such as tears, breast milk, gastric juice, pus and nasal mucus, and it can also be found in saliva, semen and serum. Since it is a ubiquitous protein in cells, any change in lysozyme level in human urine or serum can be used as the clinical index for diagnosing health problems; for example, high serum levels of lysozyme may be associated with pathological conditions such as rheumatoid arthritis11 and Crohn's disease11.
Nucleic acids and their building blocks
Also called N-acetylmuramide glycanhydrolase or muramidase, it is an enzyme that damages bacterial cell walls by catalyzing the hydrolysis of 1,4-beta bonds between N-acetylmuramic acid and N-acetyl-D-glucosamine residues in peptidoglycan. Urinary lysozyme levels have differential diagnostic value in monocytic or myelomonocytic leukemia and can be used to monitor the patient's response to cancer therapy.
N-acetyl amino acids
It has many pharmaceutical and physiological functions, such as antitumor, anti-inflammatory, antihistaminic, immunomodulatory and antiviral activity7. Increased concentrations in urine and serum are observed in urogenital tumors10 and renal dysfunction9, and extremely high concentrations in serum (5–230 mg/ml) and urine (up to 1600 mg/l) are observed in monocytic and myelomonocytic leukemia 9,12.
Conventional methods for the analysis of biomolecules of interest
Despite the relatively high sensitivity and resolution of modern mass spectrometers, they are unable to detect low abundance proteins masked by more abundant proteins. An additional step in sample preparation should be introduced to deplete high abundance proteins using commercially available immunoaffinity depletion columns.
Novel approaches to the analysis of small biomolecules
Luminescence of lanthanide complexes
Other conventional methods, such as two-dimensional gel electrophoresis47, lack the sensitivity and resolution to detect and quantify low-abundance proteins. The long lifetime of the excited states enables the use of time-resolved detection, which is a definite advantage for biological assays55,56 and luminescence microscopy57.
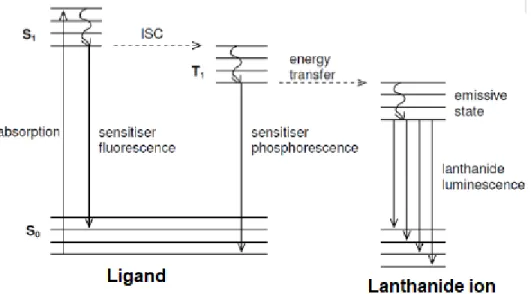
Mechanism of antenna lanthanide formation
Anticoagulant and antifungal studies indicate an increase in ligand activity upon complexation, particularly with lanthanides74,75. The luminescence of the Eu(III)-BCCA complex was quenched by inosine, cytidine and guanosine, but not by adenosine.
Novel approaches to the analysis of proteins
Protein selective polymer by molecular imprinting
Four proteins, BSA, Cyt c, pepsin (Pep), and myoglobin (Mb), differing in molecular weight (MW) and isoelectric point (pI) were used to test the selectivity of the imprinted nanoparticles. Based on the above observations, multiple interactions with the target protein played an important role in the selective capture process.
Protein-selective polymers with optimized functional groups
Electrostatic interactions between positively charged lysozyme and the negatively charged sulfonate moiety of the copolymer, and hydrophobic interactions between lysozyme and the polyNIPAm backbone, enabled specific binding and rebinding of lysozyme. From this set, comonomers, complementary to the characteristic surface moieties of the target protein, were copolymerized in an appropriate estimated stoichiometric ratio.
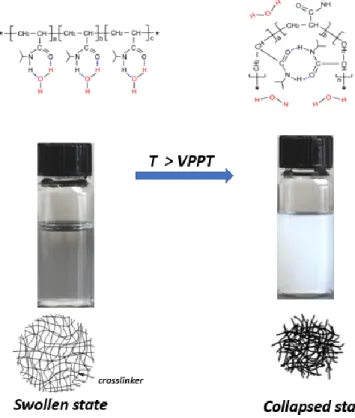
Poly(N-isopropylacrylamide) gels and microgels
Synthesis of poly(N-isopropylacrylamide) microgels
Various polymerization methods to prepare pNIPAm microgels include free-radical precipitation copolymerization in the presence of wetting agent116, wetting-free precipitation polymerization (SFPP)138, precipitation polymerization in reverse micelles139, dispersion polymerization140, block copolymerization141, and interpenetration networks. Among these, aqueous free radical precipitation polymerization is the most flexible in terms of reagent purity, experimental conditions, and choice of monomers.
Initiation of the polymerization
This method is very attractive because it is compatible with a wide range of monomers bearing different functional groups.
Iron oxide magnetic nanoparticles
The disadvantage of the chemical co-precipitation method is the tendency of the particles to agglomerate very quickly. The solvothermal method provides a powerful way to control the size and morphology of the nanostructure296.
Surface modification of magnetite MNPs
In the so-called "grafting onto" approach, finally functionalized polymer chains are grafted onto a solid substrate. In contrast, the "grafting from" technique involves the growth of polymer chains from solid surfaces by means of surface-initiated polymerization of monomers by free radical or controlled/living polymerization techniques.
Fluorescence anisotropy or fluorescence polarization
Measurement of fluorescence anisotropy
The observed intensity is called Iǁ when the emission polarizer is oriented parallel (ǁ) to the direction of polarized excitation. Other information from the Perrin equation predicts that if τ is constant, the observed polarization depends only on the rotational correlation time of the molecule, which is related to the molecular volume of the fluorescently labeled molecule (V), the Boltzmann constant (K), the viscosity of of the environment (η), and the absolute temperature (T) of the solution according to the following equation (17)50.
Fluorescence polarization immunoassays
This limitation is a result of the use of short-lived fluorophores, such as fluorescein (τ ≈ 4 ns). The protein molecular volume (V) relates the molecular weight (MW) to the rotational correlation time () of the protein.
Materials
Iron (II) chloride tetrahydrate (FeCl2·4H2O) Sigma Aldrich AnalaR Normapur Iron(III) chloride hexahydrate (FeCl3·6H2O) Sigma Aldrich puriss.
Synthesis methods
- Synthesis of the polymer nanoparticles (PNPs) - Chapter 5
- Synthesis of polymer nanoparticles (PNPs) - Chapter 7
- Synthesis of poly (N-isopropylacrylamide-co-N-tert-butylacrylamide-co-acrylic acid)
- Preparation of RuL-Su labeled lysozme
- Preparation of the Eu 3+ -(AOCC) complex
Synthesis of the polymeric nanoparticles for the anisotropy measurements was performed as in section 3.2.1 using the composition of PNP1, except that the total monomer concentration was 130 mM. MNPs@SiO2 nanospheres were prepared by adapting the widely used solgel method 212.
Characterization methods
- Infrared spectroscopy
- Dynamic light scattering measurements
- Nanoparticle tracking analysis
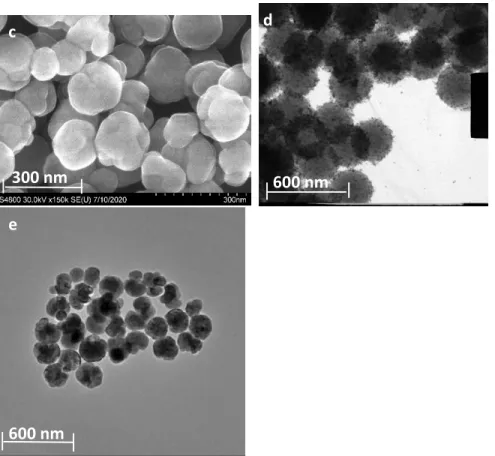
- Scanning electron microscopy
- Transmission electron microscopy
- X-Ray diffraction measurements
- Thermogravimetric measurements
- Fluorescence measurements
- HPLC measurements
The zeta potential and the hydrodynamic diameter of the different PNPs were determined by dynamic light scattering (DLS) measurements on a ZetaSizer Nano ZS instrument (Malvern Instruments, Malvern, UK). The thickness of the polymer shell was calculated from the difference in total weight loss between MNPs@SiO2-RAFT and Lys-PMNP or Lys-PMNP-TEMED.
Methodology
- Methodology - Chapter 4
- Methodology - Chapter 5
- Methodology - Chapter 6
- Methodology - Chapter 7
The slope of the decrease in absorbance during the first 5 minutes was used as a measure of lysozyme activity. The concentration of the dye in labeled Lys (10m MPB pH 7.4) was determined by measuring the absorbance at 457 nm, which is the absorption maximum of the dye.
Introduction
Results and discussion
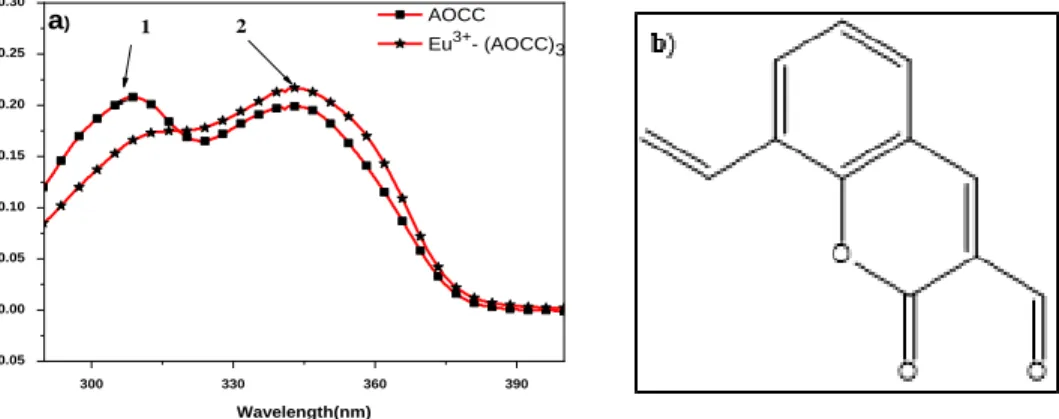
Steady-state absorption and luminescence spectroscopy of Eu 3+ -(AOCC) 3 complex . 53
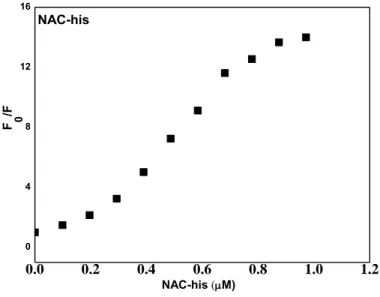
In the spectrum of the Eu3+(AOCC)3 probe, there is a broad excitation band, from about 300 to 400 nm, and the strong emission intensities above 550 nm indicate that the AOCC ligand is a good chromophore to absorb energy and transfer it to the Eu3+ ion (antenna effect). In summary, in the Eu3+-(AOCC) complex, the organic ligand efficiently absorbs and transfers energy to the metal ion (intramolecular energy transfer) and consequently increases its luminescence intensity.
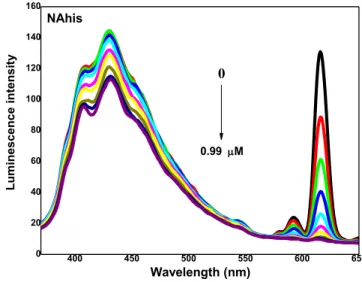
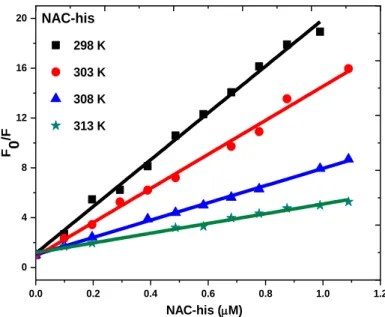
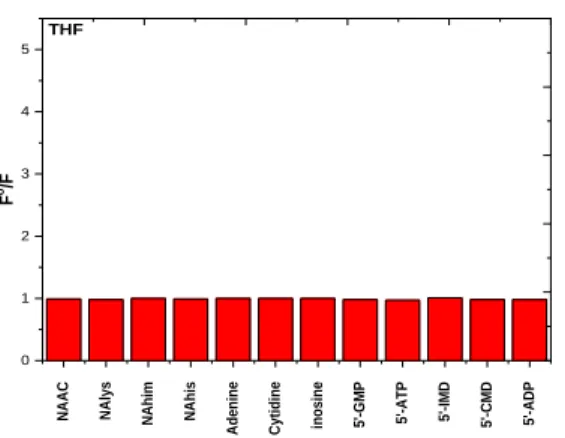
Interaction of the Eu 3+ -(AOCC) 3 complex with various biomolecules
In the presence of the biomolecules, the time-resolved luminescence intensity of the Eu3+- (AOCC)3 complex at λem. Plot of ln K versus 1/T for the binding of the Eu3+-(AOCC)3 complex with NAC-his is shown in Figure 16 (see Appendix A, Figure A4 for the other biomolecules).
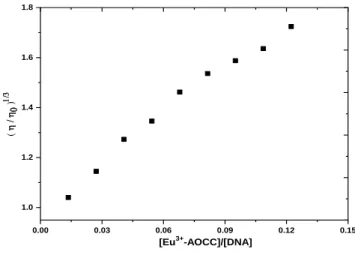
Luminescence studies of the interaction of the Eu 3+ -(AOCC) 3 probe with CT-DNA . 65
Therefore, restoration of MB luminescence is indicative of an intercalative binding mode between the Eu3+-(AOCC)3 complex and CT DNA. The linear range was also calculated, and the characteristics of the interaction between the Eu3+-(AOCC)3.
Introduction
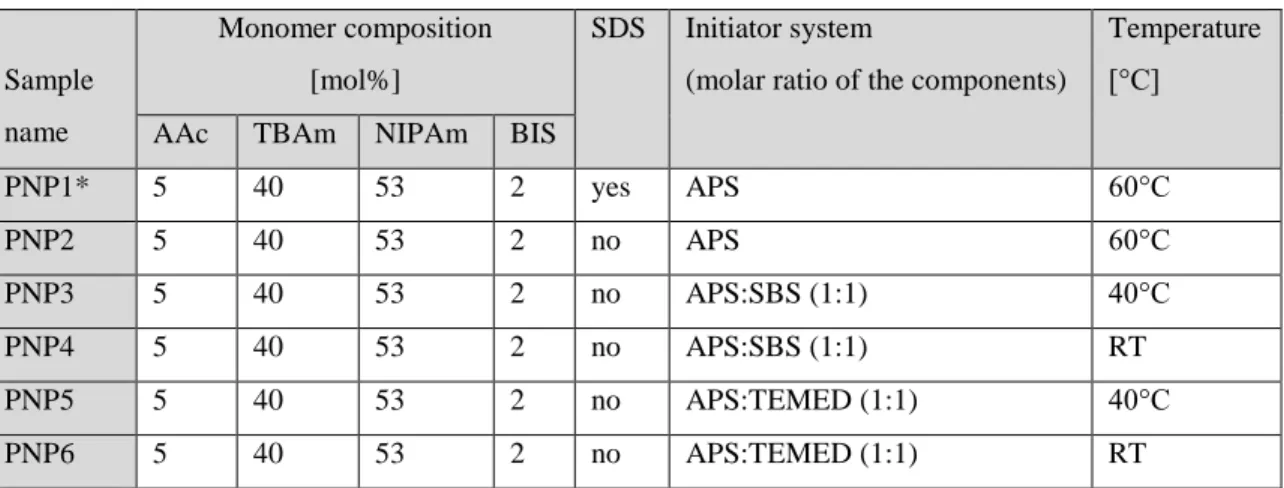
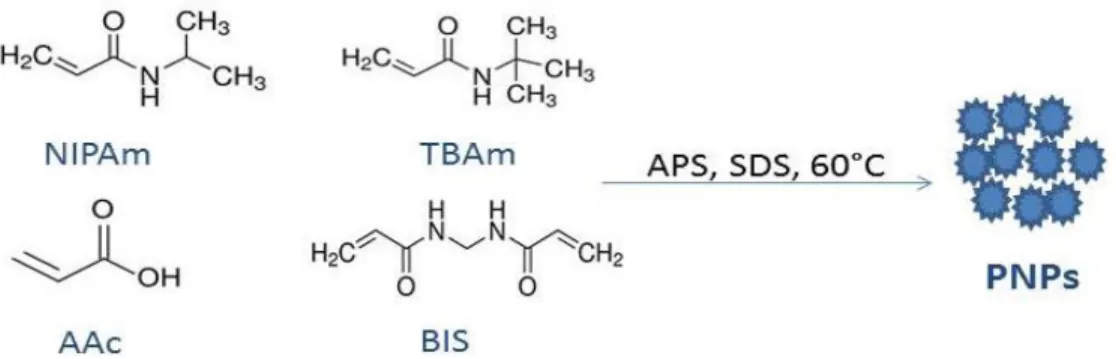
In this work, we compared the physicochemical properties, the polymerization rate, and lysozyme binding properties of poly(NIPAm-co-TBAm-co-AAc) nanoparticles proposed by Yoshimatsu using different initiation systems. We used ammonium persulfate at 60°C, both in surfactant-free precipitation polymerization and also by using SDS, and the redox systems APS/TEMED and APS/SBS at RT and at 40°C.
Results and Discussion
- Preparation of the PNPs
- Characterization of the PNPs
- Monomer conversion measurements
- Lysozyme binding properties of the nanoparticles
To visualize the relative conversion rates of the individual monomers, their conversion was plotted against the total monomer conversion in the different polymerization systems (Figure 24). Conversion of acrylic acid as a function of total monomer conversion with varying TEMED concentrations (b).

Conclusion
In a complementary set of experiments, we compared the lysozyme binding affinity of PNP7; PNP5 and PNP8 with 2.5; 5 and 10 mol % AAc feed concentration, respectively. Increasing the AAc feed ratio to 5 and 10 mol % resulted in correspondingly increased surface concentrations of 250 and 700 µg/m2, respectively.
Introduction
Results and Discussion
- Preparation and characterization of P(NIPAm-co-TBAm-co-AAc) coated MNPs (Lys
- Characterization
- Effect of time on the protein binding of Lys-PMNPs
- Effect of buffer ionic strength and pH on the protein binding of Lys-PMNPs
- Adsorption isotherms
- Selectivity towards different proteins
- Thermally modulated binding and release of lysozyme
- Development of a sample cleanup procedure for the measurement of lysozyme in
- Method validation
- Comparison to a reference method by the measurement of unknown samples
Because of the partially electrostatic nature of lysozyme binding, we have investigated the role of buffer concentration in the binding process. The concentration of Lys-PMNPs (i.e. phase ratio) in the binding step was crucial regarding the recovery of the sample pretreatment process.
Conclusion
The validation results and comparison with an established clinical method show that the selective Lys-PMNPs work successfully as a new sample extraction tool and the optimized bioanalytical method can be used to measure lysozyme in human urine samples for diagnosis clinical monocytes or myelomonocytes. leukemia. 7 A new technique for investigating protein binding to polymer nanoparticles based on fluorescence anisotropy measurement using long-lived fluorophores.
Introduction
If we use long-lived fluorophores (τ> several hundred ns) as protein labels, the rotational correlation time of the protein becomes negligible on this time scale and low anisotropy is expected. Finally, a competitive binding assay for quantification of lysozyme using the selective PNPs is presented.
Results and Discussion
Preparation and characterization of the poly (N-isopropylacrylamide) based nanogel
Based on this, the molecular weight of the PNPs was calculated to be 79.6 million Da. The conjugation reaction is favored under slightly alkaline conditions (pH 7.4-9), due to the deprotonation of the amino group305.

Spectroscopic characterization
Reduced conformational flexibility of the probe in the adsorbed protein reduces the ISC quantum yield. The size of the RuL-Su cation was approximated by that of the parent cation, Ru(bpy)3.

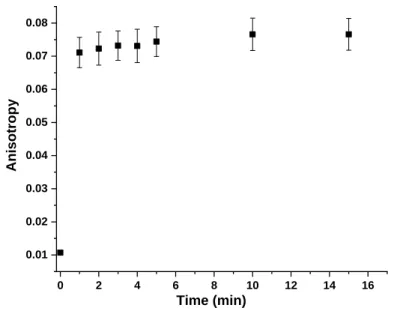
Steady-state anisotropy measurement of the protein-PNP binding
Based on the affinity measurements, the amount of the labeled protein was chosen as follows. At high concentration of unlabeled lysozyme, the anisotropy approached that of free RuL-Lys.
Conclusion
The method is based on the quenching of the luminescence of the Eu3+-(AOCC)3 complex by bound biomolecules. Horváth, "The role of the initiator system in the synthesis of acidic multifunctional nanoparticles designed for molecular imprinting of proteins", Period. Horvath, "Optimization of Polymerization Conditions of Thermoresponsive Poly(NIPAm-co-AAc-co-TBAm) Microgels for Molecular Imprinting of Lysozyme" 23rd Oláh György Doctoral School Conference, September 2019, Budapest, Hungary.
These confirm the successful synthesis of the polymer shell on the Fe3O4@SiO2@RAFT particles.