PTCA: percutaneous transluminal angioplasty QTBc: corrected QT interval by the Bazett formula QTc: corrected QT interval. The duration of the QT interval on the surface ECG is a global measure of the time it takes the heart to depolarize and repolarize. However, the effect of mental stress on the QT interval is subject to speculation: previous reports provided conflicting data on the effect of mental stress on the duration of the QT interval.
Therefore, we have conducted four experiments assessing the effect of different mental stressors on the QT interval.
INTRODUCTION 11
THE QT INTERVAL 11
- The Cardiac Cycle 11
- Duration of the QT Interval 12
- QT Hysteresis 12
- Measurement of the QT Interval 12
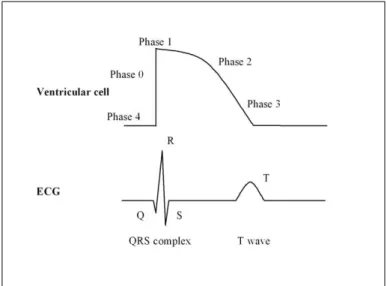
Note, the QT interval is a sum of the ventricular electrical activity; significant differences in AP duration can be detected across different types of myocardial cells. In a given individual at a given moment, the primary factor controlling the duration of the QT interval is the heart rate, more precisely, the duration of the preceding cycle length. On the surface ECG, complete adjustment of the QT interval after a sudden change in heart rate is associated with a time delay (QT lag) (4-7).
The reverse is also true, such that as the heart rate slows, the QT interval will take several minutes to fully lengthen to its new steady-state value.
THE CORRECTED QT INTERVAL 14
- The Concept of QT Interval Correction 14
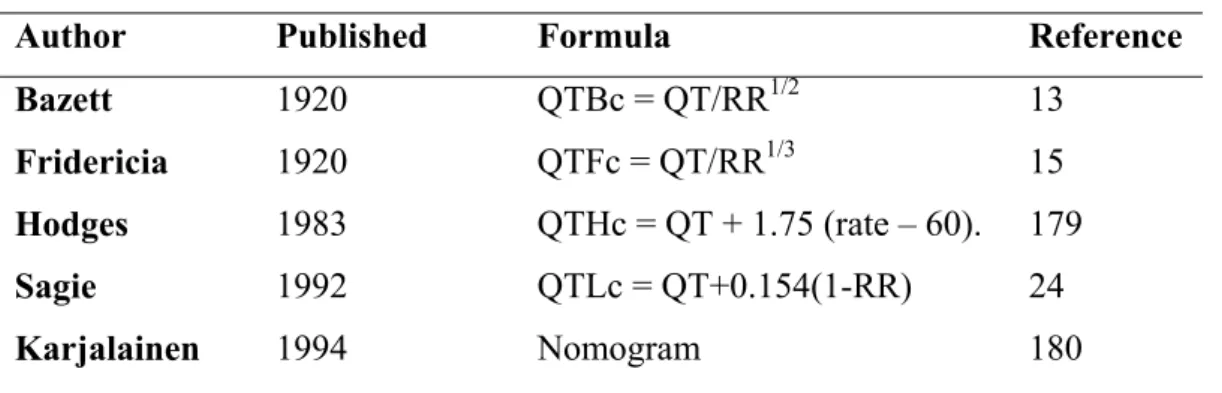
- The History of QT Correction 15
- Evaluation of the Fixed QT Correction Formulae 17
- Study and Subject Specific QT Interval Correction 19
For example, amiodarone causes marked prolongation of the QT interval but is not associated with a high risk of proarrhythmia. It is generally assumed that the QT interval is determined by the AP duration of the ventricular myocytes (77). The role of the ANS was demonstrated by the prolongation of the QT interval during sleep, independent of heart rate.
Consequently, we directly examined the effect of the first morning cigarette on QT interval duration in habitual smokers after an overnight smoking cessation (Study #1). Heart rate plays a significant role in the variation of the length of the QT interval. Exponential correction of the QT interval to minimize the effect of heart rate in children.
VARIABLES AFFECTING THE QT INTERVAL 20
QT PROLONGATION 21
- Overview 21
- Population Based Studies 22
- Congenital Long QT Syndrome 23
- Acquired Long QT Syndrome 24
- Ischemic Heart Disease 25
An example from our study of a drug interaction leading to significant QT prolongation is presented in Figure 5 (74). However, in an experimental animal model, acute regional ischemia is typically associated with QT prolongation despite shortening of AP duration in the ischemic region (80). One possible explanation is that the QT interval is determined by the longest AP duration in the ventricles.
They found that during PTCA-induced ischemia, the QT interval decreased with increasing duration of ischemia.
STRESS AND THE CARDIOVASCULAR SYSTEM 27
- The Evolution of Stress Concept 27
- Stress Reactivity and Brain Processing Pathways 29
- Anatomical and Functional Nerve Projections to the Heart 30
- Stress Effector Systems 31
Selye's stress response model anticipated more modern concepts of allostatic systems (those that respond to stressors through dynamic regulation of physiological states). The physiological response to the activation of the limbic system is an increase in heart rate and blood pressure, which determines hemodynamic reactivity. The right stellate cardiopulmonary nerve, from the right stellate ganglia, passes through the dorsal nerve plexus to the left lateral cardiopulmonary nerve and projects to the lateral wall of the left ventricle.
Parasympathetic innervation of the heart is provided by efferent paraganglionic parasympathetic neurons in the medulla oblongata that project axons to the heart.
MENTAL STRESS 32
- Mental Stress and Cardiovascular Innervation 32
- Active and Passive Mental Stress 32
- Hemodynamic Effects 33
- Alterations in Coronary Vasoreactivity 34
- Platelet Activation 34
- Endothelial Injury 35
- Arrhythmias 35
- Behavioral State 36
- Effect on the QT Interval 37
One research group compared myocardial blood flow responses during mental stress in patients with CAD and in healthy subjects (123). Interestingly, the phenomenon of mental stress-induced endothelial dysfunction has been described in healthy subjects, as well as in patients with CAD and hypertension. Conversely, other laboratory-based studies have reported shortening of QT interval as an effect of mental stress (165-169).
Therefore, it is so far unknown how the QT interval is affected by these two forms of mental stress.
OBJECTIVES 39
DEMONSTRATE SHORTCOMINGS OF THE BAZETT METHOD 39
EVALUATE THE RELATIONSHIP BETWEEN 41
SUBJECTS AND METHODS 43
- OVERVIEW 43
- MENTAL ARITHMETIC 44
- ECG DATA ACQUISITON AND PROCESSING 44
- CORRECTION OF THE QT INTERVAL FOR HEART RATE 45
- STUDY #1 47
- Subjects 47
- Methods 47
- STUDY #2 48
- Subjects 48
- Methods 48
- STUDY #3 49
- Subjects 49
- Methods 49
- STUDY #4 50
- Subjects 50
- Methods 50
- STUDY #5 51
- Subjects 51
- Methods 51
- STUDY #6 52
- Subjects 52
- Methods 52
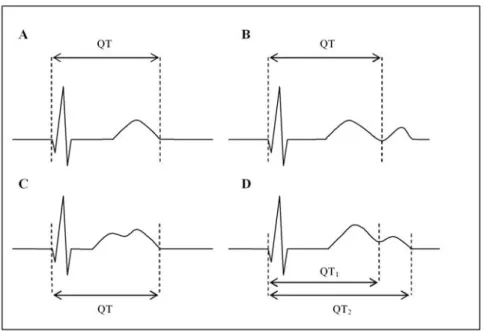
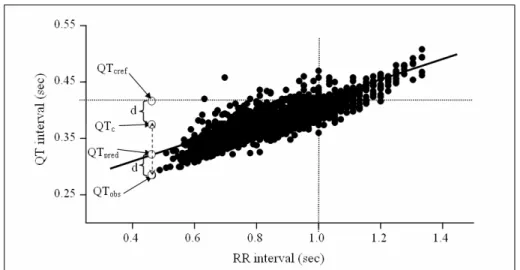
The QT interval was measured from the beginning of the QRS complex to the end of the T wave, defined as the return to baseline. Correction number values are negative below 60, positive above 60 and equal to zero at a heart rate of 60/min. Successful heart rate correction should lead to corrected QT values that are independent of the original RR interval (or heart rate) values.
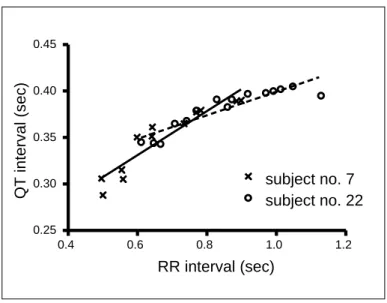
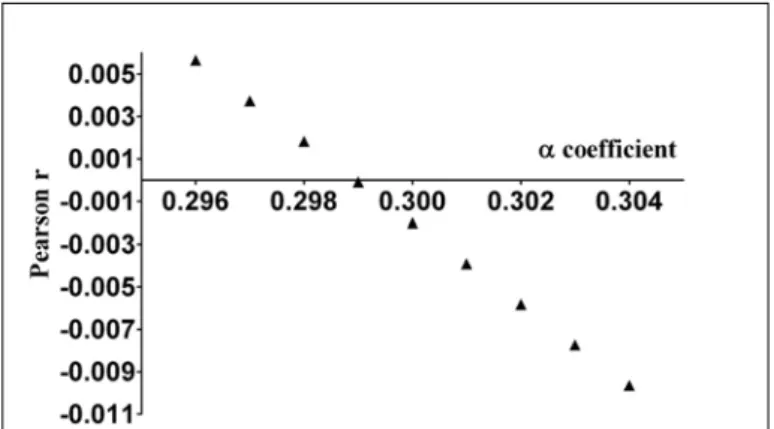
In our research when using specific QT correction, the coefficients of the mathematical equations (linear or nonlinear) were always determined so that the correlation between heart rate and corrected QT was close to zero. For example, in Study #2 we optimized the parabolic equation QTc = QT/RRα, which is also the generic form of the Bazett and Fridericia formulas. A successful heart rate correction formula should lead to corrected QT values that are independent of the original RR interval (or heart rate) values.
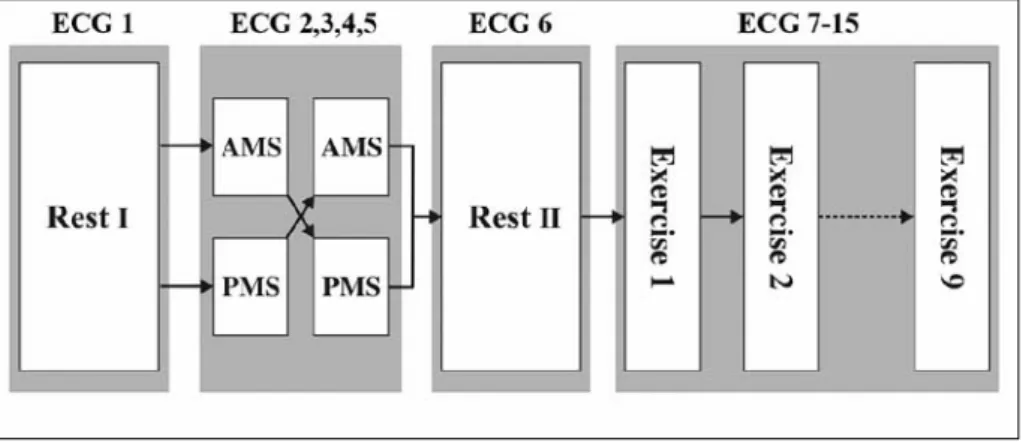
ECG electrodes were attached to the left and right shoulders, and to the left side of the thorax in the fifth intercostal space. Three lead electrocardiograms were recorded in the first 10s of the minute for 6 consecutive minutes representing three 2-minute study periods: 1) before the match (PRE - 2 min), during the match (DUR - 2 min), and after the match ( POST - 2 min). Data on heart rate and QT interval duration generated by the built-in software of the electrocardiograph were visually verified (GA) and used for further analysis.
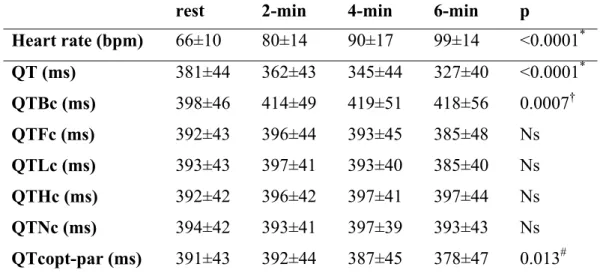
In each subject, the representative heart rate and QT values for the three study periods were obtained by calculating the means of the data pairs in the period (RR, QT and QTc). Therefore, linear regression analysis of the QT/RR data pairs was used to determine the slope of the regression line in each participant, that is, the value of the parameter α in the generic linear heart rate correction formula: QTcopt-.
RESULTS 56
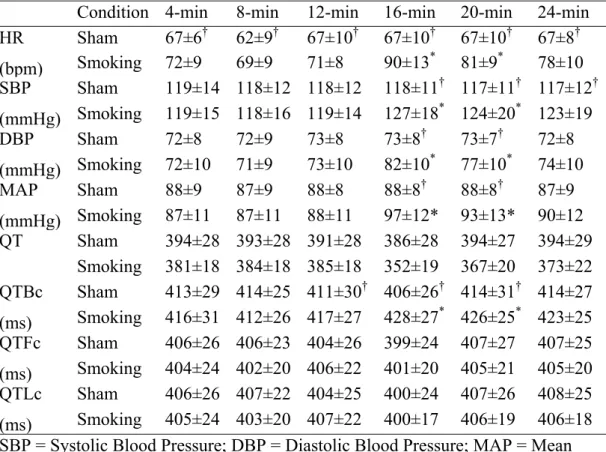
STUDY #1. THE EFFECT OF ACUTE SMOKING 56
STUDY #3. CORRECTED QT OF 31 PATIENTS 59
STUDY #6. THE EFFECT OF ACTIVE AND PASSIVE 62
- QT Interval Changes 63
- T Wave Changes 64
- Likert Scores 68
DISSCUSSION 69
- THE EFFECT OF SMOKING ON THE QT INTERVAL 69
- SHORTCOMINGS OF THE BAZETT METHOD 70
- THE EFFECT OF MENTAL STRESS ON THE QT INTERVAL 72
- Rationale for Using Mental Stress in Cardiology 72
- Individual Response to Mental Stress 73
- The Relationship between Cardiovascular Reactivity 74
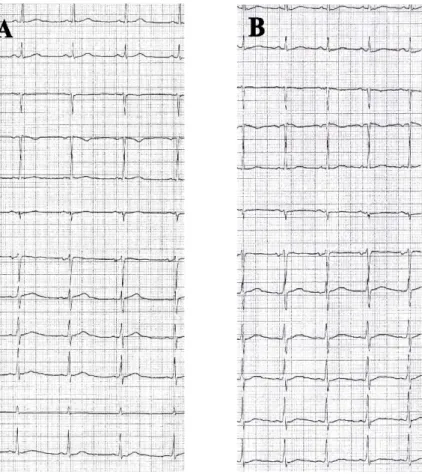
- BIFID (NOTCHED) T WAVE 76
- Prevalence and Conditions Associated with Bifid T Waves 77
Romero Mestre (175) found no significant differences in the duration of the QTBc interval between smokers and non-smokers. On the contrary, using the nomogram method to correct QT, Karjalainen (36) found that smoking was associated with a shortening of the corrected QT interval. Apparently, data on the effect of chronic smoking on the QT interval, regardless of the method used for heart rate correction, are contradictory, and the effect of acute smoking has not been sufficiently studied.
We found considerable differences in the results depending on the QT correction method used (Table 5 and Figure 8). In Study #3, mental stress applied in the form of a simple MA did not cause any change of the QTc interval assessed by means of the 31 patients measured at the end of the 3. Due to the inherent profound heart rate dependence, the Bazett method has the most tendency to show significant QTc differences in case of heart rate changes.
We hypothesized that QT response might be related to CVR, so subjects could be classified by CVR that would also characterize these individuals in terms of QT response. In this study the first QT measurement was performed right at the beginning of the stress periods, with this. We propose that part of the QT prolongation we observed was due to a delay in heart rate adaptation and only the remainder was directly caused by AMS, unfortunately the setting of this study did not allow quantification of these sizes.
We also hypothesize that the overt sympathetic dominance that marks the onset of AMS and the final phase of the 3-. Bifid T-wave has traditionally been considered one of the diagnostic signs of LQTS, more typically LQTS.
CONCLUSIONS 80
Finally, a link between stress and arrhythmia was implied where mental stress caused by asymmetric activation at the level of the midbrain was associated with an asymmetric neural input to the heart, thereby increasing the repolarization inhomogeneities that predispose to arrhythmia (262). Further work is needed to elucidate the mechanisms involved: for example, whether central cortical processing or local sensitization at the level of the myocardial cell may be responsible. These preliminary observations made in healthy young subjects should be extended to patients with coronary artery disease, in whom any regional autonomic effect on repolarization inhomogeneity would be expected to be magnified as a result of ischemia induced by mental stress.
NEW FINDINGS 81
ACKNOWLEDGEMENTS 82
Problems with heart rate correction in the assessment of drug-induced prolongation of the QT interval. 2004) Differences between study-specific and subject-specific heart rate corrections of the QT interval in drug-induced QTc prolongation studies. 1993) Measurement of the QT interval and the risk associated with QTc interval prolongation: a review. 1997) QT interval as a cardiac risk factor in a middle-aged population. Carella MJ, Mantz SL, Rovner DR, Willis PW 3rd, Gossain VV, Bouknight RR, Ferenchick GS. 1996) Obesity, adipose tissue and QT interval prolongation:.
Prognostic value of QT interval and QT interval dispersion in all-cause mortality and cardiac morbidity in a Danish citizen population. Goldberg RJ, Bengtson J, Chen ZY, Anderson KM, Locati E, Levy D. 1991) QT interval duration and total and cardiovascular mortality in healthy subjects (Framingham Heart Study Experience). Bexton RS, Vallin HO, Camm AJ. 1986) Diurnal variation of the QT interval- influence of the autonomic nervous system.
Mental versus physical stress, QT prolongation and the autonomic nervous system. 1989) Electrocardiogram QT interval responses during emotional stress. Paavonen KJ, Swan H, Piipo K, Hokkanen L, Laitinen P, Viitasalo M, Toivonen L, Kontula K. 2001) QT interval response to mental and physical stress in LQT1 and LQT2 types of long QT syndrome. Association between heart rate-corrected QT interval and coronary risk factors in 2894 healthy subjects (DESIR study).
Andrassy G, Szabo A, Dunai A, Simon E, Nagy T, Trummer Zs, Tahy A, Varro A. 2003) Acute effects of cigarette smoking on the QT interval in healthy smokers. Andrássy G, Szabo A, Ferencz G, Trummer Z, Simon E, Tahy Á. 2007) Mental stress can induce QT interval prolongation and T-wave notching. 2002) Duration and dispersion of the QT interval in smokers. 2005) Gender differences in electrophysiological effects of mental stress and autonomic tone inhibition: a study in healthy individuals. 2006).
Andrássy G, Dunai A, Simon E, Nagy T, Trummer Zs, Tahy Á. Andrássy G, Dunai A, Simon E, NagyT, Trummer Z, Tahy A, Varro A, Szabó A. 2002) Immediate effect of cigarette smoking on QT interval in habitual smokers.