The results of this research show that some positive significant relationships exist between management practices and family business performance for first and second generation managers. As a result, this research work proposes to help family business managers to train their heirs and the chosen successor in management practices.
INTRODUCTION
Little information is collected on family business members' interest in social activities (Fitzgerald et al., 2010). Without a business plan, the future of the family business will lead to a decline in their numbers (Ward, 1987).
RESEARCH MODEL
- Purpose and Justification of the Study
- Research Questions
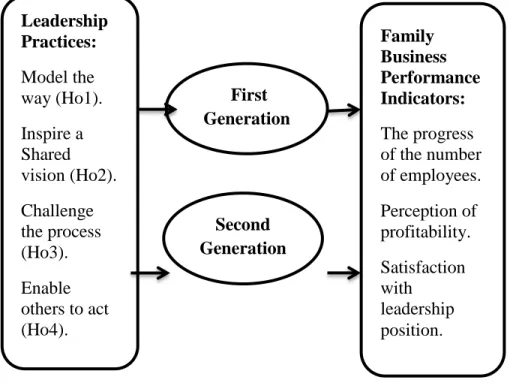
- Hypotheses
- Research Variables
- Objective of the Dissertation
- The Significance of the Dissertation
- Kouzes and Posner Exemplary Leadership Practices Inventory LPI
- Neo-Charismatic Leadership and Business Performance
- Business Performance Indicators (The Dependent Variables)
- Business Performance Approaches
- On the Other Part the Subjective Measures
- The Third Subjective Measures, the Measurement of Satisfaction
- Quinn's Leadership Theory
The leadership practices of first-generation leaders differ from those of second-generation leaders. The purpose of the study is to investigate whether management practices have an effect on the performance of the family business.
MATERIALS AND METHODS
Target Population, Sample size and Procedure
However, she often uses fraudulent methods to smuggle her huge profits out of tax liability. In this context, the statistics of the Directorate of Imports of the Ministry of Finance reveal that the number of Lebanese companies declared at the end of November 2018 was 101,595 companies, of which 6,274 companies (6% of all companies) do not operate according to them. permits with the ministry. Note that half of the companies that declare their employees employ fewer than 5 workers, while only 0.6% declare more than 100 workers.
Thousands of businesses ceased operations and the number of businesses closing their doors increased due to the pandemic.
Methods applied for data collections
It enables others to act, encouraging people to participate and contribute to decision-making and planning within the organization. The questionnaire collected general information about the successor of the family business, such as age, gender, level of education, experience. The questionnaire was distributed in person and online using the data collection tool Google-Forms and sent by e-mail to 300 companies representing 300 (first and second generation) family business managers, of which 267 respondents received a completed and returned questionnaire. with an 89% response rate.
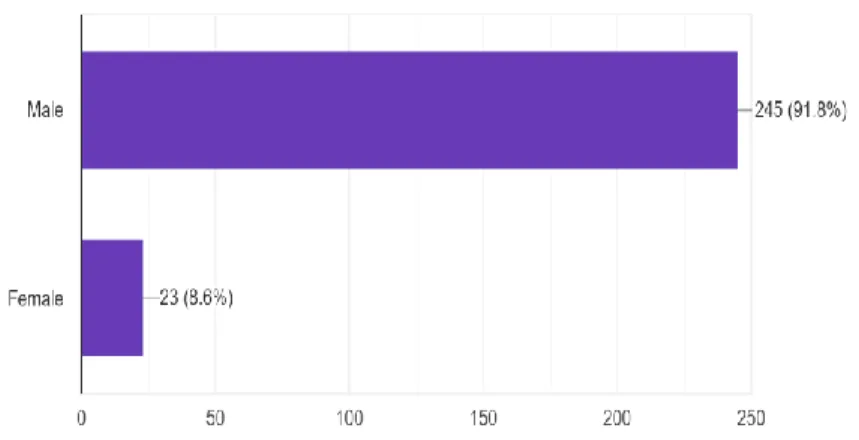
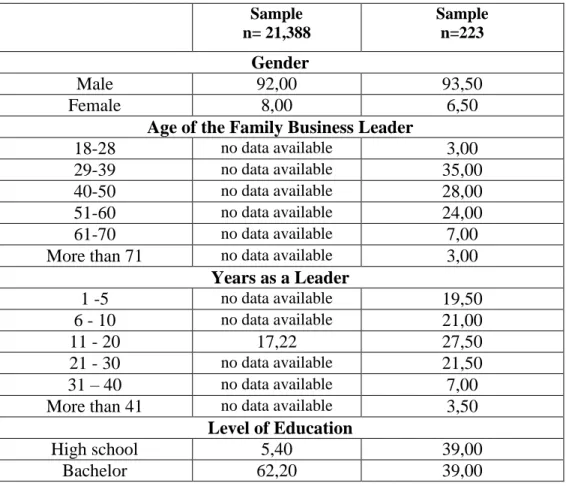
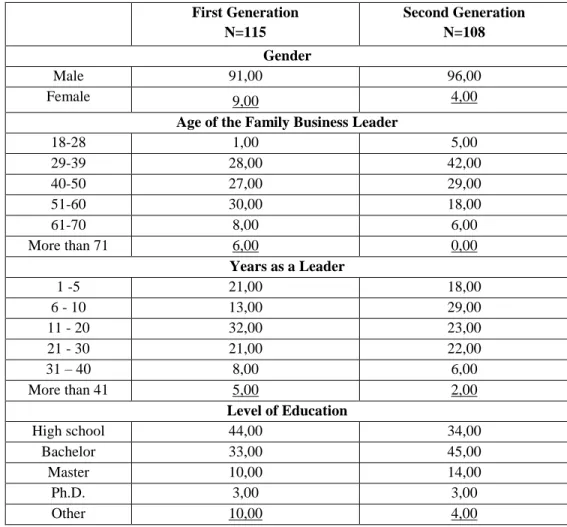
This gender composition represents the family business leaders' participants of the active family businesses in Lebanon in 2020, where the male is dominated by the selection of the family business leaders.
Data Analysis Instruments
It is used to calculate the internal consistency of the result we measure. We will use the validity of the measuring instruments to study the validity of the variables, their measure, their accuracy and the accuracy of the instrument. Thus, this research will study the correlation matrix to validate the discriminant validity of the research samples.
SEM helps us support the hypothesis of the proposed research model; this will be supported by the sample data so that the unobserved variable is related to the observed one.
RESULTS AND THEIR EVALUATION
Demographic Data
- Personal Information of the Respondents
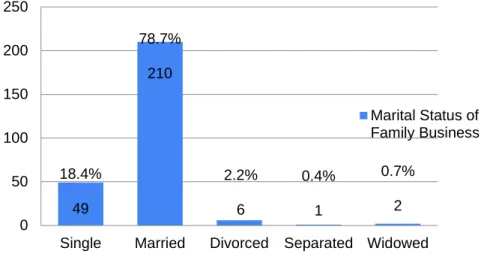
- Sample analysis Based on the marital status of the Family Business Leaders
- Sample analysis Based on the Role of the Family Business Leaders
- General Data of the Firms
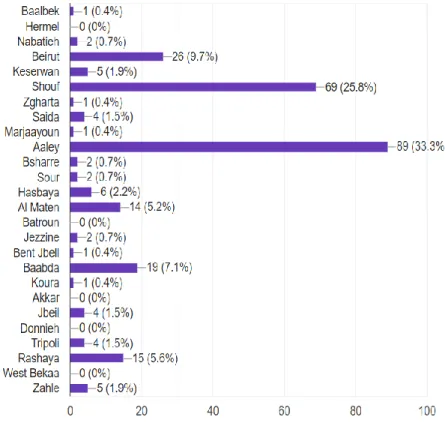
- Sample analysis Based on the Location of the Family Business Companies
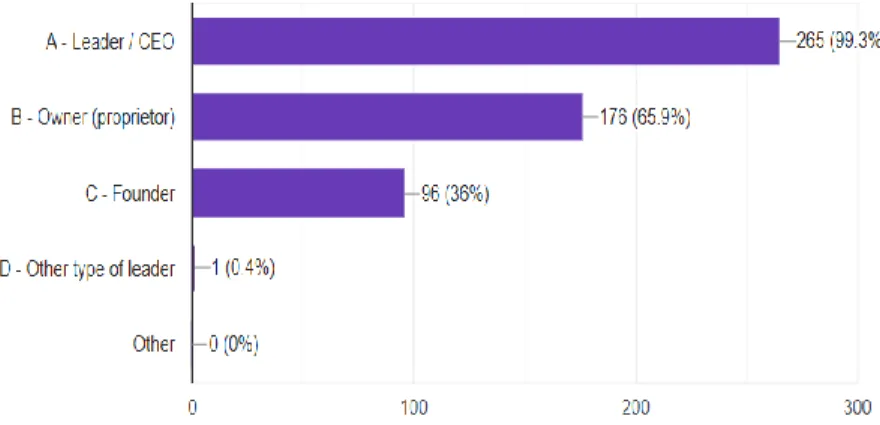
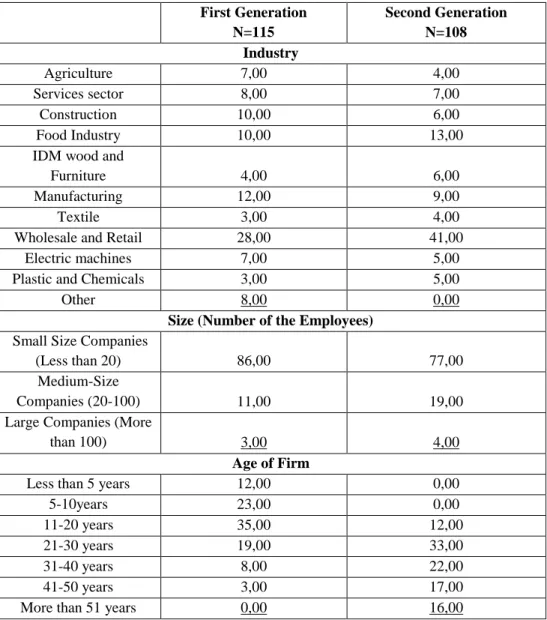
Identify below the role of the family business leaders in the Lebanese enterprises, where most of the participants 99.3% have a position as a leader/CEO roles, 65.9% are the owner of the business, and 36% are founders. It shows that the majority of the first generation companies (28%) belonged to the wholesale and retail industry, which describes the profile of family businesses in Lebanon, and which is also popular among Lebanese business people. It can therefore be considered that the majority of the sample is at their relative retirement and the young age of business.
These findings consistently show that the majority of Lebanese family business leaders belong to small and medium-sized businesses for both generations, and they prefer to employ a small number of employees.
DESCRIPTIVE STATISTICS
- Various Correlations between dependent and independent variables
The results in Table 7 show that 38.5% of women are good role models as leaders and fully agree with the statement. For those who agree, the situation is reversed: 42.4% of men agree with the statement compared to just 7.7% of women. If we consider the statement "I invite others to share an exciting dream or vision of the future (Isv3)," the results show that 42.6% of seniors are very satisfied with the leadership position and agree with the statement Isv3, (48.8%) are satisfied with the leader position and agree with the statement (Isv3)", 33 0% very satisfied with the leadership position and agree with the statement, followed by 28.0% satisfied with the leadership position and completely agreed with the statement and The proportion of leaders who are undefined (neutral) is very high 38.2% and 29.4% and agreed with Isv3's statement.
Regarding the statement "I speak with complete certainty about the supreme purpose and purpose of our work (Isv6)," the results show that 41 5% of managers are very satisfied with the leadership position and agree with the statement Isv6, (47.6% ) are satisfied with the leadership position and agree with the statement (Isv6)‖, 39 4% are very satisfied with the ownership position and completely agree with the statement, followed by 24.4% satisfied with the leadership position and fully agree with the statement, and the Proportion.
Analysis of the Leadership Practices Inventory (LPI) - Reliability and
- Reliability of Scales Using Cronbach's Alpha
- Convergent Validity
- Discriminant Validity
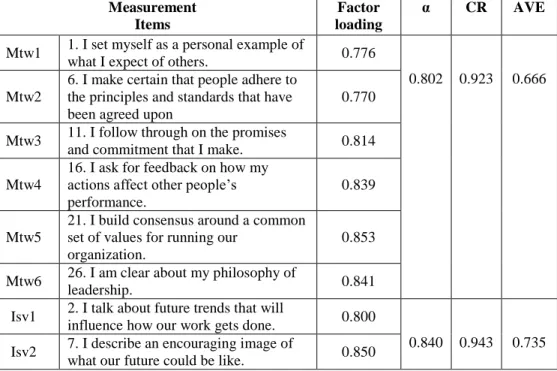
Analysis of the Leadership Practices Inventory (LPI) - Reliability and validity for first generation leaders. Average variance extracted (AVE) reflects the amount of variance in the indicator that is accounted for by the latent constructs and is a more conservative estimate of the validity of a measurement model (Fornell & . Larcker, 1981). It suggested that if the square root of AVE for a latent construct is greater than the correlation values between all latent variables that means discriminant validity is supported.
Analysis of the Leadership Practices Inventory (LPI) - Reliability and Validity for the Second Generation Leaders.
Analysis of the Leadership Practices Inventory (LPI) - Reliability and
- e i i ity of c es Using Cron ch‘s A ph
- Convergent Validity
- Discriminant Validity
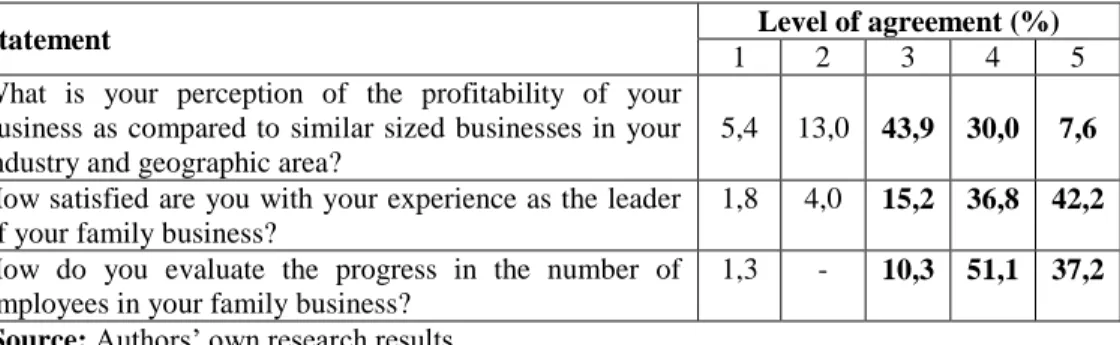
I give people a lot of freedom and choice to decide how to do their work. What is your perception of the profitability of your business compared to businesses of similar size in your industry and geographic area. It shows that the square root of the AVE values of all constructs is greater than the inter-construct correlations which confirm the discriminant validity.
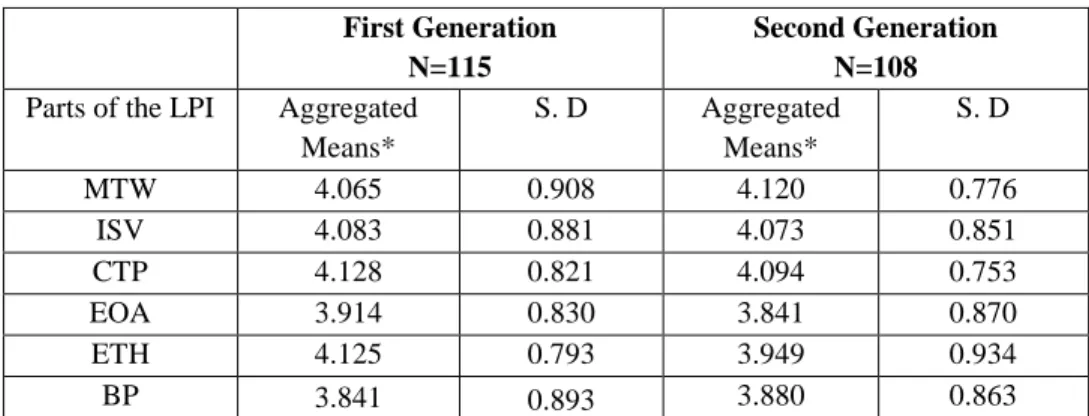
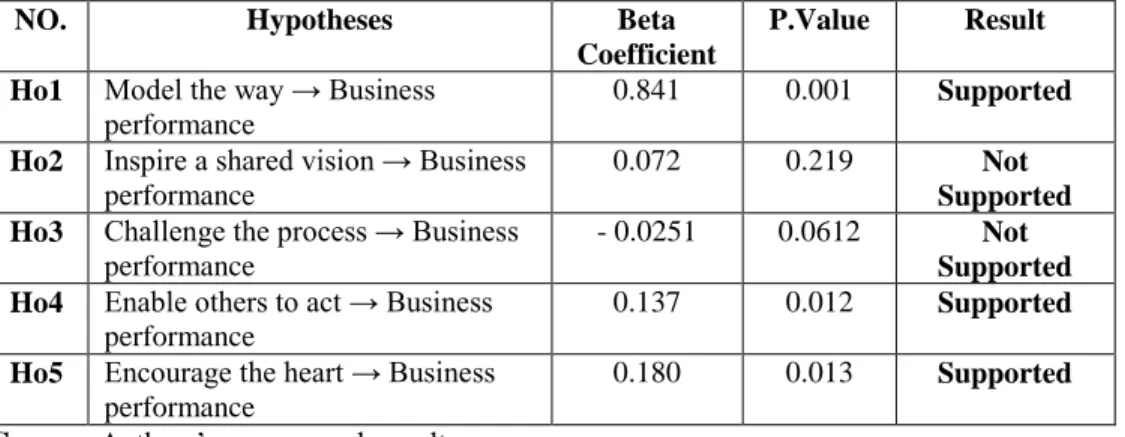
MTW= Model the way, ISV= Inspire a shared vision, CTP= Challenge the process, EOA= Enable others to act, ETH= Encourage the heart, BP= Business Performance Source: Authors own research results.
The Structural Equation Modeling (SEM)
- Hypothesis Testing for the First Generation
- Hypothesis Testing for the Second Generation
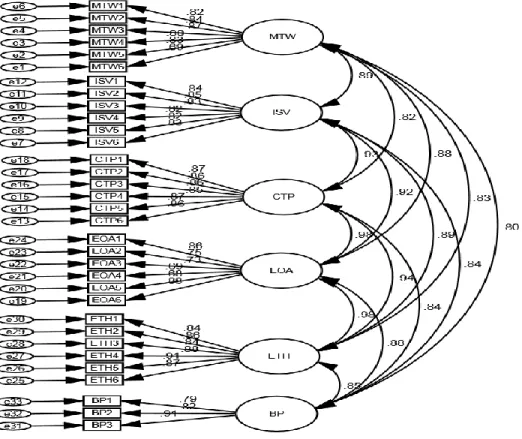
The R² value for the dependent variable family business performance in Figure 8 and Table 13 for the first generation classification is and 0.84. Therefore, it is management practice that has a significant and positive. influence on family business performance of first generation family business managers. The results show that management practices for the second generation, i.e. Table 14 Results of hypothesis tests for the second generation.
Where the results of the R² value for the dependent variable performance of family businesses in Figure 9 and Table 14 for the second generation classification are and 0.71.
CONCLUSIONS AND RECOMMENDATIONS
Data Analysis and Interpretation of Results – First Generation Leaders
CTP is positively correlated with family business performance for first-generation family business leaders. EOA is positively correlated with family business performance for first-generation family business leaders. ETH is positively correlated with family business performance for first-generation family business leaders.
The results of the last hypothesis indicate a positive (β=0 180) and significant (p<0 013) relationship between the leadership practice ―encourage the heart‖. ETH) and family business performance.
Data Analysis and Interpretation of Results-Second Generation Leaders
CTP is positively related to family business performance for second-generation family business leaders. ETH is positively related to family business performance for second-generation family business leaders. While second-generation Lebanese family business leaders only engaged in family business leadership practices Modeling the Way (MTW), Challenging the Process (CTP) and Encouraging the Heart (ETH), which had a significant impact on the performance of family business.
Based on the results, first- and second-generation family business leaders can use some of the 5 leadership practices in maintaining family business success.
NEW SCIENTIFIC RESULTS
Cultural differences cause limitations and lack of applicability of some of the Five Leadership Practices Inventory (LPI) model. The result of the difference between the leadership practices of the first generation from those of the second generation leaders is confirmed in this study and shows that leadership practices such as challenging the CTP process do not have an impact on the performance of the family business for the first generation. leaders while having a positive and significant impact on family business performance for second generation leaders. In summary, this research study was the first to successfully adopt the LPI leadership practices inventory in Lebanon to investigate which leadership practices are most related to business performance.
It shares with us new data and experience about a new and developed way of leadership practices to maintain superior business performance.
SUMMARY
CONTRIBUTION OF THE RESEARCH
This study uses Kouzes and Posner's (2012) leadership practices inventory LPI to examine whether correlations exist between the leadership practices and family business performance of the selected participants of family business leaders. The empirical result of the study showed that there is a significant and positive correlation between the leadership practices that model the way of doing things (MTW), empower others to act (EOA) and encourage the heart (ETH) and the performance of family businesses from the first generation family. companies. And there are significant and positive correlations between the individual leadership practices that model the way (MTW), challenge the process (CTP), and encourage the heart (ETH) with family business performance for second-generation leaders.
The results indicate that the adaptation of the individual leadership practices by the Lebanese family business leaders of 1st and 2nd generation will lead to the positive influence on family business performance.
RECOMMENDATIONS
Limitations and Future Research Scopes
Further investigations are needed that can provide a better assessment of management practices and their impact on business performance. The Impact of Managerial Practices on Lebanese Family Business Performance by First Generation Managers. Management practices and their effects on the performance of Lebanese family firms by second generation managers.
Leadership practices and its impact on family business performance: A review and comparison of first and second generation leaders in LEBANON.