Another very important requirement for in vivo applications is the colloidal stability of nanocrystals in an aqueous environment. In my work, I researched the optical properties of SiC nanocrystals with the help of first-principles computer simulations and, based on the results of the calculations, assessed their applicability for biological use.
Modeling the optical properties of nanocrystals
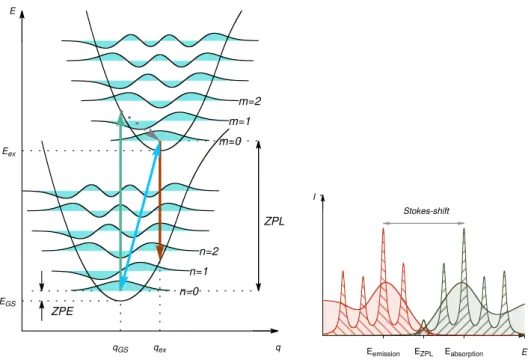
The so-called optical gap is the most important quantity with regard to the absorption of the system. 8At T = 0K, the energy of the photon with the lowest energy absorbed and that of the photon with the highest energy emitted is equal to the ZPL.
Quantum-mechanical many-body problem and the Born-Oppenheimer ap-
- The foundations of Density Functional Theory
- Exhange-correlation functionals, their properties and shortcomings 18
- The time-dependent many-electron problem
- The time-dependent Kohn-Sham equations and exchange-
- The linear response
LDA approximates the exchange-correlation potential as a simple function of the electron density: vxcLDA[ρ](r)≈vxc(ρ(r)). The time-dependent exchange-correlation potential is very complex even compared to the exchange-correlation potential of conventional DFT.
Geometry optimization and molecular vibrations
Although the nuclear coordinates are not variables of the Born-Oppenheimer Hamiltonian, the electron density still changes with the displacement of nuclei which makes the calculation of the Hessian more difficult compared to the case of forces. The variation of the Kohn-Sham orbitals is obtained by first-order Rayleigh-Schrödinger perturbation theory.
Basis sets, pseudopotentials and the PAW method
The other important aspect of the localized basis sets is the radial part of the atomic orbitals. It should be noted that a third approximation also exists for the radial part of the basic atomic sets.
The generating function approach to the calculation of the emission spectra 36
These facts motivated us to concentrate our efforts on modifying the optical properties of SiC nanocrystals. In this section, we investigate the consequences of the introduction of different color centers in SiC nanocrystals.
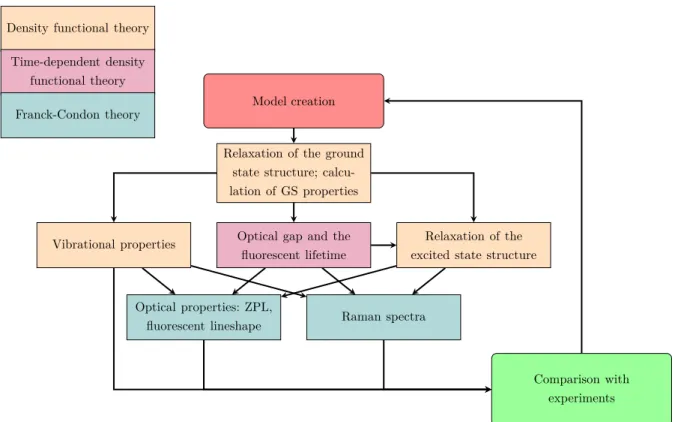
Models and methods
The geometry of the studied structures was optimized using the PBE functional [46] within density functional theory (DFT). It used the same method as for the ground state optimization, but set the non-Aufbau occupation numbers to constrain the electronic structure in the excited state. The occupation numbers were chosen to reflect the nature of the first excitation that was determined from the TDDFT calculations.
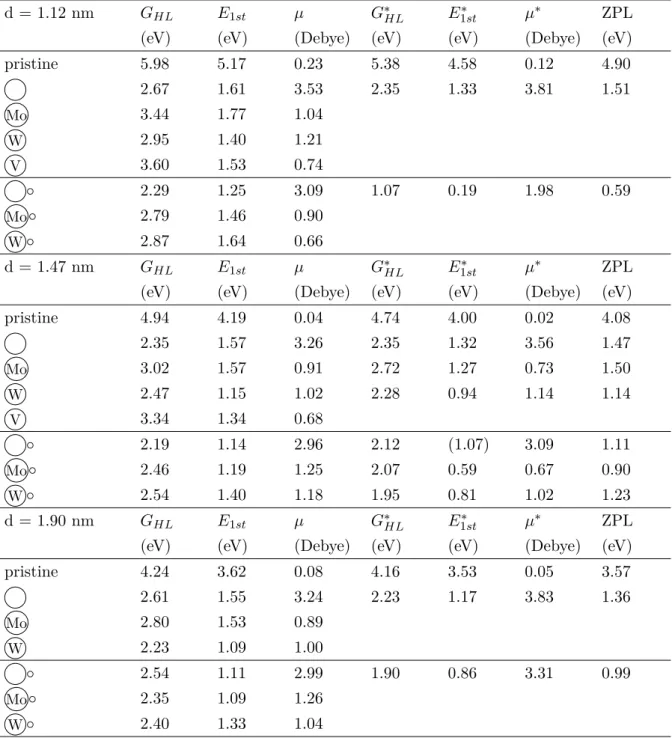
We performed relativistic scalar PBE calculations with the VASP code to calculate the spin-orbit coupling for defects, in particular, focusing our attention on the change in the calculated single particle gap (Δso) relative to that without spin-orbit coupling. Next, we estimated the potential error in the calculated lowest excitation energy due to the neglect of the spin-orbit coupling by ∆so. We performed benchmark calculations to assess the numerical accuracy of the localized basis set used in the TDDFT calculations.
We found that the Kohn–Sham orbital energies of the occupied orbitals and the lowest unoccupied orbitals are within 0.1 eV with both methods.
Results
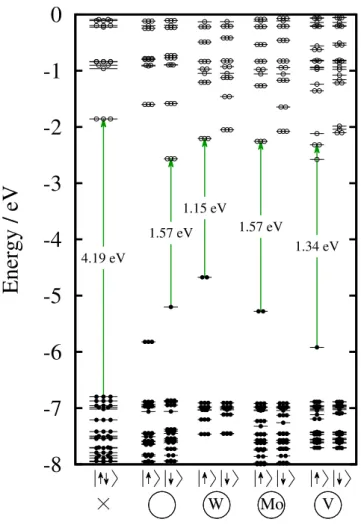
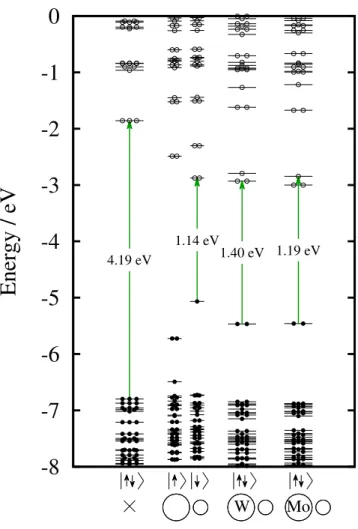
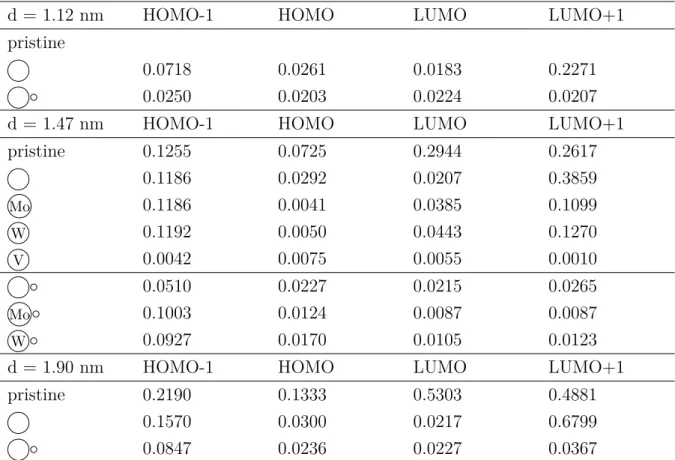
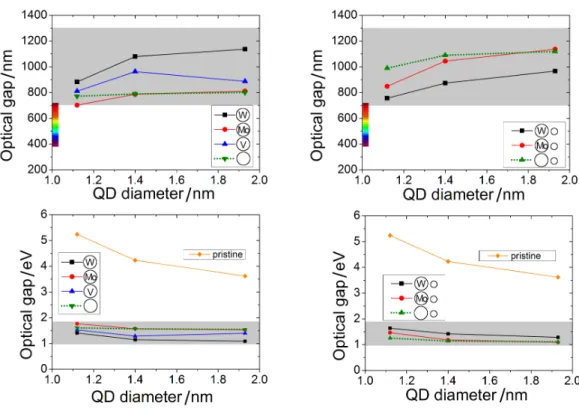
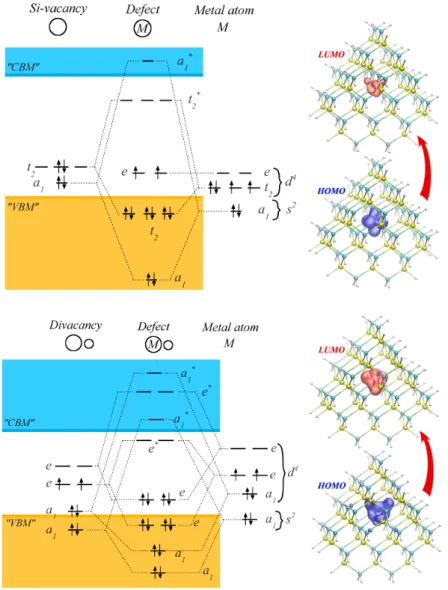
Note that the length of the arrows is not proportional to the excitation energies, since the strength of the electron–hole interaction varies for different point defects. In most cases, the first excitation occurs between the HOMO and LUMO states. Here we refer to our results on the localization of the HOMO and LUMO states.
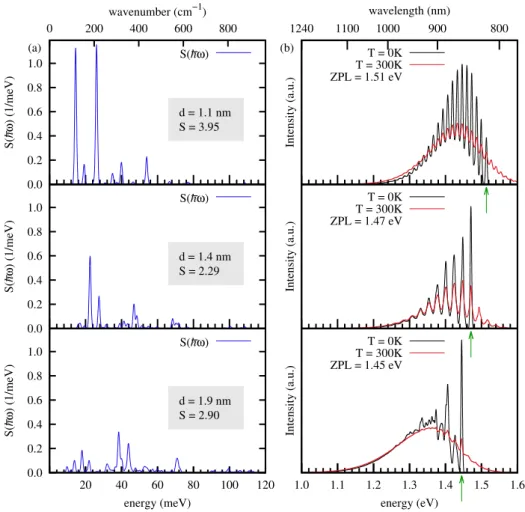
The y-axis has a different scale for each system, so the strength of the emission is not comparable. For the smallest model, the divacancy forms a large void compared to the size of the nanocrystal. The excited electrons of the defect-free nanocrystal decay very slowly due to the small overlap between the HOMO and LUMO.
Point defect mobility M◦ is expected to be higher due to the presence of a nearby vacancy.
Summary
Their samples exhibited a strong but rather broad emission band in the 850–1100 nm range, indicating potential for biological applications. In the previous section, we demonstrated that certain point defects introduced into SiC nanocrystals as bright color centers in the NIR region serve the possibility for in vivo biological applications. The biggest technological problem in the experimental realization of these systems is the introduction of point defects in the nanocrystals.
If we assume that the defects are randomly distributed in the larger crystal and do not show any significant clustering, we can give a rough approximation for the desired defect density depending on the average size of the nanocrystals: one defect per nanocrystal requires approximately n/N defect density where n is the average N-S defect density of atomic number 33C and n-S is the average number of 3C atoms. of nanocrystals. Using this approximation, we estimate a desired lower bound defect density at 1019 cm−3–1020 cm−3 for nanocrystals with diameters in the 2–5 nm range. In 2000, SiC nanopowder of particle diameters in the range of 20–30 nm was synthesized from hexamethyldisilazane by laser-induced gas phase reaction [105].
To summarize the available experimental results on the donor-acceptor doping of SiC, it was found that SiC can be heavily doped by B, N and Al up to concentrations in the range of 1%.
Models and methods
The introduced donor-acceptor pairs result in relatively sharp photoluminescence with quantum efficiencies of up to 90%. Our ultimate goal is to assess the viability of biological applications of SiC nanocrystals doped with donor-acceptor pairs. These calculations were performed using the Turbomole code using a basic Gaussian-type set with effective core potential to reduce computational costs.
A more comprehensive investigation of the PL line shapes and their dependence on the structural properties was not feasible since the calculation of the vibrational energies and eigenvectors is very demanding for large systems with low symmetry. The ground and excited state geometries were obtained from VASP(PBE) calculations using the standard DFT and. We used the finite-difference method to calculate the Hessian matrix to obtain accurate results for the low-energy vibrations that have been shown to contribute significantly to the emission line shapes.
Finally, we calculated the partial Huang-Rhys factors and obtained the emission line shapes using the generating function method described in Section 1.6.
Results
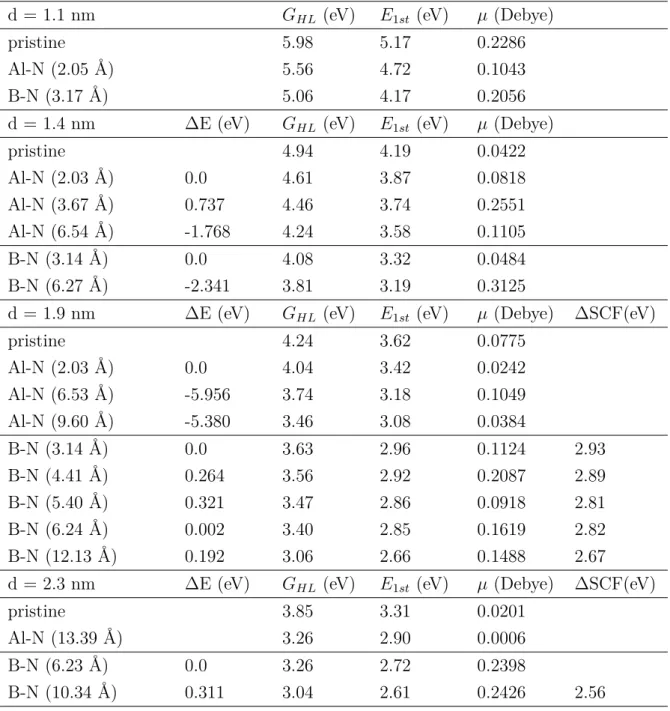
In some cases, we calculated the energy of the first excitation via the ∆SCF method. The green arrows indicate the first and last Kohn-Sham states for the first excitation. This exciton binding energy is expected to depend both on the size of the nanocrystal and on the donor–acceptor distance.
In Figure 3.4(a) and (b), we plotted the optical slit as a function of nanocrystal diameter and donor-acceptor separation, respectively. TDDFT spectra, but not in the total energies of the ground and charge transfer states. We again see that the peak of the PL spectra and the calculated vertical excitation energy (Table 3.4) almost coincide.
The green arrows below the energy axis indicate the position of the calculated ZPL values.
Summary
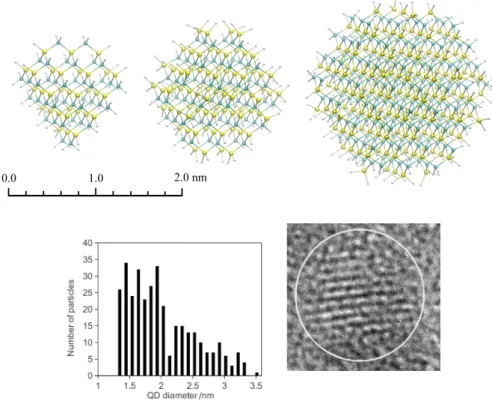
They found that the shape of the nanocrystals was almost spherical, with a Gaussian size distribution. Originally, the luminescence of SiC nanocrystals was fully attributed to the QCE [128], since the emission spectra of the colloidal samples depend on the excitation length. However, it quickly became clear that the emission properties of SiC nanocrystals cannot be attributed purely to the size of the particles.
This discrepancy suggested that the luminescent properties of SiC nanocrystals cannot be fully explained by QCE and made it clear that it is essential to understand the effect of surface chemistry. Aided by DFT calculations, they concluded that the green band is associated with OH groups that bind to the Si-terminated reconstructed (001) surface of SiC nanocrystals. Zakharkoet al. argued that as the surface charge of SiC nanocrystals becomes positive (cationic surfactant nanocrystals), the number of states in the band gap increases leading to stronger emission at lower energies.
The reason behind this is that the surface chemistry of SiC is very rich compared to other semiconductors, and the manufacturing process greatly influences the properties of the SiC nanocrystals.
Models and methods
80] and identified the important role of oxygen binding of the nanocrystal surface by TDDFT calculations [139, 140]. In short, much effort has been made to understand the surface chemistry of SiC nanocrystals, but we still don't have the full picture. Moreover, the measurements are performed on rather disparate ensembles, obscuring the correlation between the experimental findings and the properties of SiC nanocrystals.
Due to these circumstances, first-principles modeling of SiC nanocrystals can potentially provide invaluable insights toward understanding their surface chemistry. Before calculating the vibrational properties, the structures were further relaxed with a convergence threshold of 0.001 eV/Å to minimize the error arising from ground state geometry inaccuracies. In addition to the already demanding task of solving the Kohn-Sham equations for oxygenated systems, we found that finding the minimum of the potential energy surface is much more difficult for nanocrystals capped with organic groups compared to the hydrogenated case49.
The PDOS was calculated by projecting each Kohn–Sham orbital onto selected atoms using the standard Mulliken procedure [144] .
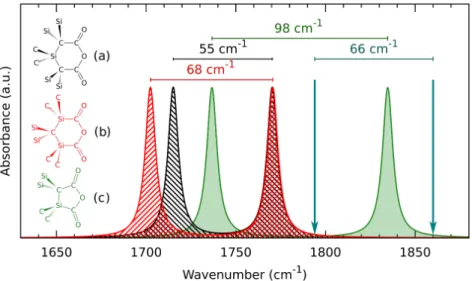
Anhydrid formation on the surface of SiC nanocrystals
This is the model that can be correlated with the BH-4 reduced sample of the experiments. On the other hand, the introduction of C-OH bonds results in a significant redshift of the optical slit. This change in the optical gap can be explained by the charge transfer between the Si-COOH groups and the rest of the nanocrystal.
Clearly, the Si-COOH-induced redshift of the optical gap can be explained by our simple charge transfer model. I determined the geometry relaxation upon excitation of the aforementioned point defects embedded in SiC nanocrystals. Finally, I performed several computational studies to gain a better understanding of the surface chemistry of SiC nanocrystals.
On the other hand, the local basis sets overestimate the energy of the unoccupied orbitals. This explains the change of the HOMO energy, as it is a defect state localized on the C-OH groups. The calculated ZPL is fairly close to the experimental one for the W defect, but overestimates the ZPL of Mo by 0.4 eV.