An extensive experimental research program is carried out for the determination of the bending resistance. Thanks also to the members of the Institute for Steel Construction of the RWTH Aachen University, especially to prof.
Background and motivation of the research
Solution strategy
EN is proposed, but an analytical solution is also developed, modifying the Ayton-Perry type formulation to provide more reliable flexural strength for HSS columns.
Flexural buckling of HSS columns
Numerical calculations showed that the bending resistance of welded box columns made of S460 steel material can be determined using the deflection curve b of the column. For hollow section columns with a nominal wall thickness of 2 mm, the use of the deflection curve c was suggested.
Residual stress of HSS members
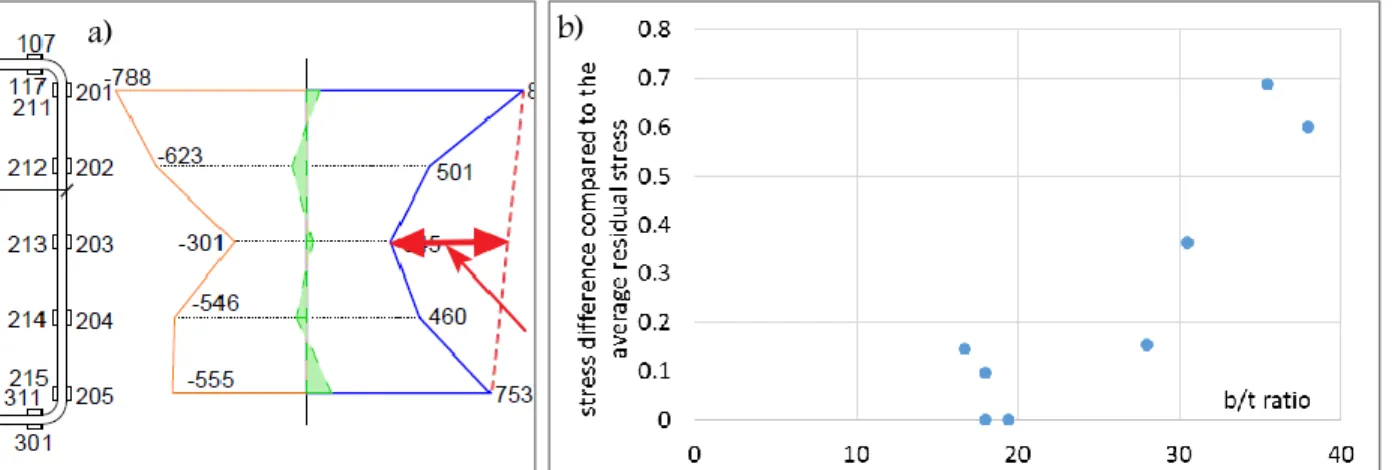
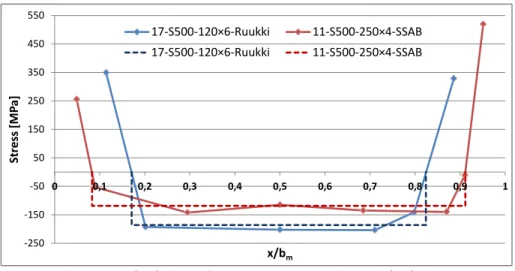
Several test results revealed that the maximum compressive residual stresses are strongly dependent on the b/t ratio of the investigated cross-section. On the other hand, test results showed that the residual stress distribution and the average bending residual stresses do not depend on the b/t ratio [37], but other test results showed a dependence on the b/t ratio [38] (increasing b/t ratio results in decreasing residual stresses).
![Fig. 1 - Residual stress models [31], [28].](https://thumb-eu.123doks.com/thumbv2/9dokorg/2497211.294209/18.918.97.743.190.457/fig-residual-stress-models.webp)
Summary of the literature and research aims
Introduction
Therefore, the current studies and conclusions focus only on the axial residual stress distribution of these product types. The literature review showed that the axial residual stress distribution on cold-formed steel sections depends significantly on the manufacturing process.
![Fig. 2 – Proposed residual stress model for indirect forming manufacturing methods [37]](https://thumb-eu.123doks.com/thumbv2/9dokorg/2497211.294209/19.918.143.826.765.1049/proposed-residual-stress-model-indirect-forming-manufacturing-methods.webp)
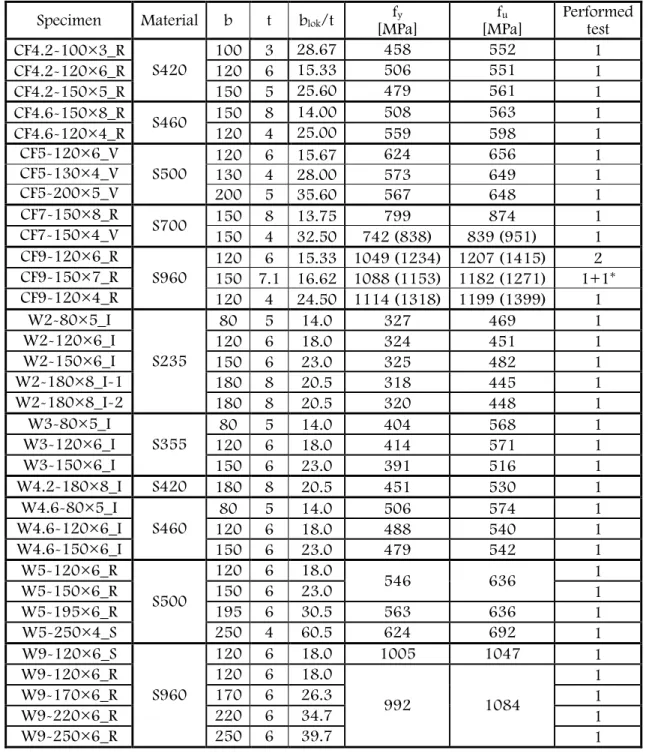
Investigated specimen geometries and materials
Therefore, the correct knowledge of the axial residual stress patterns is essential to analyze the bending buckling behavior of closed section columns. Within the framework of the current research program, a large number of residual stress measurements are carried out on welded and cold-formed test pieces with closed profiles.
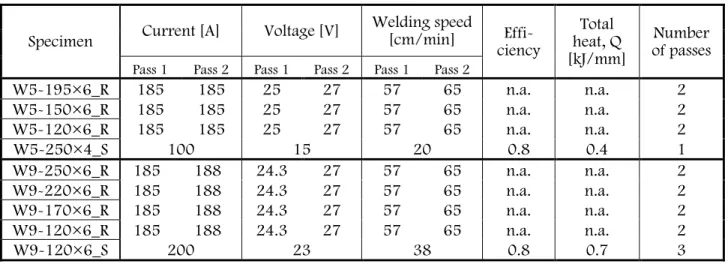
Manufacturing process of test specimens
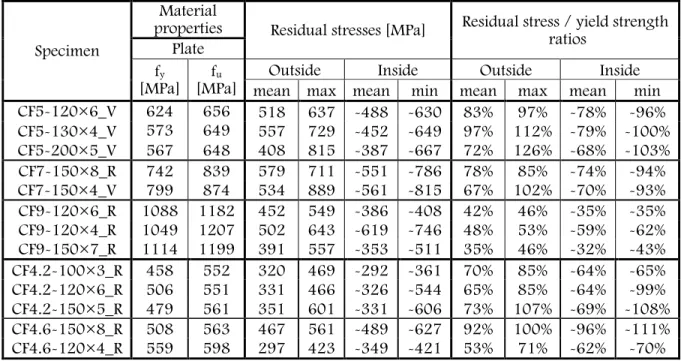
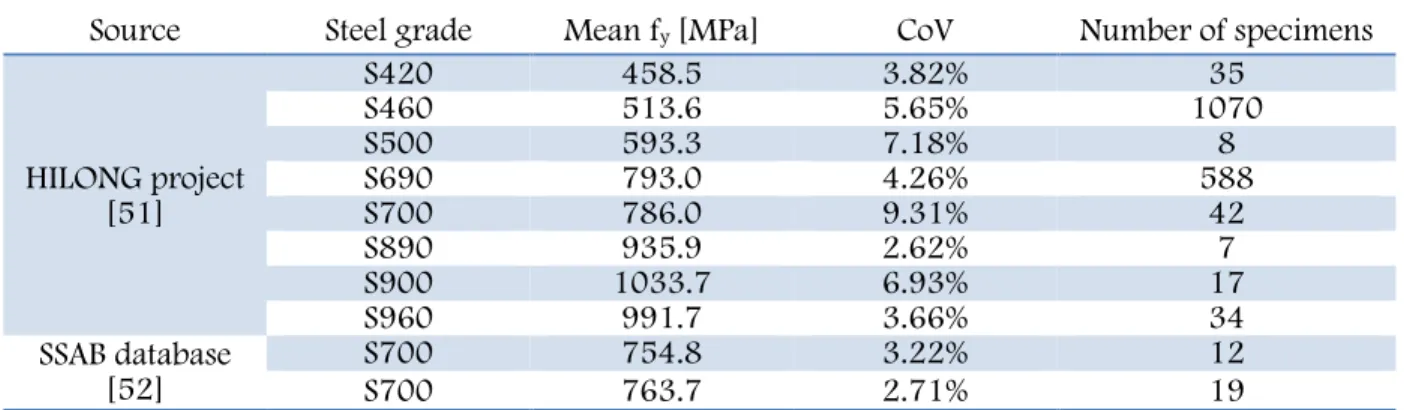
For four HSS cold-formed test pieces, the material properties in the corner zones were also determined and shown in brackets in Table 3.1. Based on the material tests, it was observed that for steels S235, S355, S420 and S460 a clear yield plateau exists in the stress-strain diagram, while the S500, S700 and S960 materials had no yield plateau, they behaved like common HSS materials.
Testing method
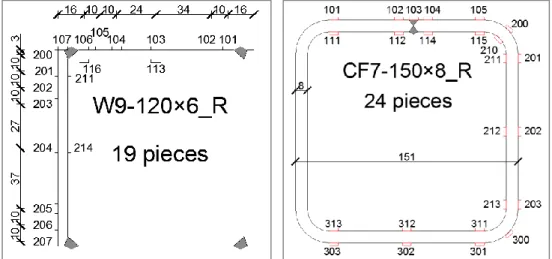
The distance between the cutting edge and the side of the strain gauges is about 1-2 mm (Fig. 7). The obtained values are considered as the residual stress at the location of the strain gauges.
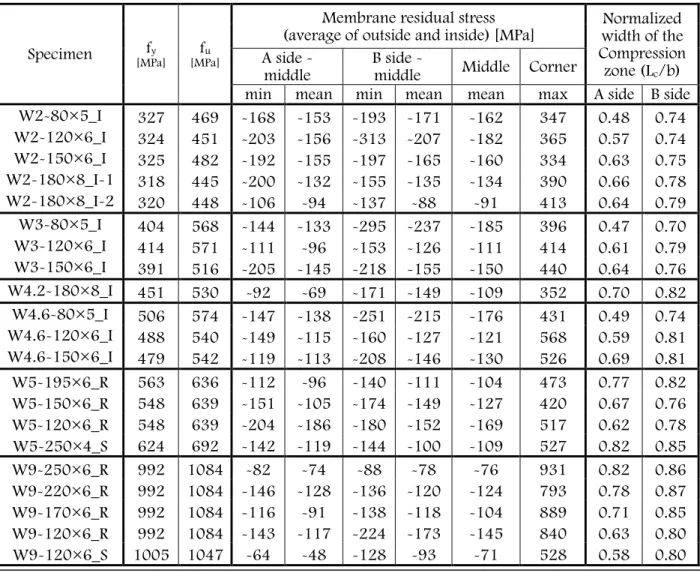
Results of the residual stress measurement on welded specimens
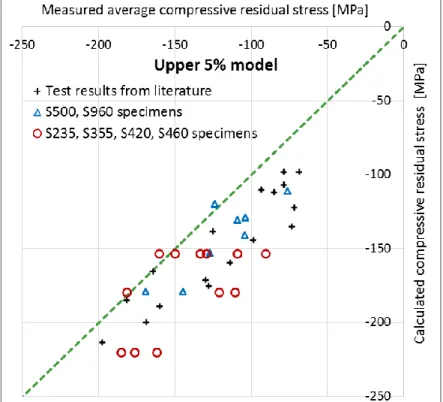
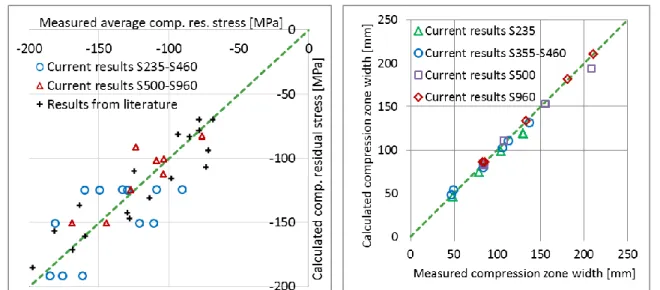
Based on the present test results, independent conclusions are drawn for (i) the maximum tensile residual stresses, (ii) the average compressive residual stresses and (iii) the width of the compressive zone. Extreme values of the residual stress pattern and the width of the compression zone may vary depending on the welding position.
Results of the residual stress measurement on cold-formed specimens
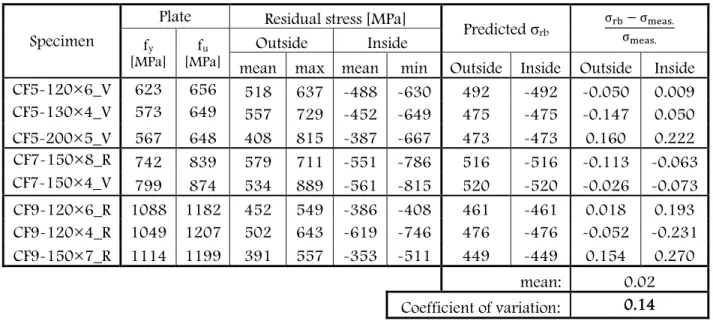
The measured residual stresses are evaluated together with previous results found in international literature as a function of b/t ratio and yield strength (fy). The results also prove the predominance of bending-type residual stresses in the analyzed sample.
Introduction
Investigated specimen geometries and materials
In the case of cold-formed specimens, this number refers to the type of specimen based on the nominal length.
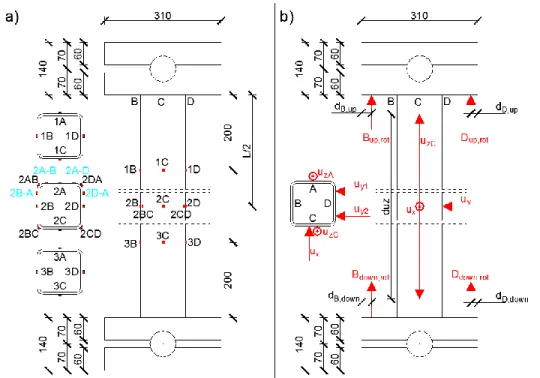
Strategy of the experiments and test setup
The rotation of the hinges is measured to ensure that they cannot provide a significant clamping effect during the tests. The strain gauges at the end of the samples are used to measure the applied.
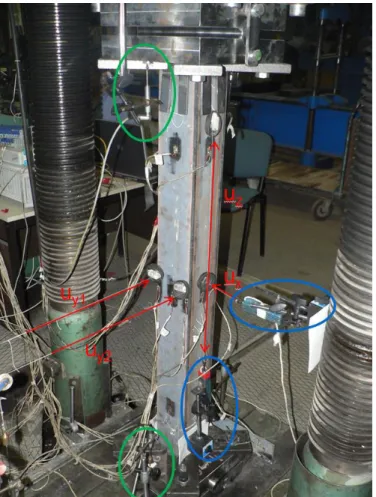
Geometric imperfection and loading eccentricity
In addition to the initial skewness of the test pieces, the load eccentricities are also measured during the tests. The total imperfections are calculated by the imperfections plus the average of the upper and lower end eccentricities.
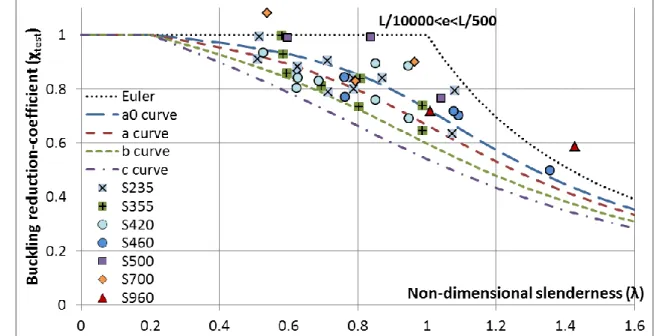
Flexural buckling resistances
In the case of the test results regarding S500 – S960, all the reduction factors are located over the column belly curve a. All the test results, even for these two cases, are about the column bending curve b according to EN.
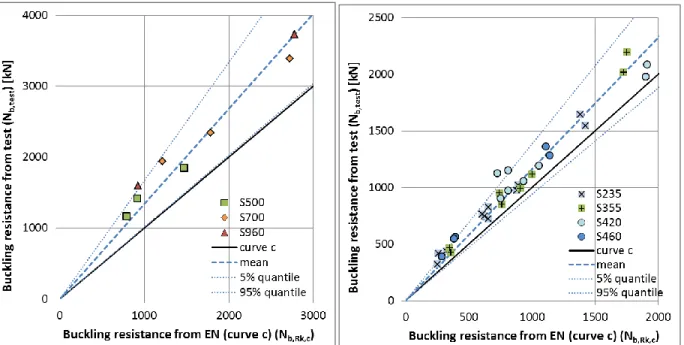
Statistical evaluation of measured resistances and buckling curve proposal
The determination of the predefined partial safety factor (γM*) is done according to the basic concept given in [46] and [47]. The results of the statistical evaluations are summarized in Table 4.5 – Table 4.7 for the buckling curve c, b and a respectively. The application of the buckling curve c is suitable for material grade S420, since γM1* equals 0.97.
Therefore, based on experiments, the bending curve b is applicable to S460 and higher grades of steel.
Introduction
Deterministic numerical modelling of welded sections
Without using residual stresses, the effect of the yield stress on the bending deflection resistance can be clearly studied. It is observed that the effect of the yield stress without residual stress is greatest if the global slenderness ratio is about 1.0. It can also be observed that the diminishing effect of the residual stresses is less in the case of the Ramberg-Osgood material models compared to the linear elastic hardening plastic material model.
Furthermore, the safety factors introduced in Section 4.6.1 are calculated based on the results of the numerical parametric study.
Deterministic numerical modelling of cold-formed sections
The amplitudes of the eigenmodes are scaled to the imperfection sizes to be used in the numerical simulations. However, the buckling strengths in the numerical model are on average approximately 6% lower than the test results. The basis of the study is the comparison of the buckling resistance based on the corresponding buckling curves in the global slenderness range of 0.2 – 2.0.
The alternative design method (αmod method) for high-strength steel [50] introduced in section 5.2.2.6 is evaluated based on the numerical results of the cold-formed samples.
![Fig. 57 – Meshing of studied cross-sections: a)100×10 b)120×6 c)150×6 Table 5.6: Applied mesh sizes of numerical model [mm]](https://thumb-eu.123doks.com/thumbv2/9dokorg/2497211.294209/77.918.197.762.508.882/meshing-studied-cross-sections-table-applied-sizes-numerical.webp)
Introduction
Applied variables
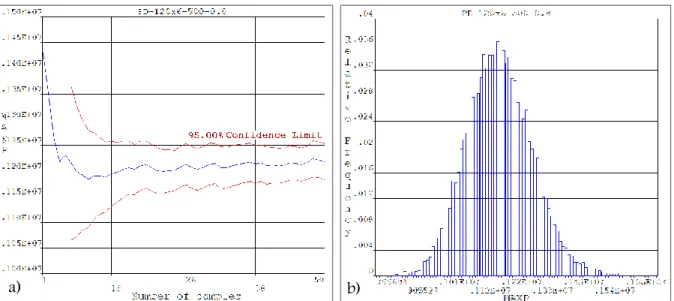
The different types of distributions are evaluated based on the Kolmogorov-Smirnov p-value. The proposed buckling curves based on the stochastic analysis support the results of the deterministic analysis and the experimental tests. This section presents the verification of the input parameters based on the detailed Monte Carlo simulation.
Stochastic numerical research program
Results of the stochastic numerical analysis on welded sections
The only difference compared to the original formulation is the consideration of residual stresses. The character of the residual stress agrees well with the results observed based on the deterministic numerical simulations presented in Section 5.2.2.3. The neutron diffraction method is based on the reflection of neutrons as they pass through a material.
Results of the stochastic numerical analysis on cold-formed sections
Introduction
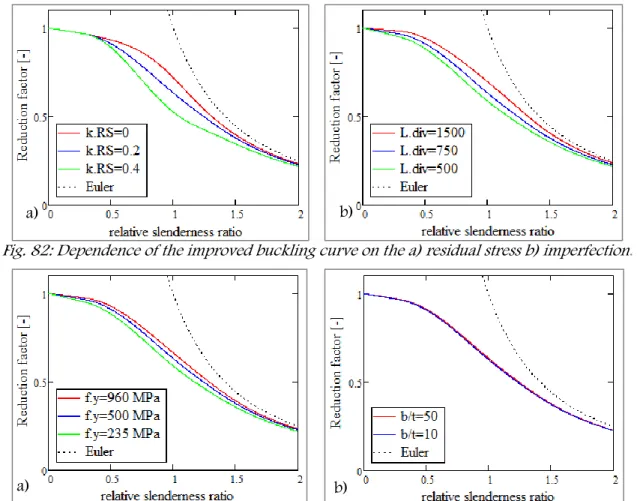
The current section provides an overview of the original Ayrton-Perry type formulation that is the basis of the currently used deflection curves. The improved column deflection curve can be applied to all types of welded box sections, knowing the magnitude of the compressive residual stresses and the yield strength of the material. The influencing parameters of the improved deflection curves are studied and evaluated in detail.
Based on the results of stochastic numerical analysis, the improved column deflection curve is calibrated for welded square box sections made of steel grades between S420 – S960.
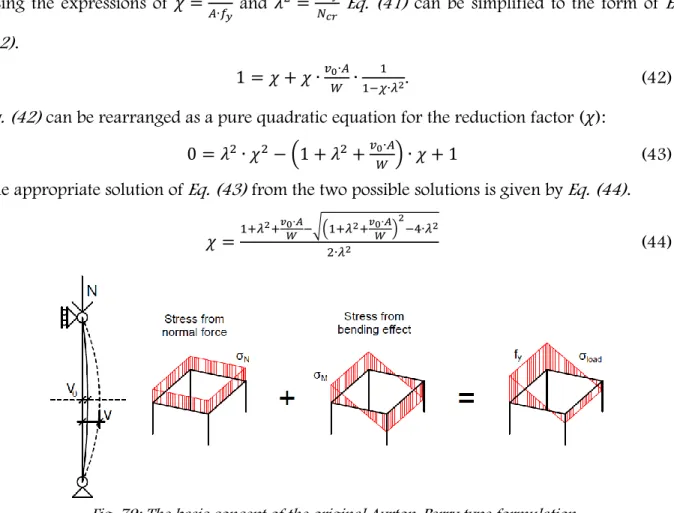
Overview of the original Ayrton-Perry type formulation
This chapter also introduces the concept of general imperfections currently used in EN 1993-1-1 and introduces an improved method that implements the effect of residual stresses and yield strength in analytically derived deflection curves. However, based on a validation procedure using experimental data, Rondal and Maquoi proposed a semi-empirical equation (Eq. 45)) for the value of the general imperfection. The generic problem of current bend-deflection curves based on the original Ayrton-Perry type formulation is that they account for initial geometric imperfection and residual stresses only through an empirically based general concept of imperfection that was derived and determined for NSS structures.
However, a calibration and validation process is also required to implement the residual stresses and geometric imperfection in the analytical solution.
Improved Ayrton-Perry type formulation for welded sections
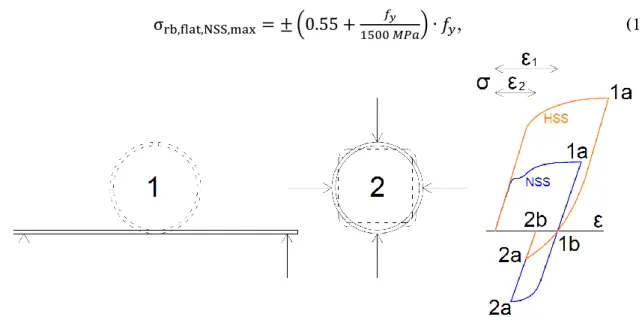
This is the same for both solutions (type "A" and "B") depending only on the thinness of the column. In the case of the 'B' type model, Eqs. 58)-(60) show the verified 𝐿𝑑𝑖𝑣, which depends on the thinness and the yield strength. Based on the test results, the shape and intensity of the measured residual stresses are evaluated and residual stress models are developed for both types of sections.
A theoretical investigation of column behavior of cold-formed square hollow section thin-walled structures. Numerous measurements made on the compressive part of the samples show that the distribution of residual compressive stresses is almost uniform. 146 shows that in the case of small thinness (λ≤0.45) the residual stress has no practical effect on the bending resistance due to the fully plastic behavior.
Calibration of the improved buckling curve for welded square box sections
Summary and conclusions
An extensive experimental program is conducted to determine the flexural strength of welded and cold-formed HSS columns. I proved that the maximum residual tensile stress in welded sections can reach the yield strength value regardless of the steel grade. In the case of specimens made of steel materials S355, S420 and S460, the calculated residual tensile stresses are close to the yield strength.
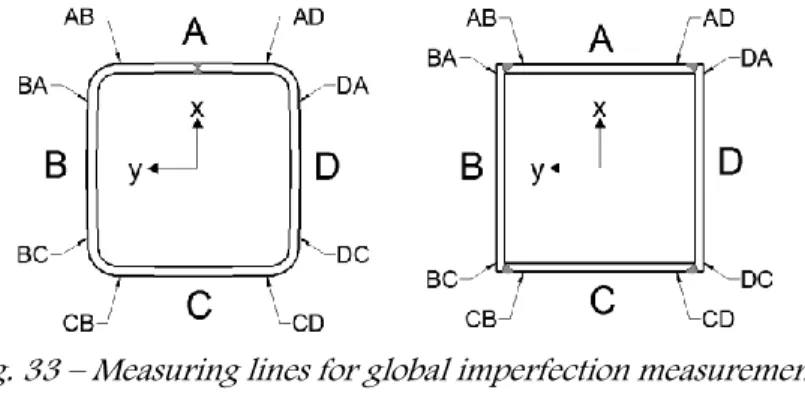
The definition of the different widths and the lateral numbering of the specimens are shown in Fig. The final imperfection measurement results for the 54 HSS specimens are shown in Figs. In the case of high fineness (λ>1.4) the influence of the imperfection decreases with the increase of fineness stress, it depends on the drop.
Proposal for further studies
Theses
Based on the experiments, I developed two improved residual stress models for the types of sections studied separately, which models are applicable to steel grades S235 - S960. I experimentally investigated the buckling behavior of welded square box and cold-formed square hollow section columns. I numerically investigated the buckling behavior of welded square box and cold-formed square hollow section columns using deterministic and stochastic numerical modeling.
Based on the statistical evaluation of the obtained distribution functions, applicable column bending curves are proposed. e) I proved that HSS square section columns can also be designed according to the design process of EN 1993-1-1 using a modified imperfection parameter (α).
Relevant publications
After this, the released residual stresses can be calculated by changing the diameter and depth of the reference bore. Using the two data, it is possible to determine the residual stresses in the transverse and axial directions of the reference bore. Thus, imperfection scattering does not result in significant scattering of buckling resistance in the case of columns with low or very high slenderness.
144 shows that the material quality has practically no influence on the correlation coefficient for the yield stress, the cross-sectional width and the plate thickness. The results show that in the case of high slenderness (λ>1.4), the resistance-reducing effect of the geometric imperfection and residual stress is less significant in the case of high steel grades (S700, S960), this results in a more favorable buckling behavior in the case of high steel grades than in the case of lower steel grades (S500 and lower steel grades). Thus, the spread of the imperfection does not result in significant spread in the buckling resistance in the case of columns with low or very high.