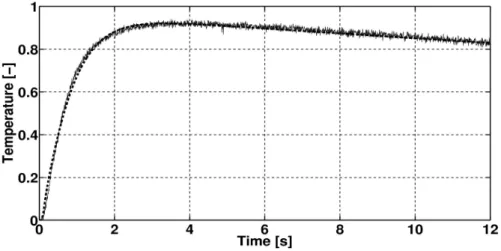
In this work, we demonstrate the simplicity, universality and constructive property of the theory in the example of an effective description of non-Fourier heat conduction. As we will see, the inhomogeneity of the structure leads to deviation from Fourier's law.
Physics behind the generalization
Derivation of the ballistic-conductive model
Then one can calculate the entropy production using the following Gibbs relation for partial derivatives of the entropy density:. For further analysis, it is important to prove that the system (2.22) is hyperbolic and to calculate the characteristic propagation velocity of the system.
Lower order models
Maxwell–Cattaneo–Vernotte equation (MCV): This model is the simplest extension of Fourier's law and at very low temperature – in the order of 10 K – it can model the phenomenon of second sound, i.e. A further interesting feature is that in reversible case – when entropy production is zero – it can produce heat propagation when the Ji = qTi classical formula for the entropy flux is used.
![Figure 2.1: A typical solution for Fourier equation [3].](https://thumb-eu.123doks.com/thumbv2/9dokorg/2498515.294525/17.892.255.673.199.556/figure-typical-solution-fourier-equation.webp)
Relation to the kinetic theory
Heat conduction in the framework of kinetic theory
The phase density f develops according to the Boltzmann equation. where ˆS is the product of phase density, the so-called collision integral. The first momentum is the energy density, the second is the momentum density, the third is the energy flux and the fourth is the deviatoric part of the pressure tensor [19], i.e. 2.59).
Generalization of classical fluid mechanics
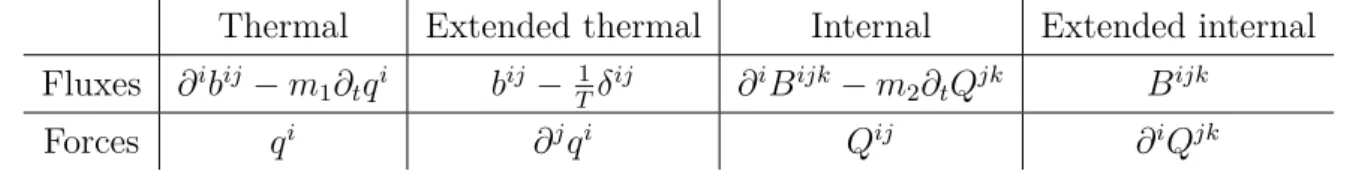
In Meixner's theory, there is an internal variable in tensorial order and this does not lead to a generalization of the heat conduction equation. Furthermore, the variable choice for entropy density determines the separation of the thermodynamic fluxes and forces later.
Environment of the solution method
Dimensionless formulation
The thermodynamic non-equilibrium theory (2.89) should be further analyzed with respect to experiments, but this is not the goal of this thesis. where α is the thermal diffusivity, tp is the length of the heat pulse, Tend is the maximum or equilibrium temperature value in the adiabatic case, ¯q is the mean value of the heat pulse [2, 3]. In addition, the following dimensionless parameters are introduced accordingly. where ˆτ∆ is the dimensionless pulse length, ˆτq and ˆτQ are the dimensionless relaxation times and ˆκ is the dimensionless square root of the dissipation parameter [2, 3].
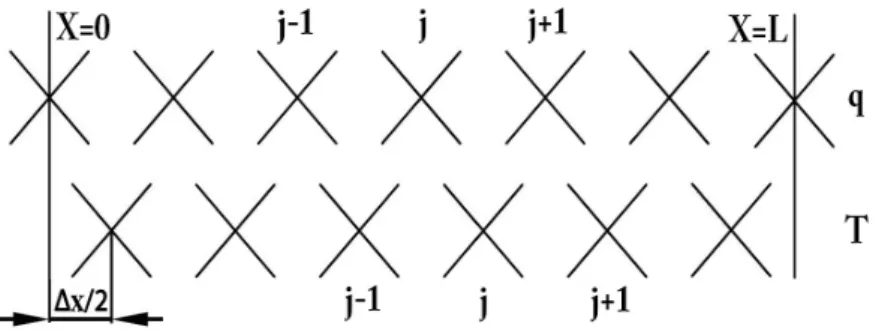
Numerical method
Existence and uniqueness analysis for the ballistic-conductive system is still an open problem. The experimental setup is the same as shown on the left.
Analysis of NaF experiments
- Theory versus experiments
- A complete reproduction of NaF experiments
- Comparison with the RET model
- Comparison with the hybrid phonon gas model
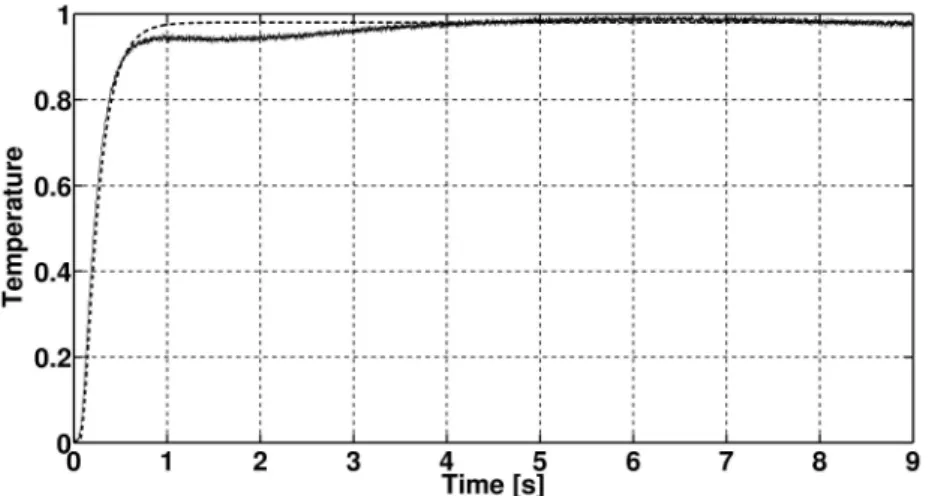
As mentioned, the presence of the ballistic signal strongly depends on the boundary conditions. Moreover, according to the experimental setup in [149], the sample is cube-like and the heat excitation only affects the middle part of the front face. By applying adiabatic boundary conditions to the back side of the sample, the temperature development at the back side according to the ballistic-conducting model (2.93) can be seen in Fig.
This assumption is a special realization of cooling at the back of the finite sample. The structure of the equations is not the same and the uncertainty in the boundary conditions also seems to be an important factor. The path length corresponds to the length of the crystal in the direction of the heat pulse.
In the case of sample #607167J, there is a broadening effect between the ballistic signal and the second sonic peak along increasing temperature. The tendency of the temperature dependence of the set parameters are exactly opposite in both cases, see Fig.
![Figure 3.2: The temperature dependence of the propagation speed of second sound in He II [128].](https://thumb-eu.123doks.com/thumbv2/9dokorg/2498515.294525/41.892.261.667.151.525/figure-temperature-dependence-propagation-speed-second-sound-ii.webp)
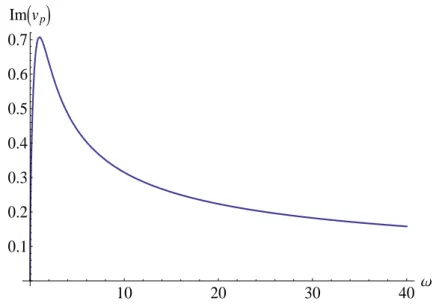
Dispersion relations
Window condition
Different theories can predict and explain the presence of the second sound, but their parameters and values depend in different ways on the particular details of the detection. Moreover, when κ 1, approximates the MCV equation (Fig. 3.21) and in the limit, κ= 0, the dispersion relation of the GK equation reduces to the MCV equation. Our internal two-variable model with generalized entropy current was found to be compatible with the RET hierarchy and comparable in quantitative reproduction of the famous NaF experiment.
In low-temperature heat conduction, the deviation from Fourier's law was due to the presence of non-negligible terms of higher order in the momentum hierarchy. This is usually attributed to gas rarefaction (large mean free path and Knudsen number) or, in the case of phonon hydrodynamics, to different phonon propagation channels (see the two relaxation times in the Callaway collision integral). First, the development of the experiments is presented to present a physical interpretation of the deviations, followed by a discussion of the theoretical background.
The case of organic materials with its experimental background is discussed in the next chapter, it belongs to biological heat conduction despite the applied temperature range. As shown in the chapter on biological heat conduction, most of the researchers use the MCV or the DPL-type expansions of Fourier's law with more or less success. a) Experimental setup (b) Results of the experiment.
Experimental background
- Book experiment
- EGR-capacitor experiment
- Physical interpretation
- Finite element modeling of the EGR-capacitor experiment
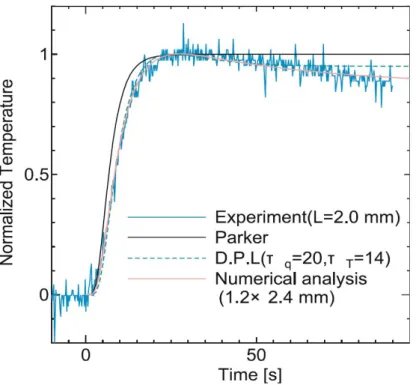
The result of the second experiment and the fitting of the nonlinear Fourier equation and the Guyer-Krumhans equation can be seen in the figure. Flash light is the source of the thermal pulse at the front end of the sample, and the temperature is measured by a pin thermocouple (type K) at the rear end. This photovoltaic detector is also used to measure the shape of the thermal pulse (Figure 4.9).
The role of the boundary condition is shown here, the length of the heat pulse determines the second time scale. The stratified sample of the EGR condenser experiment may be a way to look for a more detailed explanation. The thermal conductivity of the better conductor was a parameter and adjusted in the range from 10 to 250 mKW.
It is important whether the outer or inner layer is the better conductor, so two different series of results are shown according to the position of the better conducting layer. 4.18(c) presents the fit of the GK equation for a 5-layer model with parameters in the MCV domain.
![Figure 4.5: The schematic arrangement of book experiment, taken from [180].](https://thumb-eu.123doks.com/thumbv2/9dokorg/2498515.294525/66.892.215.637.441.722/figure-schematic-arrangement-book-experiment-taken.webp)
Rock samples
Some of the measurements show a falling, cooling tail for the temperature, which is why two additional adaptation parameters have been introduced in the evaluation. The real heat transfer coefficient cannot be calculated because the density and specific heat of the sample are unknown. The second parameter introduces the temperature scale, it is the ratio between the asymptotic temperature and the maximum point of the measured temperature curve.
It is necessary because an unknown amount of energy is released into the environment during the measurement. In principle, a detailed analysis of the structural components could help to understand the origin of the observed deviations. It is clear that an effective model can be useful in measuring thermal diffusivity and in transient processes where thermomechanical effects play an important role.
The case of Kantavár limestone is remarkable because of the corresponding model of finite element analysis. a) Measurement results and Fourier fit of Boda red siltstone (b) Measurement results and GK fit of Boda red siltstone. Date of the experiment is indicated after the name of sample (format: dd/mm); all were made in 2016.
Metal foam samples
In the previous chapters, the existence of non-Fourier effects was demonstrated in the case of inorganic materials. Although these are the most important type of material for practical engineering applications, the role of theoretical predictions of thermal conductivity in organic materials is increasing with biological applications. It should be noted that the thickness of the sample is 8 mm, but the authors did not mention which thickness corresponds to the curves in Fig.
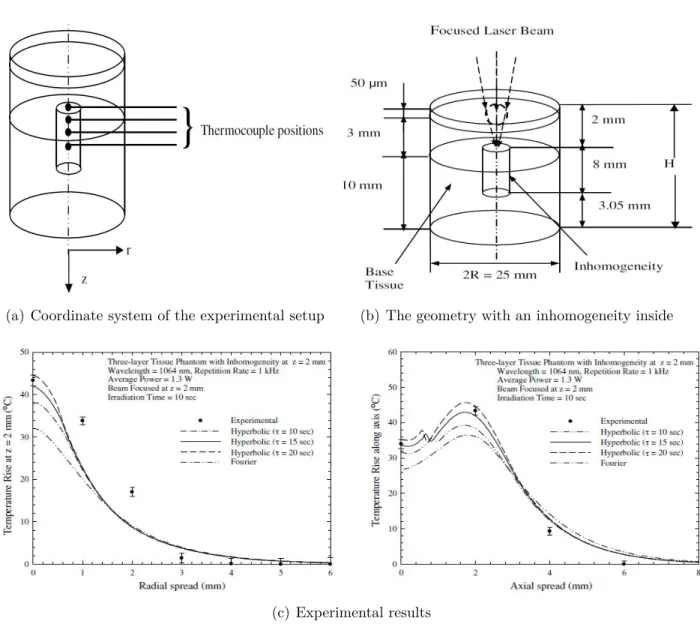
The series of experiments by Dhar et al. in transparent tissues should also be mentioned here [192]. The scheme of the experimental arrangement is practically the same as in Fig. 5.2 shows the history of temperature versus subsurface depth. In the field of biological heat conduction, there seems to be a lack of suitable models for reproducing experiments.
The next section presents the most used models, moreover, analyze them from the point of non-Fourier heat conduction. 1 The rest is devoted to the presentation of models of heat conduction in biology. a) Coordinate system of experimental setup (b) Experiment results.
Heat conduction in biological materials
- Pennes’ model
- Chen-Holmes (CH) model
- Weinbaum-Jiji-Lemons (WJL) and Weinbaum-Jiji (WJ) models
- Wulff model
- Klinger model
- Small artery model (SAM)
- Simplified thermo-regulatory bioheat model (STB)
- DPL model revisited
This requires detailed description of the anatomy, the precise knowledge about the blood flow field, in addition to the accurate modeling of the vascular system [200]. The blood perfusion term differs from the Pennes' model, here W is the perfusion rate and Tart represents the upstream blood temperature in the arteriole instead of the body core temperature. TartandTv is the bulk average temperature inside the blood vessel and s stands for the unit normal vector of the blood vessel surface.
However, this expression means that the material behavior of the tissue – the constitutive equation – depends on the blood flow which is physically questionable from the point of view of objectivity. One of the main conclusions of Wulff's paper that the blood flow only slightly affects the temperature distribution in the tissue. The last fractional term means the temperature difference between the sides of the control volume and it is considered only in direction z which is parallel to the artery.
Hensen emphasizes the importance of the comfort models and environmental conditions due to their significant impact on the body core temperature [216]. G is the so-called lumpy convection-perfusion parameter, it depends on the vascular diameter, heat transfer coefficient and the perfusion rate of the blood.
Experiment revisited
The other biologically inspired theories are not suitable for modeling fast transient phenomena or non-Fourier effects in heat conduction. In the field of biological heat conduction, there is a need for an effective and universal model with a strong physical basis. This is the most important aspect of our theory of heat conduction from local equilibrium.
I used one vector and one second-order tensor internal variable together with a generalized entropy flux with Nyíri multipliers in the framework of non-equilibrium thermodynamics to derive a ballistic-conductive model of heat transfer. I compared this theory of non-equilibrium thermodynamics with the kinetic theory based on rational extended thermodynamics in the case of heat conduction in solids and rare gases in 1+1 dimensions. Nonequilibrium thermodynamic theory does not rule out non-Fourier heat conduction under different, more common conditions, e.g.
Finite element approaches to nonclassical heat conduction in solids. Computer Modeling in Engineering and Science. Experimental evidence on the Fourier or non-Fourier heat conduction controversy in materials with a non-homogeneous inner structure.
![Figure 3.3: The temperature dependence of the propagation speed of second sound in He II based on [130].](https://thumb-eu.123doks.com/thumbv2/9dokorg/2498515.294525/41.892.281.661.679.1060/figure-temperature-dependence-propagation-speed-second-sound-based.webp)
![Figure 3.4: The arrangement of the heat pulse experiments [149].](https://thumb-eu.123doks.com/thumbv2/9dokorg/2498515.294525/42.892.233.619.105.444/figure-arrangement-heat-pulse-experiments.webp)
![Figure 3.6: Temperature and purity dependence of the NaF crystals, Fig 3 of [148]. The purity is decreasing from A to E.](https://thumb-eu.123doks.com/thumbv2/9dokorg/2498515.294525/43.892.326.605.672.1012/figure-temperature-purity-dependence-naf-crystals-purity-decreasing.webp)
![Figure 3.5: Original results of NaF experiments: the right one was published in [147] and the left one in [148]](https://thumb-eu.123doks.com/thumbv2/9dokorg/2498515.294525/43.892.304.638.107.561/figure-original-results-naf-experiments-right-published-left.webp)
![Figure 3.7: NaF experiment: result of the Dreyer–Struchtrup, Figure 5.1/b in [101].](https://thumb-eu.123doks.com/thumbv2/9dokorg/2498515.294525/45.892.212.720.176.478/figure-naf-experiment-result-dreyer-struchtrup-figure-b.webp)
![Figure 3.8: NaF experiment: reproduction of the Dreyer–Struchtrup model, Figure 5.1/b in [101] (here Fig](https://thumb-eu.123doks.com/thumbv2/9dokorg/2498515.294525/46.892.203.642.108.401/figure-naf-experiment-reproduction-dreyer-struchtrup-model-figure.webp)
![Figure 3.10: Measurement results on four different NaF samples. This figure is the page 103 in [149]](https://thumb-eu.123doks.com/thumbv2/9dokorg/2498515.294525/48.892.218.636.98.656/figure-measurement-results-different-naf-samples-figure-page.webp)
![Figure 3.12: NaF experiment: combination of the original figure [148] and the simulation (Fig](https://thumb-eu.123doks.com/thumbv2/9dokorg/2498515.294525/49.892.343.578.102.522/figure-naf-experiment-combination-original-figure-simulation-fig.webp)
![Figure 3.17: Summarized result of the simulations from phonon hydrodynamic model with three momentum equations [19]](https://thumb-eu.123doks.com/thumbv2/9dokorg/2498515.294525/56.1262.80.1188.130.684/figure-summarized-result-simulations-phonon-hydrodynamic-momentum-equations.webp)
