All data and reports used in the thesis can be found in the Building Physics Laboratory's archives. The results presented in this PhD thesis can help architects, engineers and masonry design professionals with a deeper understanding of the hygrothermal behavior of thermal insulation filled modern masonry blocks and their performance limitations.
INTRODUCTION
Motivation
The current mandatory level of energy performance is called "cost-optimized" in Hungary and is made according to the revised EPBD based on the calculation of the optimal cost of some typical Hungarian residential and non-residential buildings [16], [17]. Therefore, it is useful to define equivalent values that can be used in simplified calculations.
Research questions
The main objective of my research is to better understand the thermal and hygrothermal behavior of modern masonry blocks filled with thermal insulation. How much will the thermal conductivity of a building construction with filled masonry blocks change if we consider hygrothermal analysis instead of thermal simulations.
Research plan
MATERIALS AND METHODS
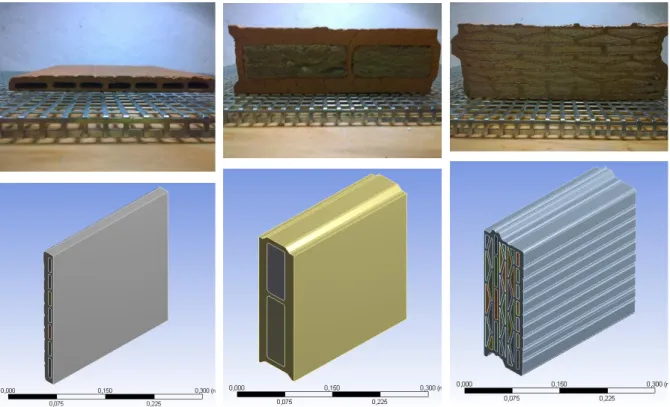
Materials of modern masonry structures
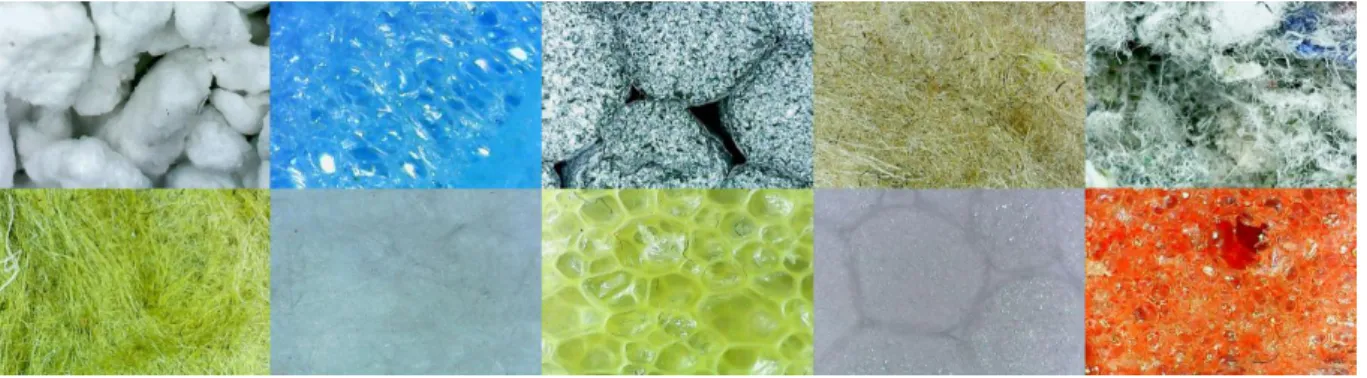
4 shows some thermal insulations under the microscope, illustrating the diversity of the structures of thermal insulation materials. When considering masonry walls made of modern thermal insulation filled clay building blocks, the application of plaster on both sides of the wall is essential.
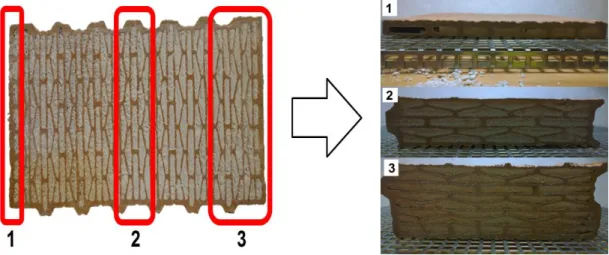
Hygrothermal laboratory experiments
Choosing the right exterior plaster is important for protecting the wall from rain and frost. In my research, 2 cm thick expanded perlite insulation plaster and fiber-reinforced insulation plaster was applied to the outer side of the masonry blocks, while 1.5 cm gypsum plaster was applied to the inner side.
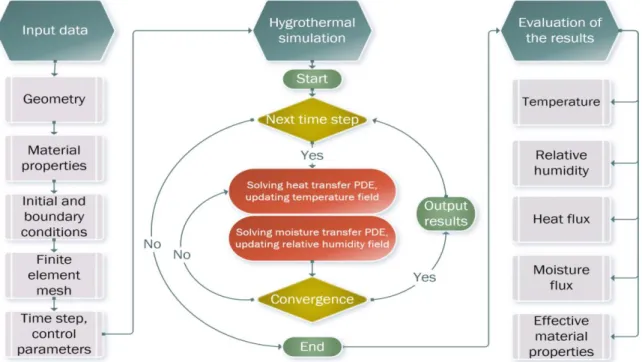
Numerical methods
Thermal transmittance (U-value [W/m2K]) shows how much heat, 𝑄 [W=J/s], can flow through a 𝐴 =1 m2 internal surface of the building element in case of ∆𝑇 = 1 K temperature difference as defined by Eq. In their approach, they also evaluated the number of freeze-thaw cycles in the section of the structures.
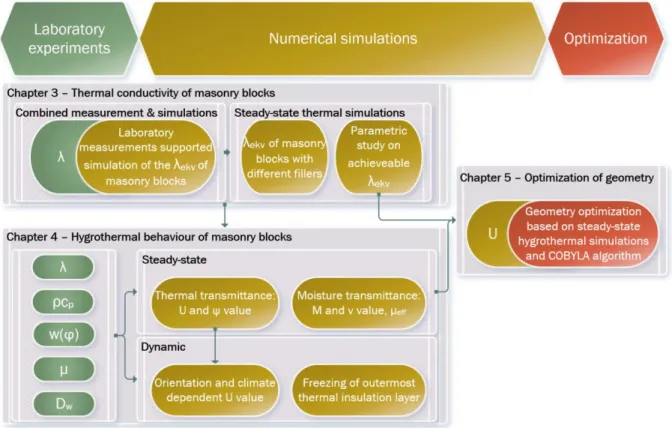
EQUIVALENT THERMAL CONDUCTIVITY OF MASONRY BLOCKS
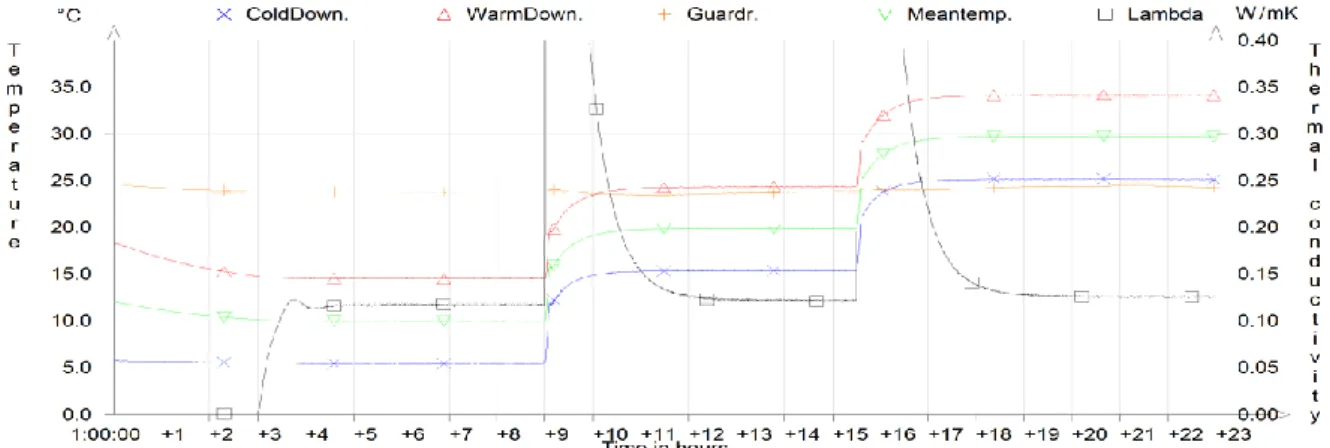
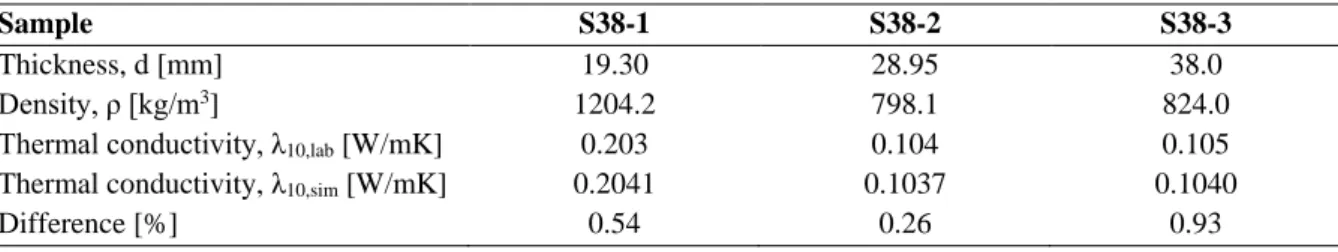
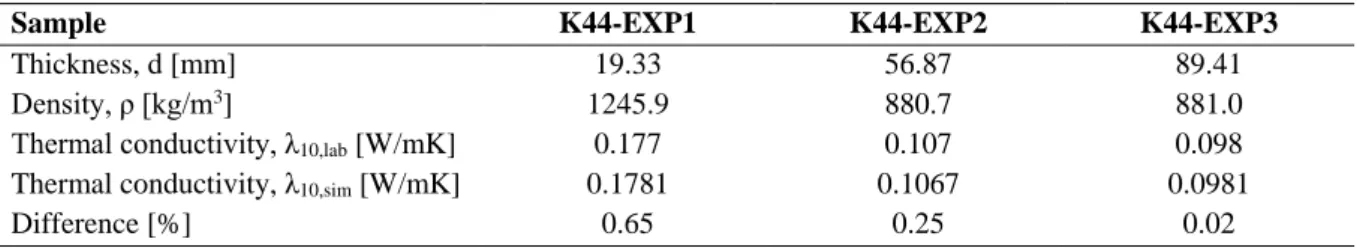
- Simulation methodology supported by laboratory measurements
- Validation of a measured masonry block section
- Thermal conductivity considering different fillers
- Parametric study on material properties
- Conclusions
It facilitates the process if the range of thermal conductivity of materials is known, e.g. This parametric study showed the achievable thermal conductivity of the investigated masonry blocks and its limitations.
HYGROTHERMAL PERFORMANCE OF MASONRY CONSTRUCTIONS
Input data
Hourly external and internal temperature and relative humidity values and its variations of the three analyzed cities are shown by Figs. Since the internal temperatures were calculated on the basis of the external, these similarities also occur in the internal conditions.
![Fig. 48 Heat flux magnitudes [W/m 2 ] in a MW filled masonry wall corner by simplified geometry](https://thumb-eu.123doks.com/thumbv2/9dokorg/2498779.294582/47.892.483.744.103.275/fig-heat-magnitudes-filled-masonry-corner-simplified-geometry.webp)
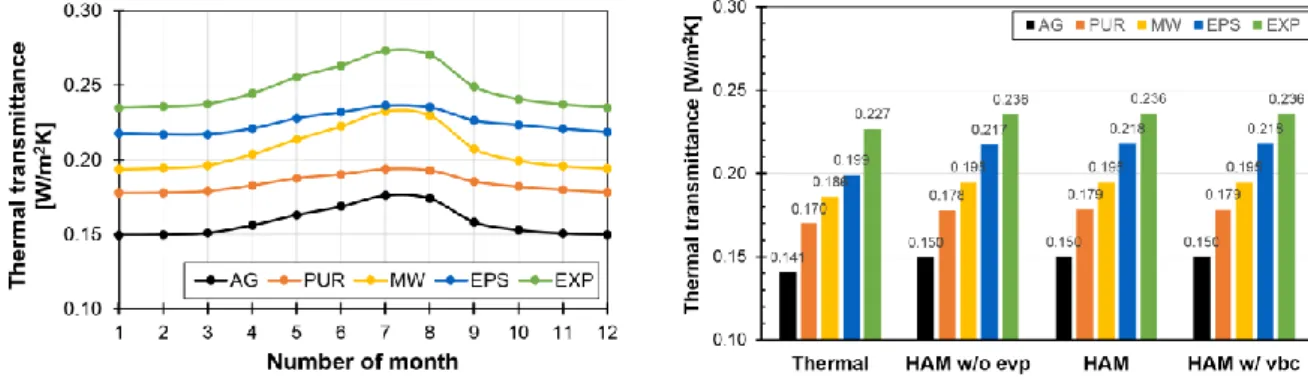
Thermal transmittance
It is observable that neglecting heat transfer in the heating season results in 3.9% to 8.7% lower values. The neglect of moisture transmission therefore leads to the thermal permeability of the tested building constructions being underestimated. Based on the wall corner joint model, the average thermal transmission of the corner and the linear thermal transmissions were simulated.
When comparing the results with the results of the wall model, it can be seen that the average thermal conductivity of the wall corners is higher, which is obviously due to geometric thermal bridges. In July, the heat losses of the wall corner made of PUR filled blocks increased less. As for the conclusion regarding the linear thermal conductivity of bricks, we can say that there are significant differences between the values of blocks made with different fillers; the values of 𝜓 are rather small: in the heating season, it is below 0.1 W/mK for both alternatives.
Moisture transmittance
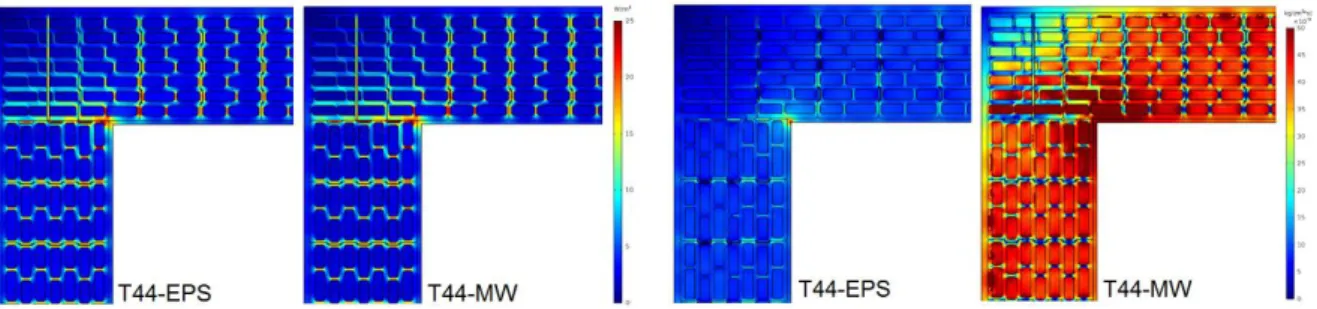
After performing the simulations, heat flux magnitudes in the horizontal cross-sections of the investigated constructions are visualized in fig. The difference is 5.5% for MW and 10% when we compare walls made of EPS filled masonry blocks. Visualization of the moisture flux sizes in the horizontal cross-section of the investigated constructions immediately shows the differences, see fig.
However, in the case of EPS filled blocks, the equivalent μT44-EPS is more than 3 times the wet cup value. Furthermore, it can be observed that, in the case of linear moisture transmissions, its trends and differences are completely different from those obtained by analyzing linear thermal transmissions of the compared constructions. However, if the permeability of the filler is lower, resistance is therefore higher, using the values of burnt clay as a substitute leads to miscalculations in the heating season.
Environmental dependence of the U value of walls
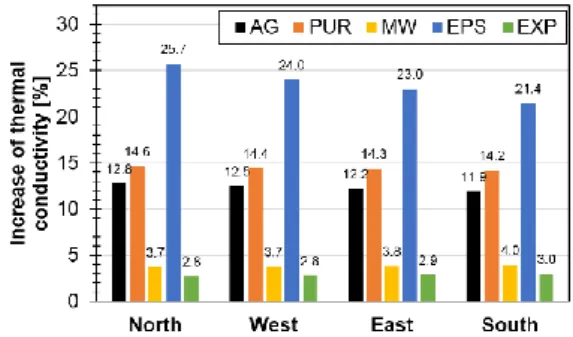
In this study, we show that the average temperature during the heating season in the southeast-oriented MW layer of ETICS was 12.5 °C, which is very similar to the temperature now occurring in the insulation layers inside the wall structure. After explaining the monthly results, we can move to the annual and heating seasonal average values of U, which are shown in the figure. However, differently oriented facades show larger differences, the dynamic simulated average U-value in the north-facing heating season can vary by up to 16.9% compared to the steady state.
100 shows the differences between U values obtained by dynamic HAM simulations and steady-state thermal simulations averaged over the heating season. These two figures show similarities in the heating season in Budapest and Espoo, as the differences remain below 5.6% and in some cases, Budapest U-values are up to 3.3% higher. However, there are only small differences between the values in the heating season in Espoo and Budapest, but there are significantly large differences that occur between Lisbon and Budapest.
Number of freeze-thaw cycles in the outermost insulation layer of walls
107, in the outermost insulating layer of the block, the relative humidity reaches 100% between December and February and steam condensation occurs. However, the temperature and humidity dependent behavior of the materials was taken into account in the numerical simulation. 110 shows the distribution of temperature and relative humidity in the outermost MW insulation layer of a 44 cm thick masonry block according to orientation.
At the moment of freezing, the moisture content of the thermal insulation is not critical because the relative humidity is still in the hygroscopic regime. Temperature and relative humidity distributions of the wall section with different orientations show that in the outer third of the masonry block filled with mineral wool, the temperature and, most importantly, the relative humidity can be significantly different depending on the orientation. It can also be observed that in winter the relative humidity can be between 80% and 85% in the outer third of the masonry blocks.
![Table 10 Monthly design temperature and relative humidity data of MSZ 24140 [100]](https://thumb-eu.123doks.com/thumbv2/9dokorg/2498779.294582/69.892.112.794.499.608/table-monthly-design-temperature-relative-humidity-data-msz.webp)
Conclusions
However, differently oriented facades showed greater differences, an average simulated dynamic U-value of a north-facing wall in the heating season could vary by up to 16.9%. There are small differences between the values in the heating season in Espoo and Budapest, but there are significantly larger differences between Lisbon and Budapest. While heat transfer was similar and showed only 5.5% to 10% difference between blocks, moisture transmission was an order of magnitude higher (more than 300%) in the case of MW-filled blocks compared to EPS.
In the third separate part of this chapter, I investigated the freeze-thaw cycles of insulation-filled masonry blocks in the climate of Budapest. The standardized method showed the risk of condensation in the outermost thermal insulation layer; however, the freezing depth was underestimated by 100 mm compared to the hygrothermal simulated result of the same block. I have then analyzed how many freeze-thaw cycles are expected in the outermost layer of different thermal insulations during their lifetime of 50 years.
NUMERICAL OPTIMIZATION OF MASONRY BLOCKS
Optimization by the geometry of a selected insulation filled block
In the presented study, material properties were set according to Table 6 to provide continuity between the thesis chapters. It is visible that there is a higher relative humidity on the outer sides of the insulating mass than in the putty on the inner side. The internal geometry of the MW insulations in the masonry block is now trapezoid and parallelogram shape, depending on the variable set shown in Table 9.
It is visible, that the highest heat flux sizes occur in the non-optimized sides of the masonry blocks, therefore it is also worth going with the. In addition to the main objective of reducing the thermal permeability of the masonry blocks, there is also visible difference in the heat and moisture flux sizes over the sections of the optimized blocks compared to the initial one. It is visible that in the thinner internal ceramic parts between the insulating fillers, the heat flux is lower than in the case of the initial geometry shown in Fig.
Conclusions
NEW SCIENTIFIC RESULTS
Theses
I performed monthly steady-state hygrothermal simulations of walls and wall corner joints made of 44 cm thick, 5 masonry blocks filled with different thermal insulation, in the climate of Budapest. I performed hourly dynamic hygrothermal simulations of walls made of 44 cm thick, 5 masonry blocks filled with different thermal insulation, in the climate of Budapest. I showed that the number of freeze-thaw cycles depends on the type of thermal insulation filler and on the orientation of the facade.
I have designed thermal insulation filled masonry blocks based on a starting block 26 cm thick and 50 cm wide using a newly built automated design method. I showed that masonry blocks designed using the method achieved up to 20% lower thermal transmittance than the original block. The optimization process reduced the thermal transmissibility by changing the internal geometry of the block, the initial rectangular insulated cavities became trapezoidal on the sides and parallelograms in the middle of the masonry blocks after the process.
Possible applications of the new scientific results and future perspectives
Pore size distribution affects the thermal conductivity of the fired clay body of lightweight bricks," Journal of Building Physics, vol. In the scientific literature of the 1990s, the main issue was to calculate or simulate the thermal conductivity of hollow bricks. A.141] published an experimental assessment of the thermal conductivity of hollow-fired clay bricks using a half-scale device.
A is the free surface area of the sample [m2], pchamber is the water vapor pressure in the test chamber [Pa] and pcup is the pressure in the measuring cup [Pa]. Naldi, "The impact of the temperature-dependent thermal conductivity of insulating materials on the effective performance of the building envelope", . Rode, "Procedure for Determining the Design Value of Thermal Conductivity of Thermal Insulation Materials", Lyngby, 2001.
Boundary conditions play a key role in researching the energy efficiency of building elements. Kyriakides, "Impact of Boundary Condition Accuracy on Numerical Simulations of Thermal Performance of Building Elements,".
![Fig. A.1 Steps of numerical thermal bridge simulations demonstrated using different software on each step [A.16]](https://thumb-eu.123doks.com/thumbv2/9dokorg/2498779.294582/101.892.117.773.786.1066/steps-numerical-thermal-bridge-simulations-demonstrated-different-software.webp)