𝑉𝑒𝑎𝑟𝑙𝑦, 𝑉(𝑡𝑟𝑎𝑣𝑒𝑙, (𝑀,
- Background
- Motivations and research gaps
- Research objectives
- The applied scientific methods
- Dissertation outline
The impact of AVs on the transport mode choice is influenced by different variables, such as the travel time and travel cost. Finally, the availability of AVs on the market as a mode of transportation is controlled by specific stakeholders.
Introduction
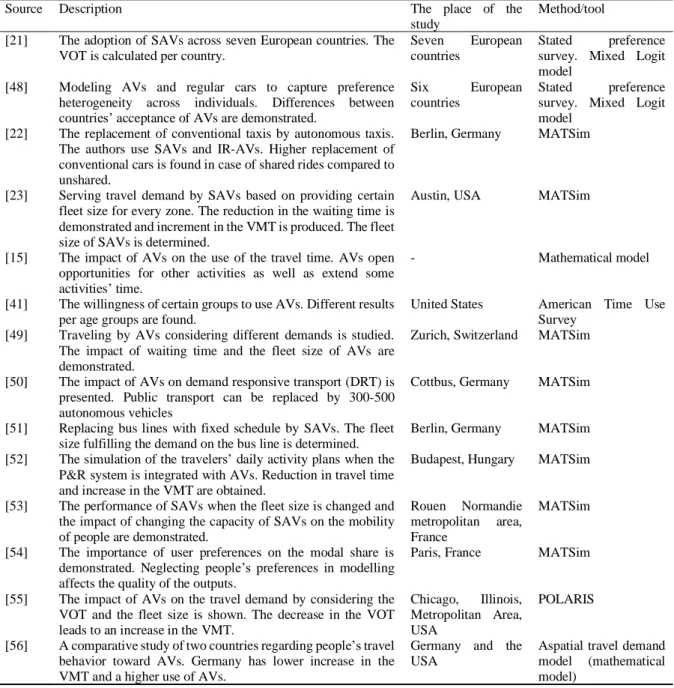
55] The impact of AVs on travel demand by considering VOT and fleet size is shown. The simulations of the travelers' daily activity plans aim to assess the impact of AVs on different demands and different groups of users based primarily on the change in the existing modal share, travel time and travel distance.
Methodology
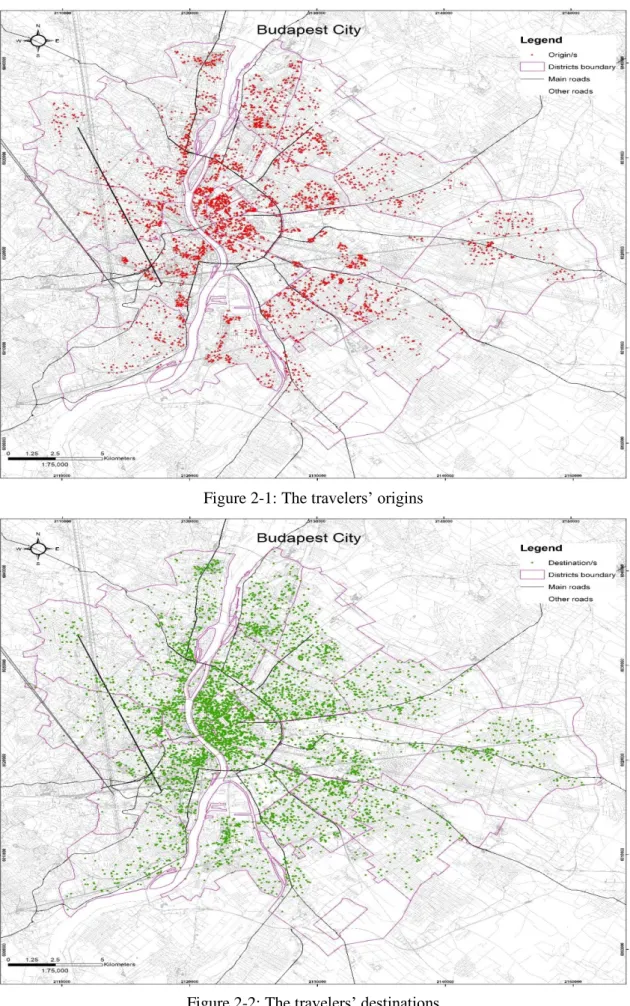
- Case Study
- Conceptual assumption of section one: the influence of AV introduction on the
- Conceptual assumption of section two: the evaluation of the impacts of AVs on
- Conceptual assumption of section three: the potential reduction in travel time
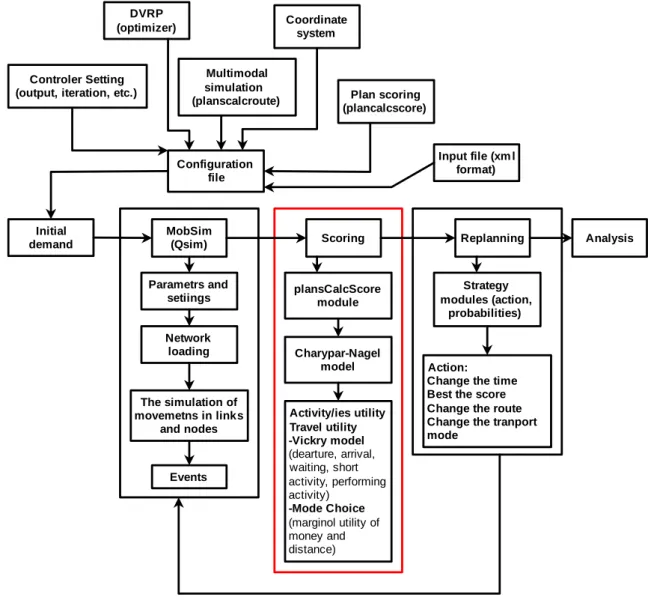
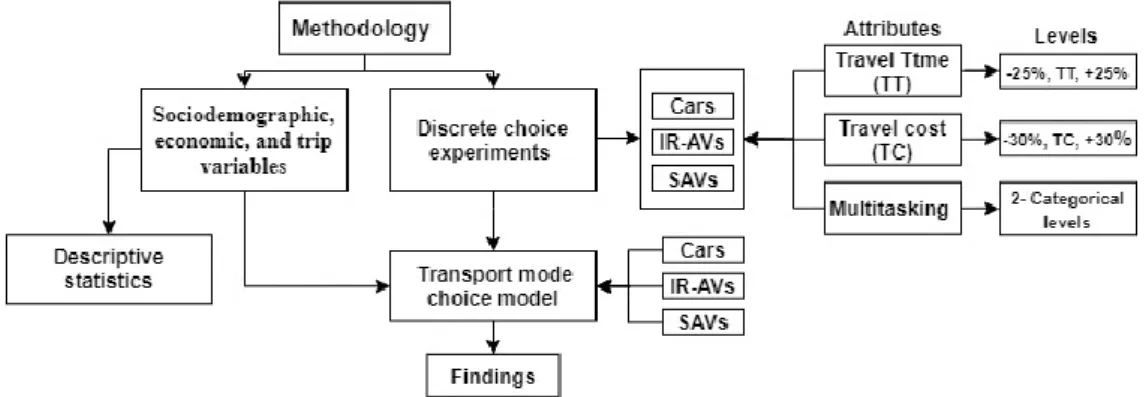
- Tool description
- The scheme of the analysis with a description
- Model development
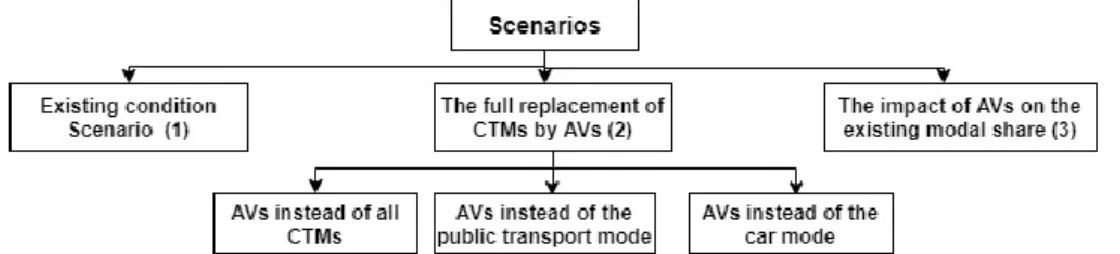
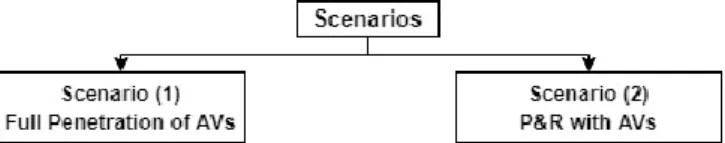
The scenarios are selected based on the literature and data availability (i.e. the travelers' daily activity plans). In this part, the simulations are first performed without any change in the travelers' daily activity plans (i.e. the existing conditions) for the four scenarios to be compared with the changes in travel behavior when AVs are on the market.
Results
- Section one: the influence of AV introduction on the CTMs and travel time
- Section two: the evaluation of the impacts of AVs on the mobility of various user
- Section three: the potential reduction in travel time with the full penetration of
Passenger travel time components when the fleet size of AVs is 10% of the sample size. Passenger travel time components when the fleet size of AVs is 20% of the sample size.
Discussion
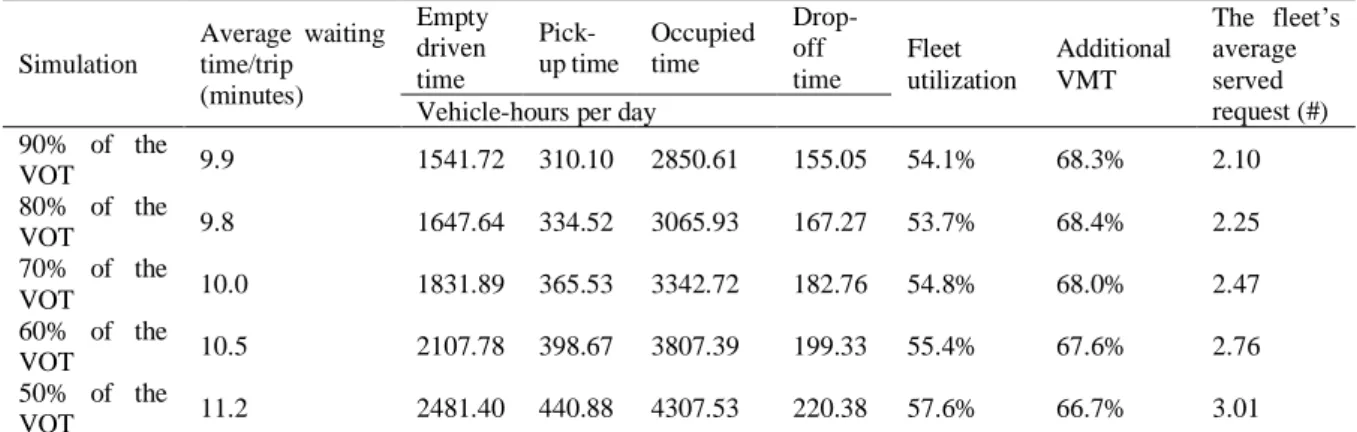
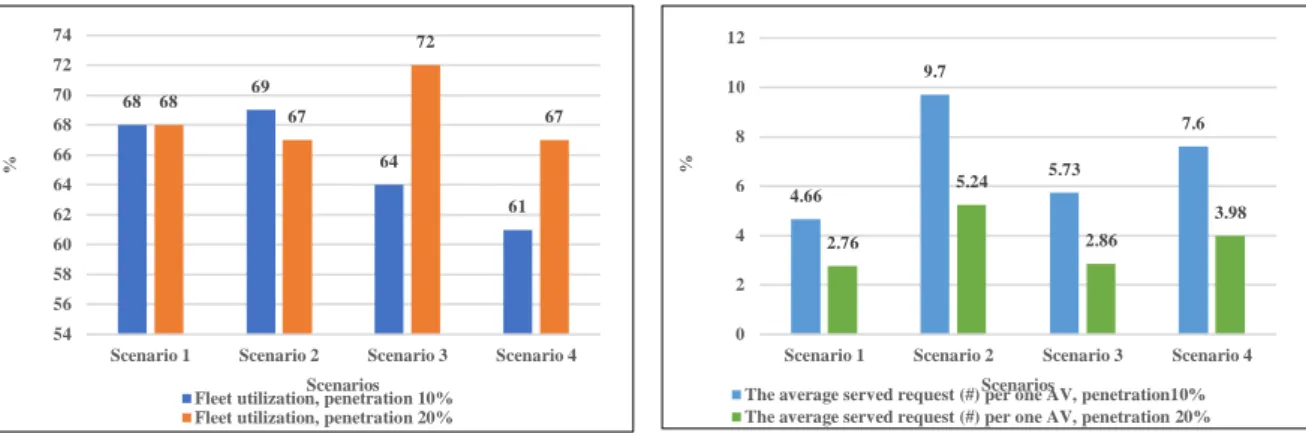
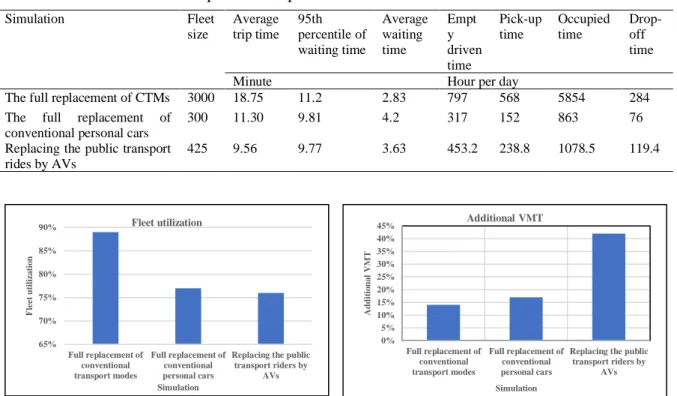
Changes in modal share are influenced not only by the size of the AV fleet, but also by other factors such as passenger VOT, time preferences for individuals' schedules, and activities. The results of the simulations show that as the utilization of the vehicle fleet increases, the additional distance traveled decreases.
- Introduction
- Methodology
- Conceptual assumptions of section one: the impact of integrating AVs with the
- Conceptual assumptions of section one two: the impact of AVs on car travelers’
- Tool description
- Results
- Section one: the impact of integrating AVs with P&R system on shoppers and
- Section two: the impact of AVs on car travelers’ behavior when P&R facilities
- Discussion
- Section two: the impact of AVs on car travelers’ behavior when P&R facilities
It is worth mentioning that the total travel time is 107.6 minutes plus 4.5 (i.e. the average value) for the parking process at the P&R facilities. The simulation of the new daily activity plans (including .. the P&R activity) is performed until a steady state is reached for the system.
Introduction
In addition, the current study analyzes the effects of on-board activities and means carried by travelers on perceived travel time considering the main travel purpose of travelers in urban areas (i.e., short trips). Different demonstrations of on-board activities are presented for the sake of finding a unified presentation of those on-board activities that travelers typically perform, and not only ICT tools, but other tools carried by travelers (ie, non-ICT tools) are also studied.
The potential onboard activities and the tools carried by travelers
How are activities on board and the tools carried by travelers associated with the variables of sociodemographic and travel characteristics. The participants are asked to give their level of agreement with the impact of the investigated on-board activities and the tools carried by travelers on the travel time [94].
Methodology
- The travelers’ attitudinal variables
- The applied methods
- Survey design
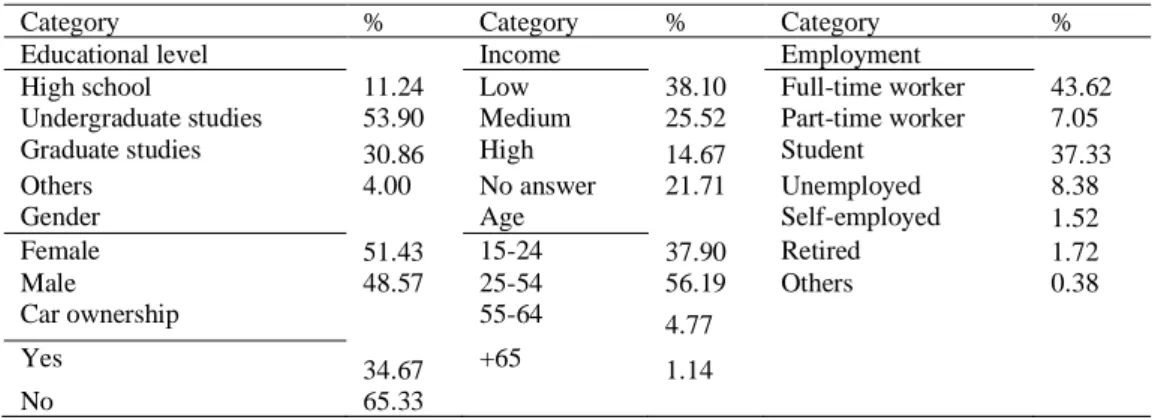
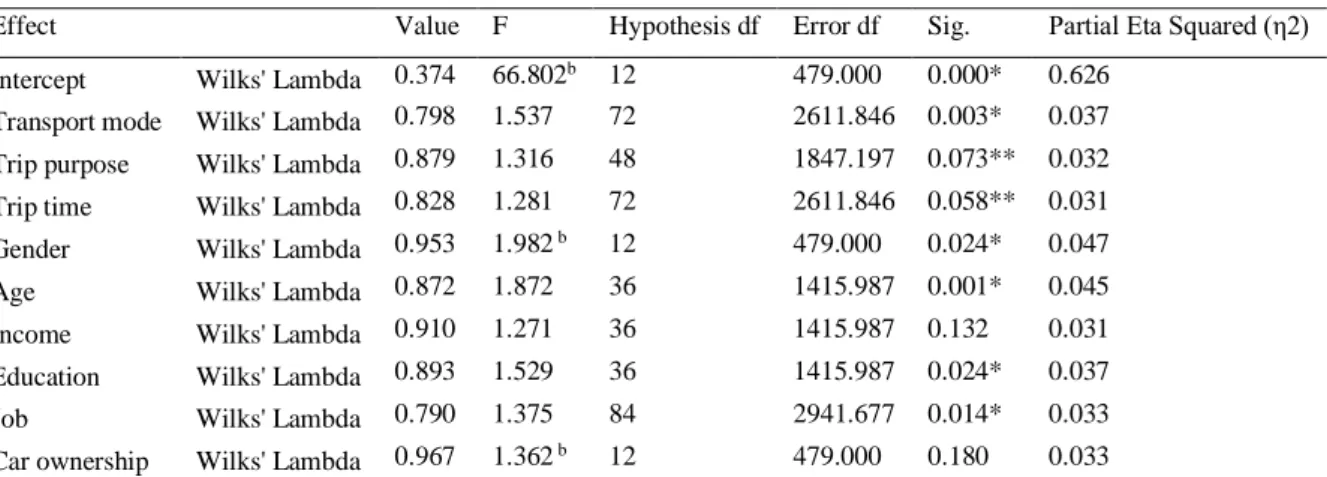
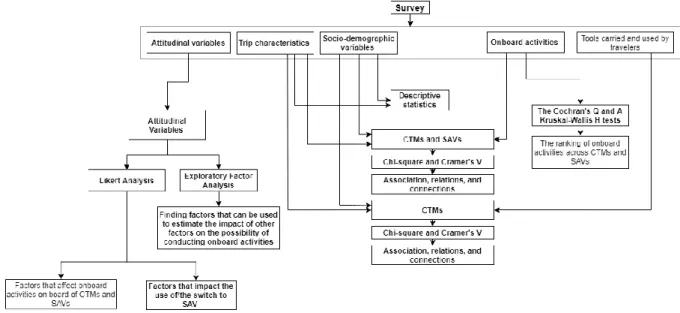
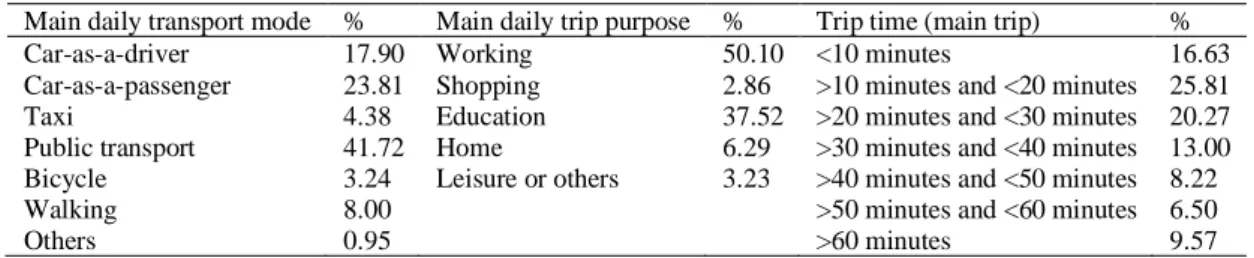
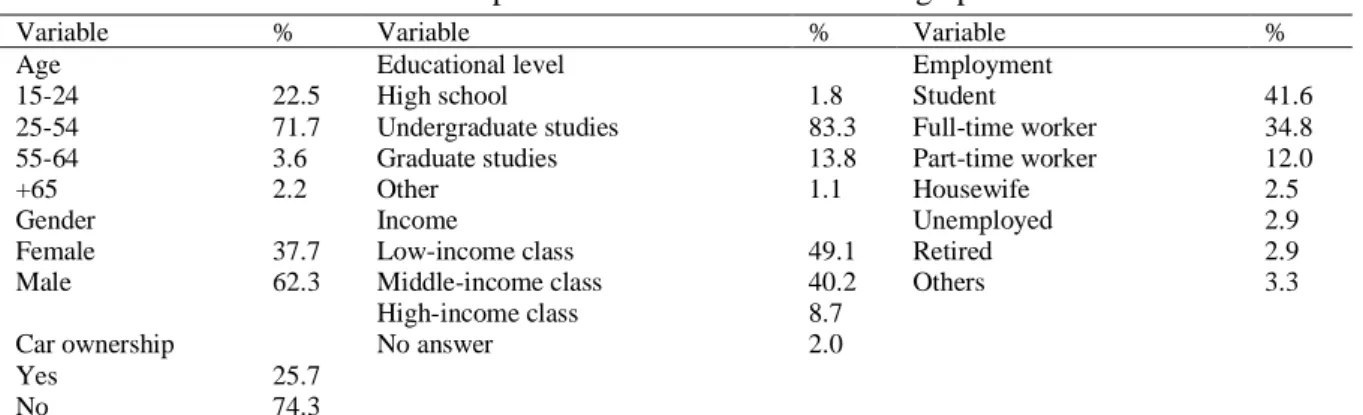
The behavior of the travelers in the vehicle with regard to activities on board and the tools brought along with the travel time is analyzed. The questionnaire contains the following information on sociodemographic variables (e.g. age, gender and education), economic variables (e.g. traveller's income, car ownership and job), trip characteristics (e.g. purpose of the trip, mode of transport and travel time), which aids the traveler uses on board, how the use of the aids travelers carry have on the perceived travel time (i.e. whether the selected aids positively influence the travel time) and how the onboard activities influence the perceived travel time (i.e. whether the selected activities on board have a positive impact on travel time).
Analysis and results
- Descriptive statistics
- Ranking those factors that impact the trip time negatively
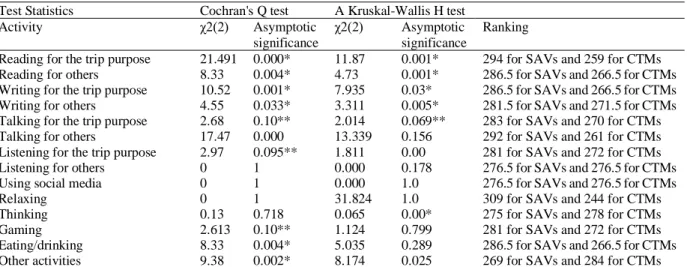
- The travelers’ preferences on board of CTMs and SAVs
- Comparison between CTMs and SAVs based on multitasking availability
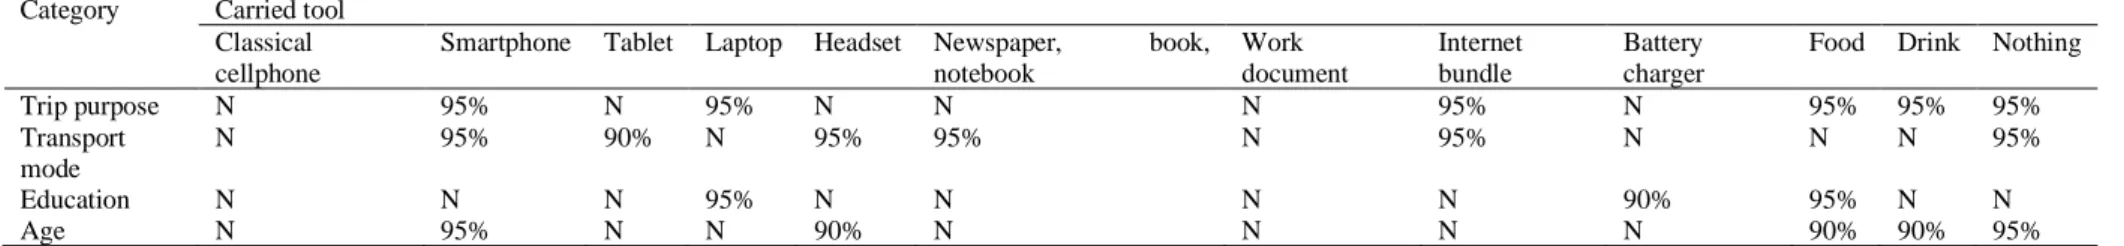
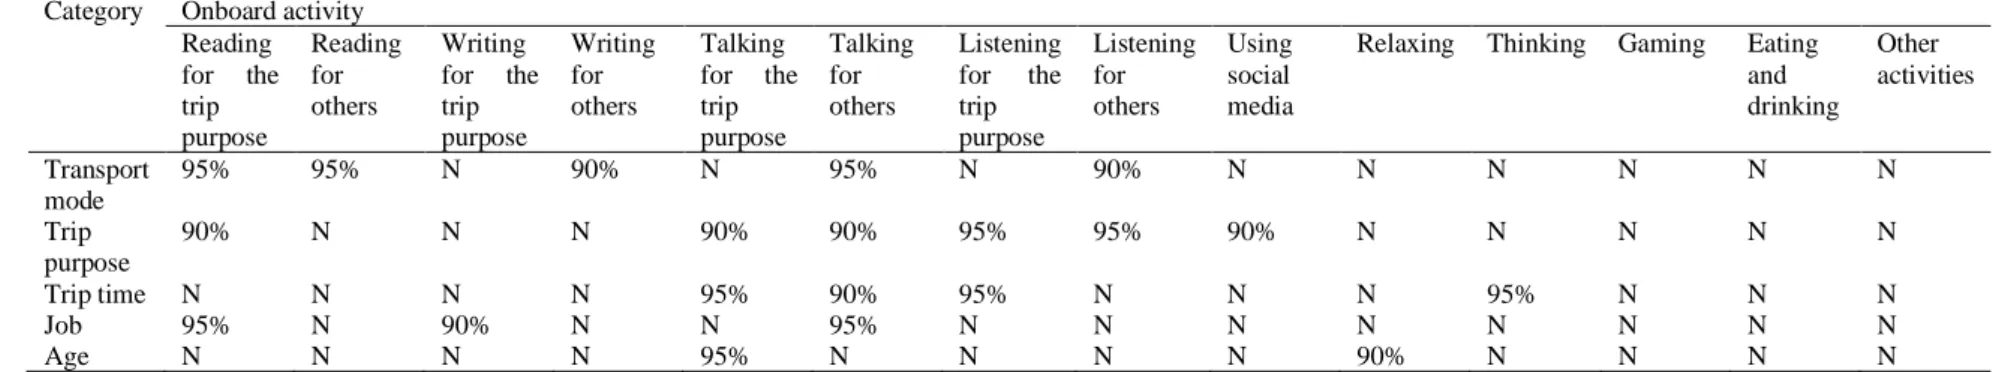
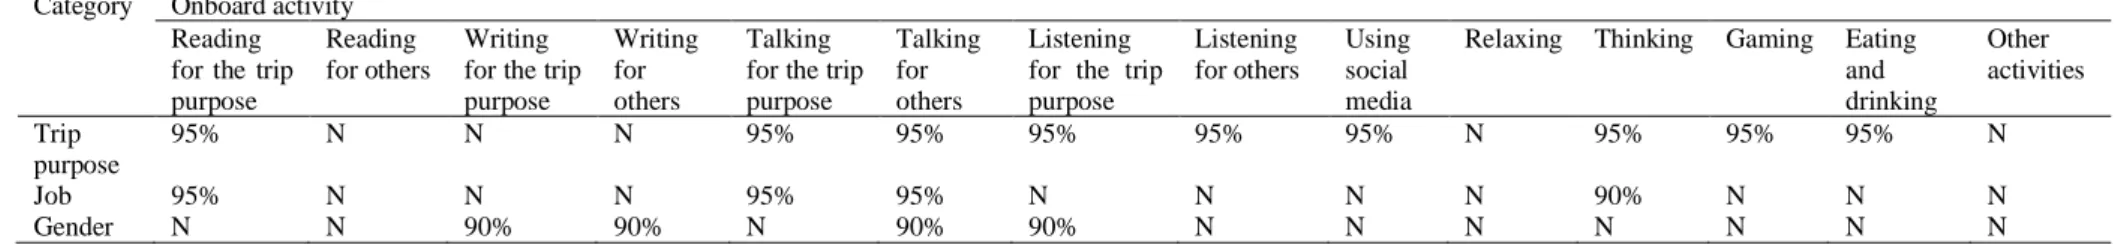
- Multitasking and the carried tools across trip characteristics, sociodemographic
- The impact of onboard activities and carried tools on the trip time
- The transport mode with the most frequent activity
- The connection between the onboard activities and the tools carried by the
- The changes of the impact of onboard activities and carried tools by travelers on
- Ranking the travelers’ groups based on the onboard activities and the tools
- The factors that own the most impact on the perceived trip time
Participants' responses regarding the positive impact of various tools carried by the travelers and the on-board activities on travel time. The connection is built based on the impact of on-board activities and the tools that travelers carry on the experienced travel time. A bivariate analysis of the tools carried by travelers (ie the dependent variables) is examined to check for correlations.
The rotational component matrix, which represents the Pearson correlation between the components and items (i.e., the correlations are called factor loadings), is presented in Table A.
Discussion
How on-board activities relate to the means carried by travelers on board to affect travel time. What are the effects of on-board activities and means carried by travelers on perceived travel time. The identification of the structure of the relationship between vehicles carried by travelers and travel time is analyzed using EFA.
This determines the underlying relationship between on-board activities and the resources travelers carry (see Figure A. 11).
Introduction
IR-AVs are driverless cars that are not owned by individuals, but are used separately from other passengers, and their capacity is like a car. SAVs are driverless cars that are not owned by individuals but shared with other passengers, and their capacity is like cars. These new modes (i.e., IR-AV and SAV) are chosen because of their common characteristics, such as there is no driver and all people are converted into passengers.
It is worth mentioning that IR-AVs and SAVs are accepted to provide a door-to-door service, and they are not owned by individuals.
Methodology
- The approach of the analysis
- Survey design
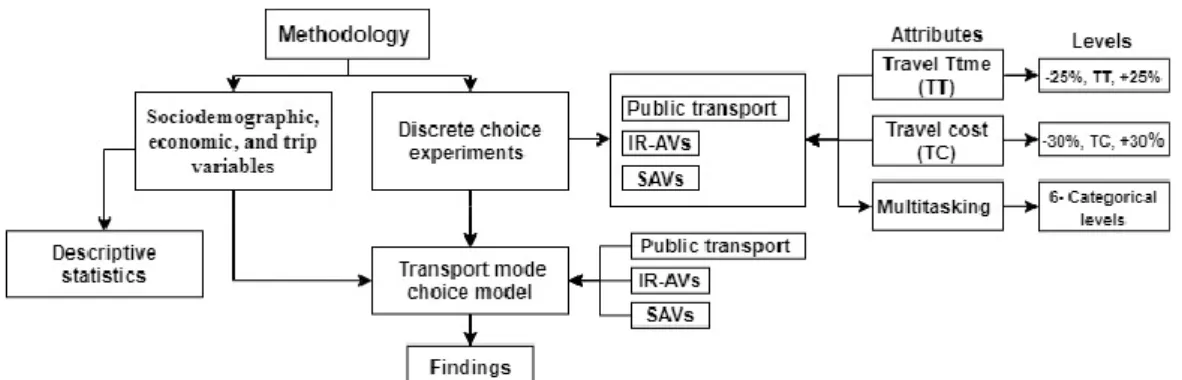
- Defining the attributes
- The DCE design methods
- Model specifications and design
Where VOT stands for the value of travel time, 𝛽𝑡𝑡 is the travelers' marginal utility. It is worth mentioning that only two combinations of the DCEs are shown as examples. Multitasking accessibility (i.e., the active activities) includes the following: (1) reading, (2) writing, (3) speaking (to other passengers or on the phone), (4) using social media (i.e., surfing Twitter, Facebook, YouTube, or Instagram), (5) eating/drinking, (6) listening (to music or radio), and (7) gaming (on a laptop or tablet).
The unavailability of multitasking (i.e., passive activities) means that travelers are less likely to perform the previous seven active activities as primary activities, but may do the following: (8) thinking (i.e., tracking travel, following meditation, or planning), (9) relaxing (i.e., sleeping or looking out the window), and (10) doing nothing (i.e., doing strange, insatiable, stress, stress, stress, stress, stress, stress, stress, stress.
The analysis and the results of the first group
- Descriptive statistics
- Model estimation
- Margins
- Conditional marginal effect
The panel data ML model uses random coefficients to model the correlation of the choices across the alternatives. The predictive margins of the transport modes in relation to the time and the cost of the journey. The average marginal effects of the travel time on the ASC of the alternatives (the values are multiplied by 10^-2).
The average marginal effects of the travel costs on the ASC of the alternatives (values are multiplied by 10^-3).
The analysis and the results of the second group
- Descriptive statistics
- Model development
- Model fitting information
- Model estimation
- Margins
- Conditional marginal effects
On-board reading activity shows a positive value, which leads to the probability of choosing a mode of transport with a reading opportunity being 1.31 greater than the probability of doing nothing (i.e., the relative hazard ratio). The activity of speaking on the board has a higher probability than the probability of doing nothing (ie, the relative hazard ratio is 1.31), and the activity is important. In the case of public transport, only the 65+ group is significant, where the relative odds of being on public transport increase by 2241 if you move from the 15-24 age group to the 55-64 age group.
While the relative log probability of being on public transport increases by 0.243 when moving from car ownership to car ownership.
Discussion
Therefore, IR-AV is the predominant form of transport where travelers can find their preferences mostly met. The model shows the margins of choosing each alternative, for example IR-AV has the highest probability and public transport has the lowest. Other traveler characteristics show different impacts on the use of a mode of transport, for example, based on the developed model, the probability of using SAVs for people who are drivers is the lowest, and people with the lowest potential to use public transport are also drivers.
- Introduction
- Methodology
- The definition of the problem
- Stakeholder analysis
- The identifications of the stakeholders’ objectives and criteria
- Analytic hierarchy process
- Parsimonious AHP
- Results and discussion
- The priority raking of the actors
- The analysis of the actors
- Final normalized scores/rankings
- The overall rankings of the objectives and criteria
- Discussion
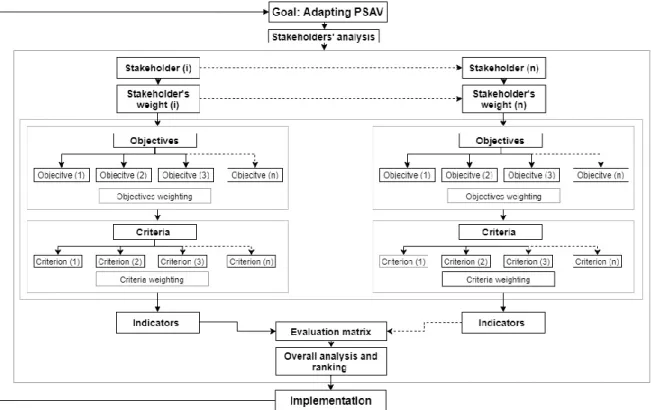
The advantages of PAHP include avoiding the bias of comparing different numbers of relevant objects and also avoiding the reversal problems (i.e. the changes of order in the prioritization that occur as a result of adding or removing one or more objects to the set of considered objects) [37]. The confidence of travelers to use PSAV depends on the availability of sufficient supply (i.e. the fleet and reliable vehicles [155]. Manufacturers give the highest priority to the objective of "increase traveler confidence" and the objective of "provide user benefits" the lowest.
Other ranking results demonstrate the ranking of each objective based on each actor's weight of the respective objectives and each actor's influence on the adoption of PSAV as a mode of transportation (ie, the weight given by each actor compared to others, as shown in Table 6-3).
- Discussion of the Findings
- Discussion of the findings of Thesis 1
- Discussion of the findings of Thesis 2
- Discussion of the findings of Thesis 3
- Discussion of the findings of Thesis 4
- Discussion of the findings of Thesis 5
- The application of the scientific findings
- The applications of the findings of Thesis 1
- The applications of the findings of Thesis 2
- The applications of the findings of Thesis 3
- The applications of the findings of Thesis 4
- The applications of the findings of Thesis 5
- Limitations
- Scope for future works
This thesis discusses the influence of the travelers' activities on board and the tools travelers carry on the perceived travel time. The results show the impact of the tools that travelers carry and activities on board on the perceived travel time in urban areas across various groups of travelers. The impact of multitasking on transport mode choice is positive, while it is negative in the case of travel time and travel cost.
Additionally, changes in the impacts of travel time and travel cost on travel behavior are analyzed.
The impact of the availability of the main activities on board on the choice of transport methods is analysed. 183] Zhang, W., The interaction between land use and transportation in the era of shared autonomous vehicles: a simulation model. In the modeling formulation, let Zi stand for the characteristics of the alternative (j) for an individual (i).
Scree shows the activities on board (right) and the tools travelers carry (on the lift). CR, the weight and ranking of the objectives and criteria based on the views of the operators. CR, the weight and ranking of the goals and criteria based on the views of the producers.