Also, I would like to express my gratitude to my collaborators, especially Doru Constantin and Cyrille Hamon, who supported my work in every way. Finally, I am forever indebted to my family and friends for their understanding, patience and endless encouragement whenever required.
Introduction
Since the presence of inhomogeneities in the vicinity of gold nanorods has a profound impact on the optical properties, detailed investigation of these phenomena is required. By analyzing the optical properties of nanorods in such inhomogeneous environments, the presented work attempts to establish a connection between the optical response and the resulting structure.
Theoretical background
The optical properties of gold nanoparticles
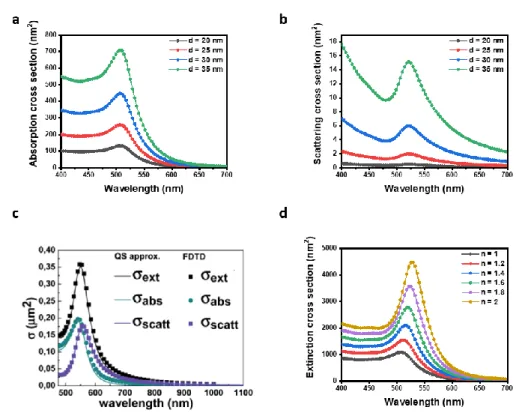
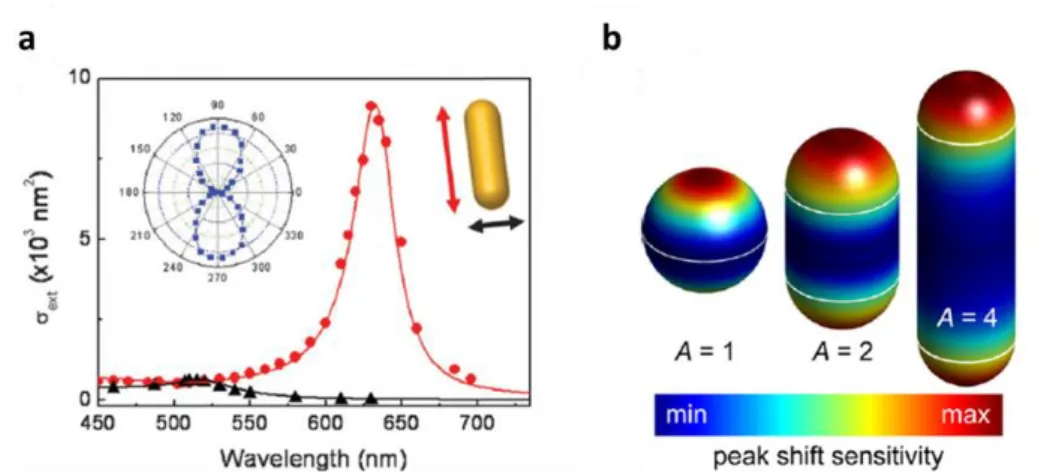
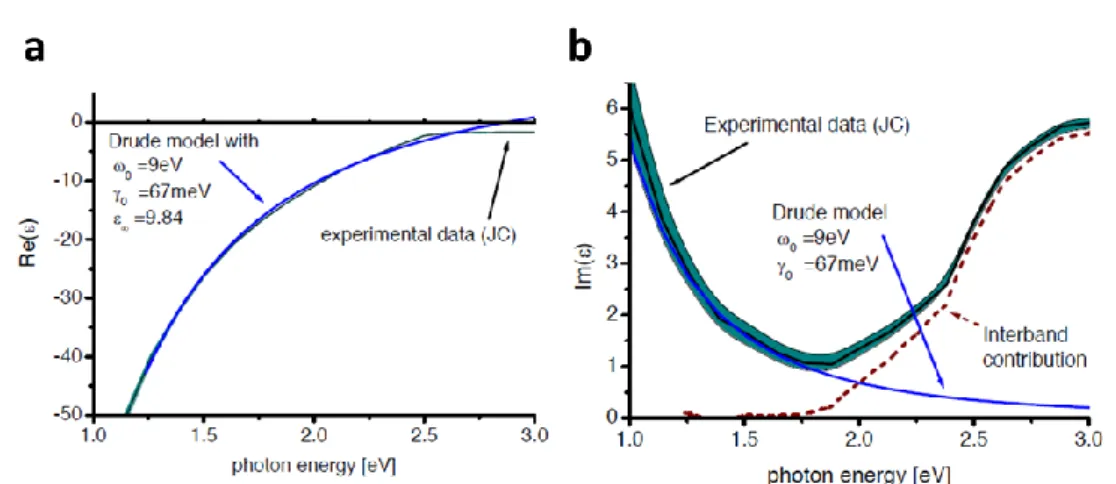
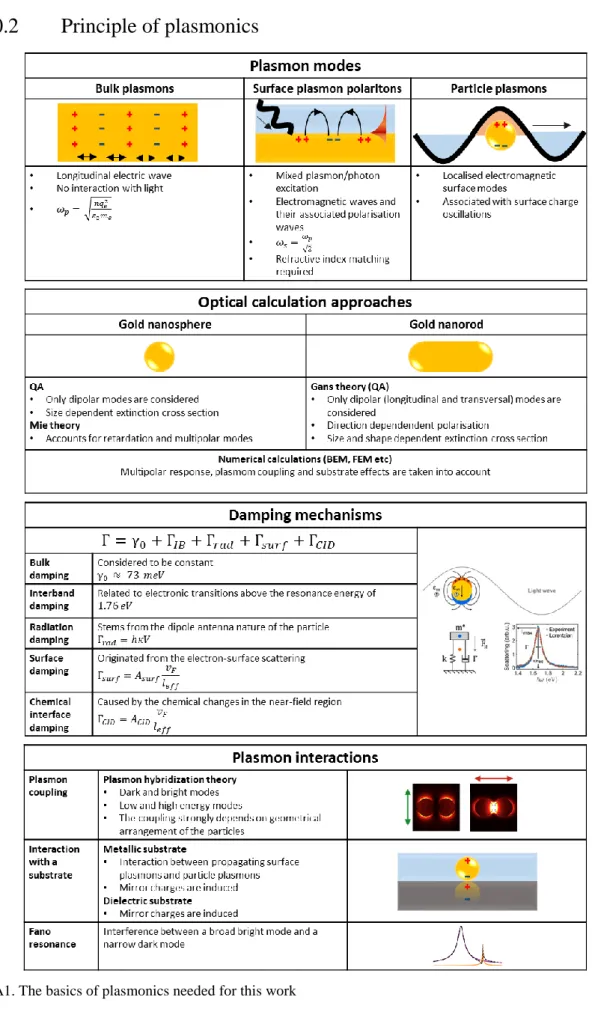
13 For noble metals, the bulk plasma frequency (𝜔𝑝), where the real part of the dielectric function is zero (if 𝛾0 ≅ 0), can be found in the ultraviolet region of the optical spectrum. The longitudinal LSPR of gold nanorods shows a sensitive dependence on the refractive index of the surrounding environment.
Single particle spectroscopy
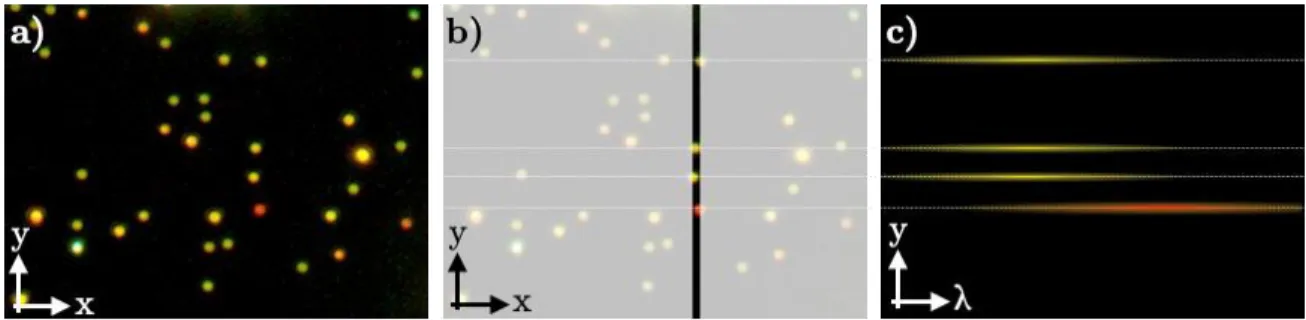
They can be identified as colored point sources in the DF image with the dimension determined by the point spread function of the optical system (Figure 16.a). In Figure 17, a selected scattering spectrum of an individual nanoparticle can be seen in the CCD image.
Synthesis, surface modification and self-assembly of gold nanorods
Surprisingly, an electrostatic gradient can be observed in the electrostatic potential map due to the crystalline structure of the nanocrystal.22. As a result, a noticeable shift of the plasmon resonance peak can be observed in the particle extinction spectra.
Motivation and aim of the work
By comparing these measurements, the optical response may be related to the structural features of the fragmented nanorods. Investigation of the scattering spectra of individual gold nanorods on a nanopatterned substrate with different configurations. On the other hand, the nanosphere can be located at the top of the nanorod or at the substrate level.
The effects of the immersion capillary forces after the controlled self-assembly on the geometric rearrangement are also analyzed. The correlated polarization-resolved scattering spectra of the resulting nanosphere/nanorod heterodimers provide information on the relative arrangement of the particles.

Experimental Section
- Synthesis procedures
- Surface modification of gold nanoparticles
- Measurement methods
- Ion irradiation of ITO layers
- Optical simulations
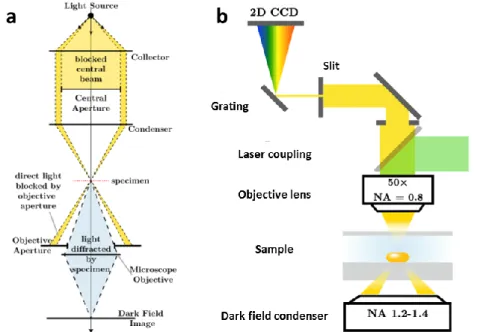
The surface of the gold nanorods was modified using two molecules: 5 kDa mPEG-SH and MTAB (MTA+ in its dissociated form). 100 µl of the 10-fold diluted GNR1 solution was spin-coated (30 s x 1200 rpm) onto a pre-cleaned (sonication for 10 minutes in each: acetone, isopropanol, water; drying in nitrogen flow) mapped glass substrate. The scattering spectra of the selected surface-modified gold nanorods were acquired using an aberration-corrected imaging spectrometer (Princeton Instruments Isoplane SCT320 + Pixis: 400BRX cooled CCD camera) coupled to the microscope.
AFM and SEM measurements were performed on the same particles. a) The characteristic dark-field image of a mapped glass substrate facilitating unambiguous identification of the particles (b). The same procedure was performed in the presence of 5 mM CTAB solution. a) The concept of investigating the optical changes upon binding of short-chain thiol ligands (b).
Results and discussion
Characterisation of model systems
Investigating the patch formation at the tips of gold nanorods
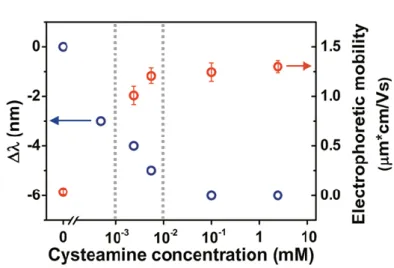
Longitudinal resonance peak shifts (left axis) and electrophoretic mobility changes (right axis) of rods at different concentrations of cysteamine. Indeed, MTAB binding induces a small blue shift in the longitudinal LSPR frequency compared to the resonance wavelength of the as-synthesized CTAB-capped rods (see Figure 35 ). More importantly, both structural features can be found simultaneously in the AFM deformation map of the nanorod modified at 10-2 mM cysteamine concentration.
As the AFM image shows, the long-chain polymer layer covers the side region and a well-defined chemical patch can be observed at the tip of the nanorod. Below the critical concentration (for the case of cysteamine concentration 10-3 mM) statistical binding of cysteamine occurs without creating a well-defined chemical fragment.
Investigating the binding of differently charged short-chain thiol ligands on CTAB-capped
The mean value of the obtained resonance wavelength shifts and LSPR linewidth changes are depicted in Figure 44. Compared to the 5 mM CTAB concentration case, at 10−3 mM CTAB concentration, a much more disordered surface layer can be expected on the surface of the nanorods. As shown in Figure 44, the magnitude of the red shift observed around 10-1 mM ligand concentration is apparently related to the CTAB concentration.
It is consistent with the hypothesis outlined, that is, the surface attached, negatively charged MPA induces the accumulation of CTA + from the bulk, resulting in a significant red shift proportional to the CTAB concentration. The resonance wavelength changes and (b) the LSPR broadening of the nanorods at different bulk CTAB concentrations after addition of MPA.
Gold Nanorod Plasmon Resonance Damping Effects on a Nano-patterned Substrate
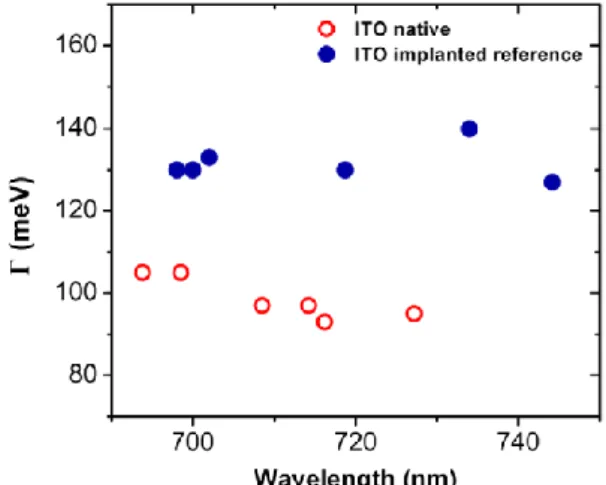
Since ion implantation causes changes in the physical or chemical properties of the ITO substrate, it is expected to affect the optical spectrum of gold nanocrystals. After investigating the influence of reference substrates (native and irradiated ITO substrates), the optical properties of nanorods deposited on the nanopatterned substrate were examined in detail. In general, any increase in non-radiative attenuation contributions decreases the scattering intensity of the nanoparticle.
However, increasing the refractive index of the surrounding medium results in an opposite effect. In conclusion, the physicochemical properties of the ITO layer can be significantly modified by using implantation.
Spatial rearrangement of gold nanosphere/nanorod heterodimers and their polarisation-dependent
The analyzer angle of 0° corresponds to the long axis of the nanorod, as can be seen in the SEM insets of the selected heterodimers. For both cases, a strong modulation of the optical spectrum can be seen as the analyzer angle was changed. For side arrangement, a significant blueshift and an intensity loss of the broad lower energy peak can be observed in the simulated spectrum when the analyzer is rotated to 90°.
After disassembling the liquid cell, the SEM micrographs of exactly the same heterodimers were recorded. Polarization-resolved scattering spectra of exactly the same heterodimers in aqueous medium, reconstituted after the SEM measurements in the liquid cell (c, d).

Summary in English
In this case, the plasmon resonance linewidth shows a steeper increase already when one third of the nanorod is placed over the irradiated area. The spectral properties are very sensitive to the geometry of the nanostructure, so they can provide information about the relative geometric arrangement of the given heterodimer. In the former case, the ball is located on top of the rod, while the latter means that the ball can be found next to the rod at substrate level.
The white light scattering spectra of the heterodimers show no significant difference for these two arrangements. This can be used to obtain information about the relative geometric arrangement of the heterodimers upon assembly in situ in the aqueous phase.
Summary in Hungarian
A spektrális tulajdonságok nagyon érzékenyek a nanostruktúra geometriájára, így információt tudnak adni az adott heterodimer relatív térbeli elhelyezkedéséről. Az első esetben a labda a rúd tetején van, míg az utóbbi azt jelenti, hogy a labda a rúd mellett van a hordozó szintjén. Ez a megfigyelés felhasználható arra, hogy in situ információkat nyerjünk a vizes környezetben történő önszerveződés során keletkező heterodimerek relatív térbeli elhelyezkedéséről.
Az in situ polarizációval feloldott szórási kísérletek azt mutatták, hogy az irányított önszerveződési folyamat során a felső és az oldalsó tömb is kialakítható. Megmutatható, hogy a gömbrúd a legmagasabb rendű heterodimereket oldalirányú elrendezéssé tudja alakítani, azaz a gömb a rúd tetejétől a tartó szintjéig mozog.
Theses in English
I investigated for the first time how local substrate dielectric property inhomogeneities affect the scattering spectrum of substrate-bound gold nanorods. I have demonstrated, for the first time, that measurements of polarization-resolved optical scattering spectra allow to distinguish between two main arrangements of gold nanosphere/nanrod heterodimers, that is, when the gold nanosphere is on top of the gold nanosphere or at the level of the substrate. . Based on optical simulations that also account for the given experimental arrangement, I conclude that the difference between the polarization-dependent optical responses of the two configurations originates from the different spatial orientation of the transversely coupled mode of the dipolar sphere/rod.
Based on the scattering spectra of individual evolving heterodimers, I confirmed that during the process, the nanosphere can adhere to both the top and side regions of the solid/liquid interface of the established nanorods. Using correlative microspectroscopy/electron microscopy I have demonstrated that the configuration of heterodimers can be rearranged during the drying procedure as a result of immersion-type capillary forces.
Theses in Hungarian
Patchy nanoparticles and their assemblies investigated at the single particle level, 11th Conference on Colloid Chemistry, Eger, Hungary, 2018. Surface chemical patch formation and self-assembly investigated at the single-particle level, ECIS 2018, Ljubljana, Slovenia, 2018. Region -selective self-assembly of nonuniform particles explored at the single-particle level, 2018 Early Career Scientist Summit, Physical Laboratory, Teddington, United Kingdom, 2018.
Patch formation on tip-selectively modified gold nanorods at the single particle level, 11th Conference on Colloid Chemistry, Eger, Hungary, 2018. Detecting the spatial arrangement of gold nanoparticle heterostructures at the single particle level 15th Zsigmondy Colloquium, Dresden, Germany, 2019.
Appendices
- Applied materials, methods and instruments
- Principle of plasmonics
- Correlative scanning electron microscopy/single particle spectroscopy
- Asymmetric tip geometry in AFM PeakForce measurements
- Summary of the result of Lorentzian fits after thiol binding
- Simulations examining the effect of nanorod shortening on the scattering spectrum of gold
- Simulations calculating the pseudo white-light scattering spectra of nanosphere/nanorod
- More polarisation-resolved scattering spectra of gold nanosphere/nanorod heterodimers
- Simulation of in situ polarisation resolved scattering spectra of gold nanosphere/nanorod
Changes in longitudinal LSPR wavelength upon addition of cysteamine, obtained by fitting the Lorentzian function to the scattering spectra of individual gold nanorods without CTAB. Changes in longitudinal LSPR wavelength with MPA addition obtained by fitting the Lorentzian function to the scattering spectra of individual gold nanorods without CTAB. Changes in the longitudinal LSPR wavelength with the addition of cysteamine, obtained by fitting the Lorentzian function to the scattering spectra of individual gold nanorods at 1 mM CTAB concentration.
Changes in longitudinal LSPR wavelength after cysteamine addition obtained by fitting Lorentzian function to scattering spectra of individual gold nanorods at 5 mM CTAB concentration. Changes in longitudinal LSPR wavelength after MPA addition obtained by fitting Lorentzian function to scattering spectra of individual gold nanorods at 5 mM CTAB concentration.
List of References
Chemical interface damping in single gold nanorods and its near elimination by tip-specific functionalization. Contributions of radiation damping and surface scattering to the linewidth of the longitudinal plasmon band of gold nanorods: A single particle study. Seed-mediated synthesis of gold nanorods: role of the size and nature of the seed.
One-pot synthesis of gold nanorods by ultrasonic irradiation: the effect of PH on the shape of the gold nanorods and nanoparticles. Surface-enhanced Raman scattering of molecules adsorbed on gold nanorods: Plasmon resonance state outside the surface.