I would also like to thank the employees of the Vehicle Elements and Vehicle Structure Analysis Department for their sympathy for my studies. ΠG2 Potential energy related to second order effects of eccentric initial loads ΠGe Potential energy related to initial concentrated forces.
History
One of the most important instability analyzes concerns the foundations of rotating machines, but also bridges, chimneys or guyed masts. In this kind of structure, the axial displacement doubled the frequency of the lateral vibration that causes resonance.

State of art
The second question concerns the effect of this type of loading on the dynamic stability regions of the structure. Effect of initial moment gradient loading on the vibration and dynamic stability of a thin-walled space structure.
Introduction
Stability concept
Λόγω Koiter, το ελαστικό συνεχές είναι σταθερό εάν δίνονται ε και ε', υπάρχει τέτοια δ(ε,ε') και δ'(ε,ε') που,.
Preliminaries
In general, bi-moment can be given by a pair of equal and opposite bending moments. The voltage, displacement and external loads can be expanded as follows to derive the incremental form of the (2-3-10).
Introduction
Otherwise, if the shear center and center of gravity do not coincide, the frequencies and shape modes will be coupled. The equation of motion and its boundary condition will be derived and natural frequencies and critical buckling moments will be given using a numerical solution method.
Total Potential Energy
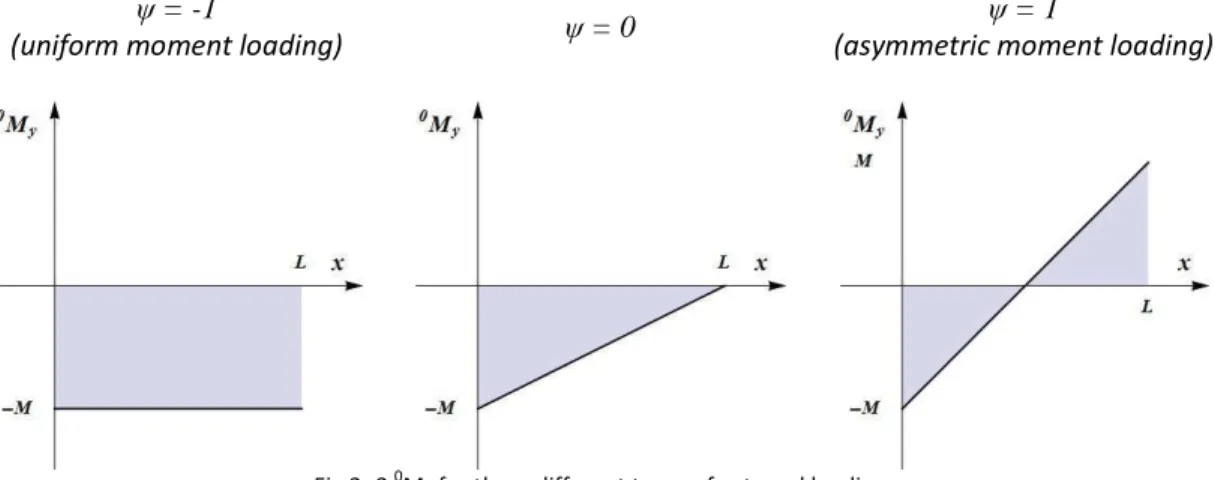
A point to be noted here is that in this text it is assumed that the initial gradient moment acts on the strongest principle axes (Iz < Iy). First, the cross section can be rotated about the center point until the working load is fixed on the strongest main axes.
Equations of motion
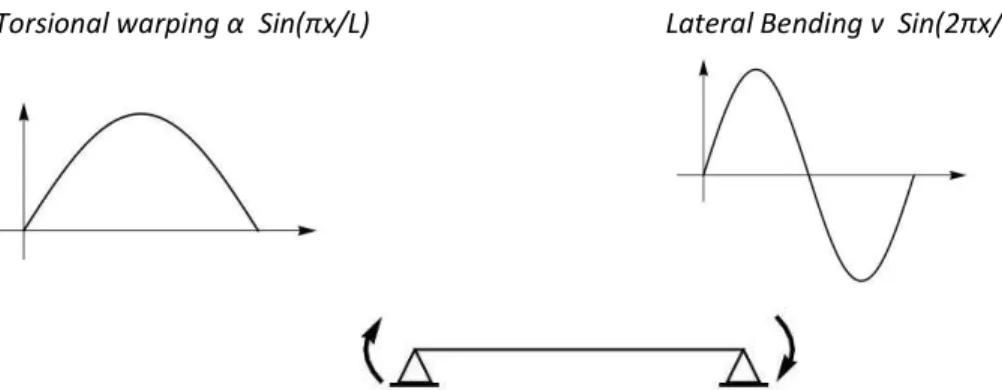
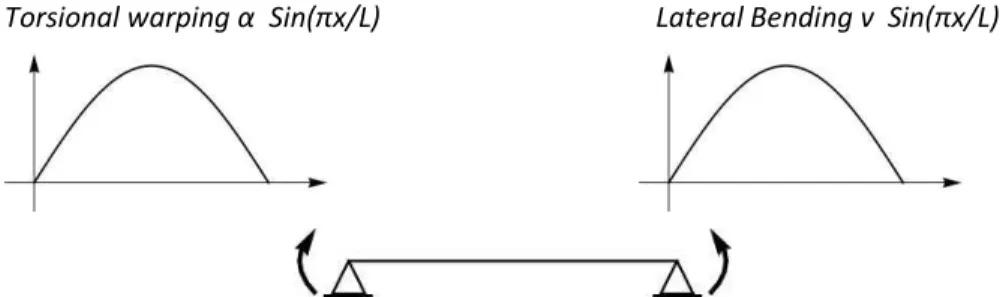
31 The second derivative with respect to displacement in (3-3-3) means that there will be no moment of resistance at the hinges (v" = 0) and the beam can be twisted freely at the end supports (α" = 0). Solution of (3-3-15) can be found in the modal eigenvalue problem section of any vibration.
Natural frequencies and Critical Buckling Moment
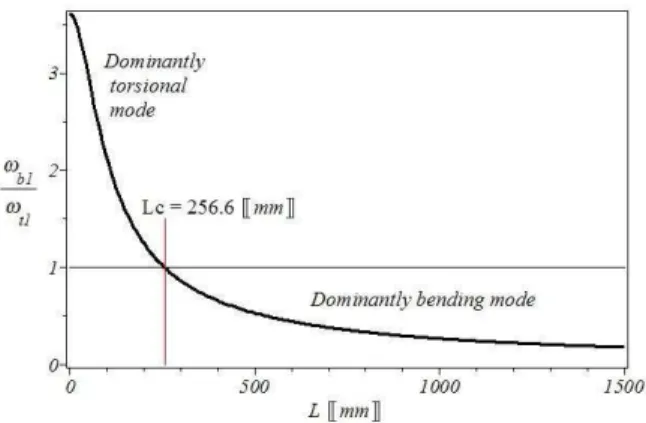
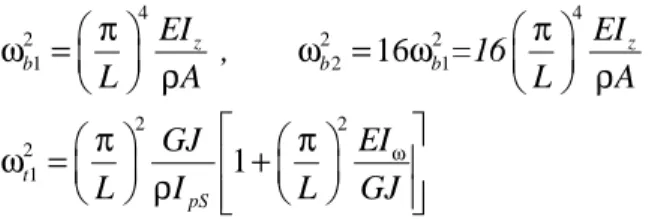
The ratio of first natural lateral bending frequency over first natural torsional frequency compared to one determines the behavior of the structure, i.e. in fig (3-8) the ratio of first natural lateral bending frequency over first natural torsional frequency for CS4 cross-section is given.
Forced Vibration
41 All three roots of (3-4-15) are the function of steady state moment load factor, µ, and moment gradient parameter, ψ. In Fig. (3-10 and 11) the natural frequency changed versus steady state factor is given for CS1 and CS4 cross sections. By increasing the steady moment load factor from zero (no moment) to one (fully loaded), the characteristic of the natural frequency is changing.
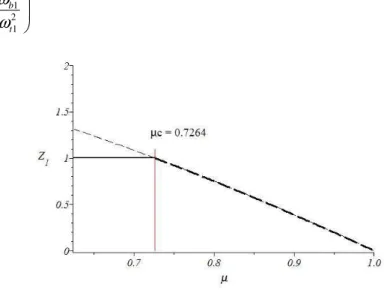
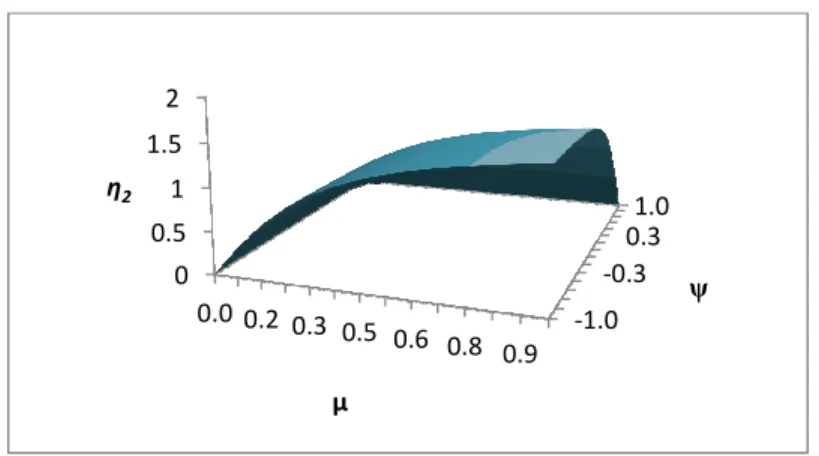
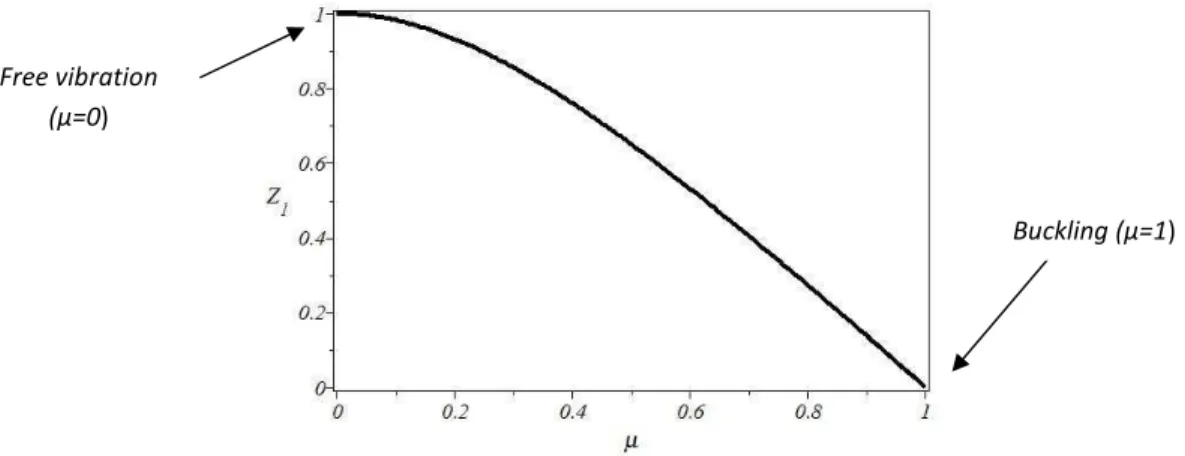
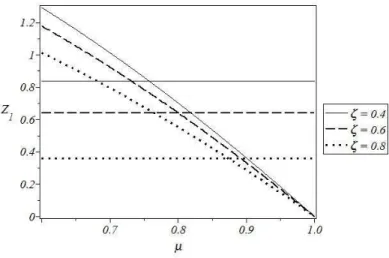
As is evident in (3-4-25), the non-dimensional variable Z1 depends on the gradient moment factor and the stationary moment load factor. On figures (19-3-22) dominant bending mode effect on natural frequency changes versus moment load parameters, ψ and µ. 3-13 and 24) the frequency and mixed mode distribution are shown for a case where only the dominant torque mode is taken into account.
Summarize
Introduction
Natural damped frequencies and Critical Buckling Moment
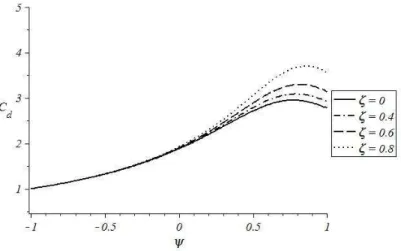
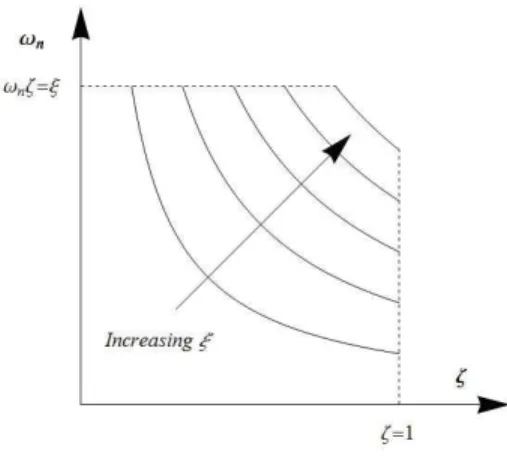
Therefore, from now on, the equations will be briefly presented to avoid any misunderstandings among the readers. The natural frequencies of the beam will be soft, similar to the case where there was no attenuation. Here it is worth noting that the gradient coefficient C(ψ,ξ) of the damped moment may be different if the dominant mode of the beam is different, i.e.
In dominant bending, the first bending frequency is the smallest frequency of the structure, while in torsion mode, the later mentioned frequency is the second frequency of the structure. In the figures (4-7 and 8) damped moment gradient coefficient is depicted for dominant bending and torsional mode respectively.
Forced Vibration
There are three roots to the third-order equation (4-3-4) and they are the function of the steady state moment load factor, µ, the moment gradient parameter ψ and the damping coefficient ξ. Before having the natural frequency distribution due to moment loading parameters (µ, ψ), the boundary constraints must be considered the same as that mentioned in Chapter 31. The first section will examine the natural frequency graph while the structure is loaded by an asymmetric moment (ψ = 1 ).
Specified moment load factor for a beam member where the frequency coupling will take place next while the asymmetric moment acts at the end of the beams can be determined using (4-3-8). For the second restricted case in vibration analysis, occurs when the natural torsional bending frequency ωt1 < ωb1.
Summarize
Introduction
Periodic excitation
Periodic solution
77 While (5-2-9) has infinite terms, and independent terms that must be set to zero, it can be written in two different matrices. -2-11) is an eigenvalue problem, to have non-trivial solutions, the determinant of the coefficient must be set to zero.
Instability graphs
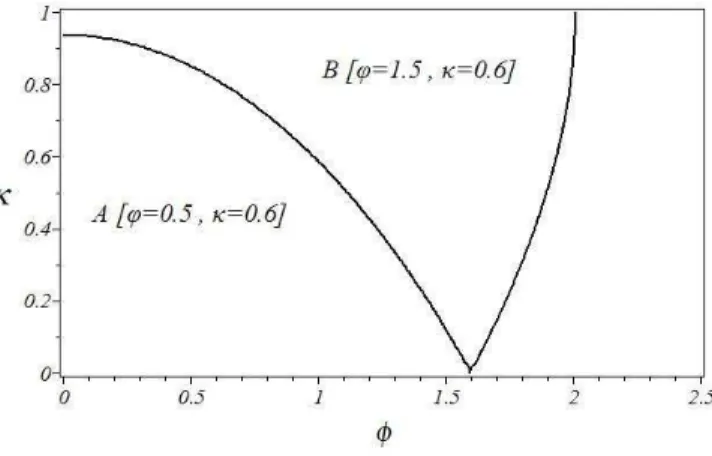
The accuracy of the solution needs to be demonstrated before other factors affecting the stability limits and unstable regions of the assumed beam are shown in this research. As a clear example, a point was chosen in the ratio of the excitation frequency above the fundamental natural frequency and the bending moment percentage plane (ϕ,κ). Then, by plotting one of the displacement time functions introduced as the unknown coefficient of the time function in the Ritz approximation formula (3-3-4) against time, the stability or instability of the structure is determined.
By using the space state method, the order of the equation of motion will be reduced by one. Two points will be selected from stable and unstable domains were mentioned in one of the previously drawn graphs.
Loading parameters effect on instability regions
In this way, with the help of Figures (5-4) and (5-5), the solution procedure leads to the derivation of (5-2-12) to find the stability limits and the plausibility of the unstable regions is proven. Figures (5-7) to (5-8) explain that stability limits can only be drawn for uniform loading if the first approximation of stability (5-2-12) is considered and the beam length is chosen. it somehow comes to this dominant bending mode. Returning to what was discussed in Chapter 3, 3.4.1, the fundamental frequency of the structure, ω, and the critical bending moment, Mcr, are different if the dominant bending or torsional mode is used depending on the structure. Figures (5-16) to (5-17) show the first unstable regions of the intended cross-sections, while their length has been chosen long enough for the bending mode to be the main capacity of the beam.
As can be seen, the structure will be unstable while loaded asymmetrically, but in bending mode the structure was stable in this case. This means that gradient loading can improve the stability of the structure, but it cannot be removed.
Summarize
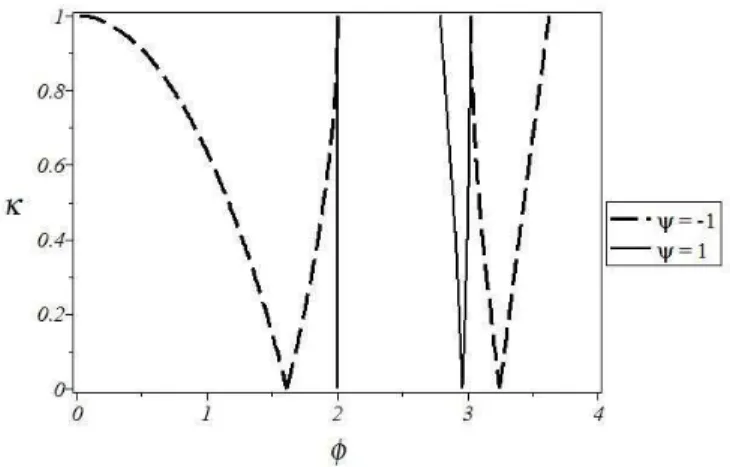
The use of additional terms, more than two terms for lateral deflection and more than one term for torsional deflection, has no significant effect on the stability regions while considering the first approximation of the stability analysis, Fig (5-2). When the bending mode is the dominant mode of a structure and the beam is loaded by an asymmetric moment, the beam will always be stable if the first region of instability of the first approximation of the stability analysis (5-2-12) is considered, Fig. 5-17). In the dominant torsion mode, there are regions of instability for each value of the moment gradient factor, ψ in the first region of instability of the first stability analysis approach, Figures (5-9) and (5-18).
By increasing the share of the static buckling moment percentage in initial moment load (the choice of higher λs) the width of the instability regions and consequently the instability of the beam will be increased. In this sense, the most stable position for the structure, when no static moment percentage (λ) applies, is numbers (5-10) to (5-15).
Introduction
Periodic solution
Terms in parentheses must be zero one by one due to the linear independence of trigonometric functions in (6-2-2), which in this case gives four independent equations, which must be zero. 92 The choice of two by two central elements as the first stability region analysis in damped case (6-2-9) leads to:. 6-2-11)'s determinant must be zero to have non-trivial solution.
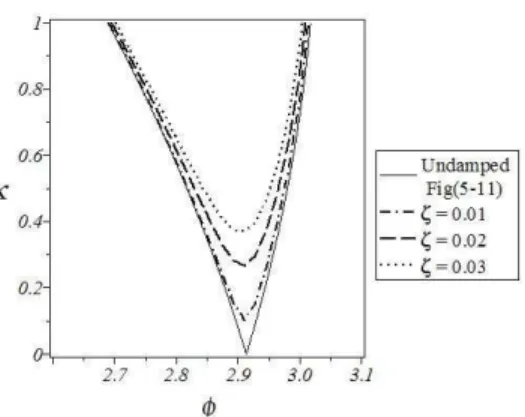
Damping ratio effect on instability graphs
Plotting the characteristic equation gives the limits of stability and regions of instability for the various parameters that were briefly mentioned at the beginning of this chapter in the introductory section. By choosing a beam length Figure (3-2) short enough, Figure (3-7), while CS4 is the selected section family, a predominantly torsional mode1 will occur. In this case, both effects of the loading boundary conditions (uniform moment and asymmetric) on the regions of beam instability are visible.
Figures (6-6) and (6-7) illustrate the unstable regions and stability limits of CS4 for uniform and symmetrical moment separately when the dominant torsional mode of the cross-section is selected.
In addition, when the torsional mode is considered for the structure, in the current CS4 survey, both uniform and asymmetric modes can be illustrated.

Summarize
Introduction
Assumptions
Coupled frequencies and critical buckling moment
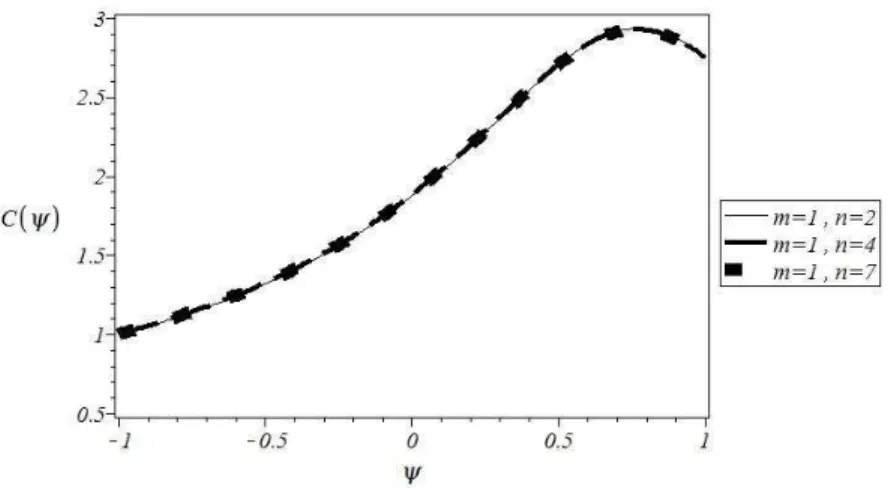
The moment gradient coefficient C(ψ) was defined as the ratio between the critical bending moment and the uniformly loaded critical bending moment. At the penultimate step, the characteristic equation was modified with the help of natural frequencies, critical bending moment and steady state moment factor, µ (represents the proportion of the critical bending moment on the element) and forced vibration analysis was performed. I.a) Optimal choices for Ritz terms are two terms for lateral deflection and one term for torsion. The frequency is equal to the first lateral bending frequency up to µc, after which it will be associated with an increase in the steady-state moment factor value up to one (full load) [45].
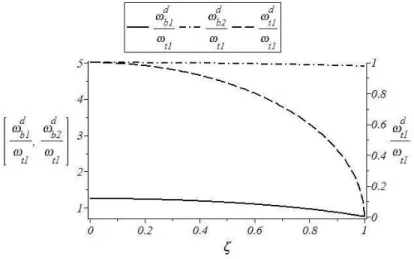
For cross-sections which have a dominant torsional mode, coupling occurs for any value of the moment gradient parameter ψ, and the steady-state moment load factor μ. 7.4 Coupled damped frequencies and critical bending moment. The steady-state critical moment factor, μc, which was given, was modified to μcd to cover the effect of the damping ratio.
Dynamic stability analysis (Un-damped)
Meanwhile, this ratio is reduced compared to undamped housing, when torsion mode is the dominant one. 100 III.b) By selecting the dominant bending mode, the beam for the asymmetric moment is stable for any value of the frequency ratio, ϕ, while changing around the first region of instability [47]. As a final part of this research, the damping effect on stability areas was studied.
By choosing different values for Rayleigh damping ratio, ζ, and static buckling moment percentage, λ, in initial time-periodic moment loading, the influence of these parameters on instability regions was elaborated.
Results utilization
8 APPENDIX
Cross section properties
Chapter three graphs and tables
Chapter four graphs
Chapter five figures
Chapter six figures
Mohammed, “Finite element analysis of dynamic stability of skeletal structures,” Journal of Zhejiang University SCIENCE, vol. Abbas, "Dynamic Stability of Timoshenko Beams by the Finite Element Method," American Society of Mechanical Engineers, p. Venkateswara, "Dynamic stability of a short cantilever column subjected to distributed axial loads," Computers and Structures, vol.
Rao, “Dynamic stability of cantilever columns resting on an elastic foundation,” Computers and Structures, vol. Thomas, "Dynamic stability of Timoshenko beams resting on an elastic foundation," Journal of Sound and Vibration, vol.