Thus, in principle, standard deviations of auction bids can be useful to get a picture of market uncertainty about future short rates even in the absence of well-developed interest rate option markets. Market expectations for future interest rates are of particular interest to central banks whose main instrument is the short-term interest rate. Bidders in these auctions try to guess the level of the spot interest rate that the market as a whole considers to be "fair".
The main motivation behind this was to see if it makes sense, in the absence of sophisticated interest rate options markets, to use auction data to get a picture of the market's uncertainty about future interest rates.
THE RELEVANCE OF PROBABILITY DENSITY FUNCTIONS OF THE SHORT INTEREST RATE
The structure of the paper is as follows: Section 1 outlines the ways in which the probability density function of the short-term interest rate can be useful to the monetary authority. The appendix uses Hungarian treasury auction data to check whether measures of auction bid dispersion in Hungary make sense as indicators of market uncertainty about future interest rates.
OPTION-BASED RISK-NEUTRAL DENSITIES (RNDS) AS MEASURES OF INTEREST RATE
The same interpolation can be done after translating the call price function into an implied volatility function using the Black-Scholes formula (or an appropriate version of it). Estimating the implied volatility "smile" curve, it can be translated back into the call price domain, yielding a continuous call price function, from which the (discounted) RND function can be derived as the second derivative . A terminal price density function consisting of independent lognormal densities can be sufficiently flexible, in particular it can be skewed and leptokurtic, thus producing the "smile" of observable empirical implied volatility.
Furthermore, if the level of risk aversion is constant, then changes in the implied RND can only be attributed to changes in the subjective probability distribution.
THE RELATIONSHIP BETWEEN AUCTION DISPERSION MEASURES AND INTEREST RATE
At any time before that, the fair value of the n-period spot rate is random and therefore has a probability distribution. Suppose we observe the distribution of the yield bids in an auction of the 3-month Treasury bill. This is the market's view at the time of the auction of the fair value of the 3-month interest rate in the form of a probability distribution.
For example, Friedman (1960) suggested that multi-price auctions (the type we will examine later) are primarily because of the.
THE INFORMATION CONTENT OF AUCTION DISPERSION MEASURES IN THE UK
D ATA ISSUES
One solution to these problems was to construct a standard deviation time series that, using a simple linear interpolation between the RND standard deviations corresponding to two consecutive option expiration dates, has a constant 6-month horizon, i.e. the two option expirations selected for interpolation are always second and third in order of expiration, ensuring that the end of the 6-month period is always between these two. 4 In theory, it would be more appropriate to use linear interpolation between variances instead of standard deviations.
Of course, a constant horizon shorter than 6 months would be a better fit for our data on 3-month T-bill auctions, but as mentioned earlier, the estimate of the standard deviations of the RND corresponding to the first expiration date is much better. unreliable because expiration is very close, so the RND of the first expiration date was omitted from the weighting scheme of Equation 3 and a 6-month horizon was chosen. Because of these data limitations, however, some further assumptions need to be added to those underlying the basic relationship between auction bid distributions and option-based RNDs described in the previous section in order to conduct a meaningful test of this relationship. A test of the relationship between the auction bid distribution and option-based RNDs will involve examining the time series behavior of the forward uncertainty curve with respect to the 3-month exchange rate, or more specifically, those two points on it that we can observe (at zero and 6-month horizons ).
To test this relationship, we will have to make an additional, and rather restrictive, assumption, namely that movements in the forward curve of interest rate uncertainty are systematic, that is, that some evidence in support of this assumption was found by a 9- the monthly constant-horizon implicit RND standard deviation is measured in a similar manner to that shown in Eq.3, and then it is checked whether it is cointegrated with the six-month measurement described earlier. Both series were I(1) in our sample, and a standard test (Engle-Granger 2-step) showed that they were cointegrated in the shorter subsample we used to test the cointegration between the auction dispersion measures and the implied period of six months. RND standard deviation (see section 4.2).
If we can show that some degree of uncertainty (variance, standard deviation or slope of the.
E MPIRICAL TESTS
The period from October 1996 to January 1997 brought the first sign of co-movement of the auction slope with the implied RND standard deviation. We argued earlier that the auction standard deviation expresses the uncertainty about the fair value of the spot 3-month rate or, alternatively, the uncertainty about an n-month rate m months ahead, where n+m=3. If the F-statistic is greater than the upper (I(1)) bound, then the null hypothesis of no long-run relationship between the regressors can be rejected without the need to know the exact order of integration of the regressors.
If the F-statistic is below the I(0) limit, the null of no long-run relationship cannot be rejected, but again, we do not need to know the order of integration of the variables to draw this conclusion. However, if the F statistic falls in the range between the limits, one cannot draw a final conclusion without knowing the order of integration of the variables. As shown in Table 1, we cannot conclude that either of the two dispersion measures was cointegrated with the implied RND standard deviation using the entire sample.
However, there is some weeks of evidence for the existence of a long-run relationship for the shorter sample: for both the auction slope and the standard deviation, the F statistic is above the 90% upper critical value. The point estimates of the coefficients in the long-run relationship can only be interpreted in the case of an equation that includes the standard deviation of the auction. The point estimate of the long-run multiplier has the correct sign and its magnitude is plausible.
The adjustment coefficients are around -0.3 for both the auction slope and the standard deviation ECMs, suggesting that a deviation of the auction distribution measures from their long-run values dictated by the implied RND standard deviation is corrected for approximately at 3 weeks. . We found some evidence, albeit weak, that there was a long-run relationship between measures of the 3-month auction distribution and the standard deviation of the 6-month constant horizon implied RND in a subsample that started around the same time. the time when the Bank of England was granted independence and changed the conduct of its monetary policy.
CONCLUSION
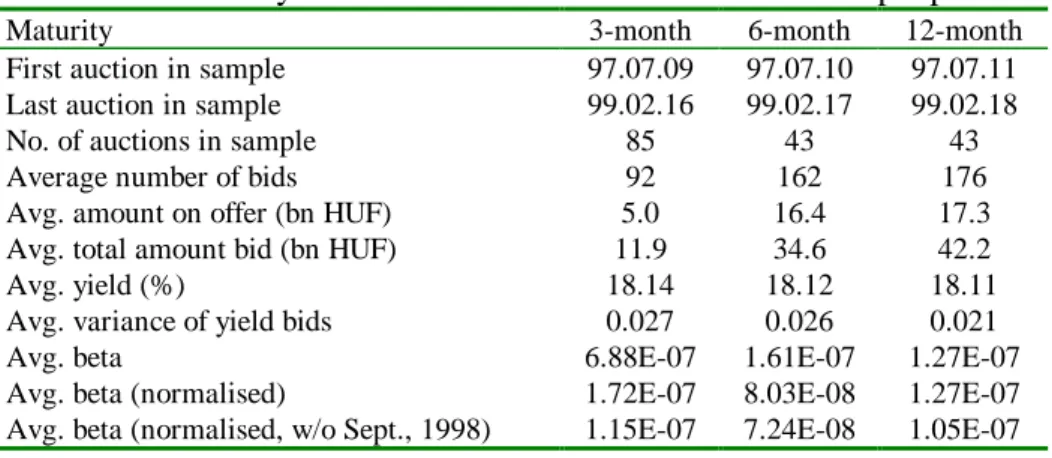
Under our assumption of shift-dominated movements in the forward uncertainty curve, this evidence suggests that the auction spread measures are a good approximation of short-term interest rate uncertainty for the short period in the future. In the following analysis, we used two measures of the dispersion of the bid distributions of 3-, 6-, and 12-month government bond auctions organized by the Government Debt Management Agency (GDMA).7 The first is the auction variance . yield bids (where the bid amounts were used as weights); the second is the slope coefficient of an OLS regression of the yield bids on the cumulative bid amounts. We have a sample of dispersion measures from the biweekly auctions of 6- and 12-month Treasury bills over a 3-year period (79 auctions).
Unfortunately, the sample period of the distribution measures of weekly 3-month Treasury bill auctions is shorter, covering only 20 months (85 observations). Therefore, it is not the market's uncertainty about the future course of the short interest rate that is responsible for this part of the variance, but rather it. Graph 3 shows the evolution of beta and the variance of the 12-month auctions of treasury bonds.
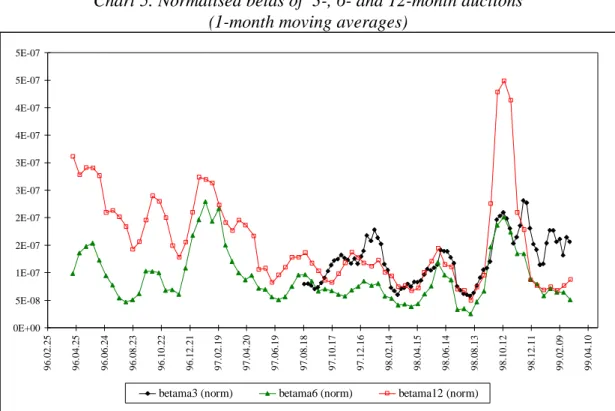
According to (1), we expect the original (unnormalized) beta of a 3-month T-bill auction to be approximately four times larger and that of a 6-month auction to be twice the beta of The 12-month auction on the same date, provided that the short-term interest rate uncertainty is the same at these three horizons. However, we assumed that this truncation did not deviate the measures of the distribution of the auction bid distributions from those of the subjective probability distributions, so if the time series analysis of the measures of the auction distribution corresponding to different maturities of Treasury bills shows that there is a significant positive correlation between them, we take it as an indirect proof of our hypothesis.
The normalized betas did not unambiguously indicate the increased interest rate uncertainty that the onset of the Southeast Asian crisis (October 1997) probably brought. One would expect that the abolition of the NBH's 1-year bond as a standing deposit facility on 1 April 1998 would have increased interest rate uncertainty. The effect of the Russian crisis on the Hungarian debt market became fully realized in September 1998.
Finally, the evolution of the auction distribution measures appeared to be consistent with our intuition about possible changes in interest rate uncertainty, based on knowledge of monetary policy steps and global and domestic money market events.